
Validity and Reliability of the Multidimensional Scale of Perceived Social Support in Colombian Adolescents
[Validez y fiabilidad de la escala multidimensional de apoyo social percibido en adolescentes colombianos]
Ana M. Trejos-Herreraa, Marly J. Bahamónb, Yolima Alarcón-Vásquezb, Jorge I. Véleza and Stefano Vinacciac
aUniversidad del Norte, Barranquilla, Colombia; bUniversidad Simón Bolívar, Barranquilla, Colombia; cUniversidad del Sinú, Montería, Colombia
https://doi.org/10.5093/pi2018a1
Received 25 April 2017, Accepted 24 July 2017
Abstract
The present study aimed to evaluate the psychometric properties of the multidimensional scale of perceived social support (MSPSS) in Colombian adolescents. We conduct a cross-sectional study and recruit 766 adolescents from 14 to 18 years old. The internal consistency of the scale was d and model fit from confirmatory factor analysis (CFA). The internal consistency of the scale was .84 (95% CI = 0.83-0.86), with small to negligible changes when specific items were ped. Construct validity was confirmed by the goodness of fit of a Three-Factor Model and correlation between items 3-4, 1-2, 6-7, and 5-6, AGFI = 31,680.98, BIC = 31,824.74, NNFI = .946, CFI = .975, and RMSEA = .049, confirming the model structure proposed by Zimet and colleagues. The findings demonstrate that the MSPSS is a suitable instrument to evaluate perceived social support in Colombian adolescents.
Resumen
Este estudio tiene como objeto evaluar las características psicométricas de la escala multidimensional de apoyo social percibido (MSPSS) en adolescentes colombianos. Se realizó un estudio transversal, reclutándose 766 adolescentes de entre 14 y 18 años de edad. Se analizó la consistencia interna de la escala y se obtuvo el modelo de ajuste a partir del análisis factorial confirmatorio (CFA). La consistencia interna fue de .084 (95% CI = 0.83-0.86), con ligeros cambios, despreciables, cuando se quitaron algunos ítems específicos. Se confirmó la validez de constructo mediante la bondad de ajuste del modelo trifactorial y la correlación entre los ítems 3-4, 1-2, 6-7 y 5-6, AGFI = 31,680.98, BIC = 31,824.74, NNFI = .946, CFI = .975 y RMSEA = .049, confirmándose la estructura del modelo propuesto por Zimet y colaboradores. Los resultados demuestran que la MSPSS es un instrumento adecuado para medir el apoyo social percibido de los adolescentes colombianos.
Keywords
Perceived social support, Psychometric properties, Factor analysis, Internal consistency.
Palabras clave
Apoyo social percibido, Propiedades psicométricas, Análisis factorial, Consistencia interna.
Correspondence: atrejos@uninorte.edu.co (A. M. Trejos Herrera).
Introduction Social support is defined as a psychosocial process that involves specific variables, considering the way in which it provides the meanings and values attributed to this support; also, it can only be understood based on a specific socio-historical context (Guzman, Huenchuan, & Montes de Oca, 2015). According to Cohen (2004), social support refers to the material, informational, and psychological resources that derive from the social network the person can count on to cope with stress. Feldman et al. (2008) affirm that social support can be given through all those surrounding the person and the resources they provide, which include tangible emotional support, the opportunity to share common interests and conditions for which they feel understood and respected. Andrade and Vaitsman (2002) understand social support as relationships that generate exchange, which is subject to obligations and bonds of mutual dependence, creating a sense of coherence of life. On the other hand, Gonzalez and Restrepo (2010) consider social support in the adverse situations that a person could live and the help that can receive from others to overcome such situations. It is important to emphasize that it is not only the presence of these elements that provide the social support, but the perception that the person has of them. Nowadays, social support is one of the most investigated protective factors because its positive results increase the resistance of an individual to transitions of life, daily stressors, and personal crises or in adaptation to living with chronic diseases (Adler & Matthews, 1994; Feldman, 2001; Ganster & Victor, 1988; Pacheco & Suárez, 1997, cited in Feldman et al., 2008). Moreover, the study of social support and the variables involved constitutes an area of interest in various disciplines. In Psychology, for instance, the study of social support is aimed at determining how subjects perceived social support in response to the processes of change that occur during their life cycle, and their effects on health, well-being, and quality of life. The Colombian National Mental Health Survey (Ministerio de Salud y Protección Social, 2015) highlights the importance of studying social support, which is referred to as exchanges between members of a network, or during relationships. In either case, what is “exchanged” is called transfers or supports, which may be of various types: material (money, accommodation, food, clothing, and payment for services), instrumental (care, transportation, and housework), emotional (affection, company, recognition, and listening) or cognitive (experiences, information, and advice) type. A survey assessing perceived social support in struggling adolescents revealed that 36% of them always find some degree of support, 18.1% almost always find some degree of support, 37% sometimes find it, and 8.9% never do. Among adolescents who asked for help, 94.4% went to family members, and 19.1% to friends. Although a high percentage of adolescents find social support, an important percentage of them do not always get it despite the need for it, given the process of individuation experienced by adolescents, and which is characterized by a struggle for autonomy and personal identity. By 2014, Colombia’s population exceeded 47 million, 22% of which were boys and girls (Unicef, 2014). In recent years, the conception of adolescence and the focus has shifted towards its positive aspects, and to show it as a period of evolution during which the adolescent faces a wide range of demands, conflicts, and opportunities. However, this does not mean that adolescence is not a difficult stage (both for the adolescent and those around them) in which family conflicts, mood changes, and exposure to risk behaviors may increase (Arnett, 2008; Compas, Wagner, Slavin, & Vannatta, 1996). Considering the characteristics of this stage of life, it is very important adolescents can perceive social support in different contexts. Some studies (Barrera & Li, 1996; Furman & Buhrmester 1992; Musitu, Buelga, Lila, & Cava, 2001; Musitu & Cava, 2003) have evaluated the perception of the support they receive from their parents, finding that those who perceive greater support use effective coping strategies and have better self-esteem and better social skills. However, this also depends on adolescence and age. In other words, as age increases, the perception of parents’ support decreases in the adolescence. Several studies have tried to establish the relationship between the perception of parents’ social support and friends’ social perception (Beest & Baerveldt, 1999; Dekovic & Meeus, 1997; Martinez & Fuertes, 1999; Musitu & Cava, 2003). Fuligni and Eccles (1993) have suggested that the relationships with friends or peers would be intensified when family relationships do not provide the support the adolescent needs. On the other hand, Dekovic and Meeus (1997) observed a positive relationship between parental support and greater satisfaction in peer relationships. This observation suggests that family relationships provide the tools for learning social skills and interpersonal schemes that facilitate or hinder relationships with friends or peers. Both relationships are mutually reinforcing and are considered necessary for the adolescent. Consequently, the study of social support is of special importance in adolescence, considering it as a multidimensional phenomenon that incorporates tangible elements such as events and current activities, as well as subjective aspects such as the perception and meaning. According to Cohen (2004), social support refers to the material, informational and psychological resources that derive from the social network with which the person can count on to cope with stress. Feldman et al. (2008) claims that social support can be given through people, resources, and surroundings. This social support provides tangible emotional support and the opportunity to share common interests and conditions for which they feel understood and respected. It is important to emphasize that it is not only the presence of the elements that provide the social support, but the way a person perceives them. The multidimensional scale of perceived social support (MSPSS; Zimet, Dahlem, Zimet, & Farley, 1988) is a self-reported measure that evaluates the perception of social support from three specific sources: family, friends, and other significant people. The MSPSS is brief, of easy application and use, which is favorable when the subject has little time or when several measures must be administered. Furthermore, the MSPSS has demonstrated psychometric validity in several studies conducted in different populations of adolescents and adults worldwide (Canty-Mitchell & Zimet, 2000; Cecil, Stanley, Carrion, & Swann, 1995; Chou, 2000; Kee-Lee, 2000; Dahlem, Zimet, & Walker, 1991; Eker, Arkar, & Yaldiz, 2000; Kazarian & MacCabe, 1991; Stanley, Beck, & Zebb, 1998; Zimet et al., 1988; Zimet, Powell, Farley, Werkman, & Berkoff, 1990), and validations continue to be performed with satisfactory results in terms of internal consistency (Arechabala & Miranda, 2002; Chou, 2000; Mosqueda, Mendoza, Jofré, & Barriga, 2015; Ng, Amer Siddiq, Aida, Zainal, & Koh 2010; Ortiz & Baeza, 2011; Pedersen, Spinder, Erdman, & Denollet, 2009; Pinto, Lara, Espinoza, & Montoya, 2014; Tonsing, Zimet, & Tse, 2012). On the other hand, exploratory factor analyses have shown that a 3-factor structure is suitable for the MSPSS in adolescent and adult populations with ethnic and socioeconomic diversity. However, some studies in eastern populations have shown a variation of this structure (Cheng & Chan, 2004; Chou, 2000). In Colombia, there is no evidence regarding the psychometric properties of this scale in the adolescent population. The internal consistency coefficient, Cronbach’s alpha, values for the 12 items of the MSPSS have demonstrated excellent internal reliability from previous studies that have used a variety of subject’s samples: α = .91 (Dahlem et al., 1991); α = .87 ± .94 (Stanley et al., 1998); α = .93 (Canty-Mitchell & Zimet, 2000); α = .89 (Chou, 2000); α = .80 ± .95 (Eker et al., 2000); α = .86 (Arechabala & Miranda, 2002); α = .91 ± .95 (Pedersen et al., 2009); α = .89 (Ng et al., 2010); α = .84 (Ortiz & Baeza, 2011); α = .90 (Tonsing et al., 2012); α = .80 (Pinto et al., 2014), and α = .88 (Mosqueda et al., 2015). The factor analyses of the studies mentioned above confirmed the three subscale structures of the MSPSS: family, friends, and significant other to account between 79.3% and 83.9% of the variance. A validation and adaptation to Colombian adolescent population is considered important due to the multiple and diverse situations of violence against children and adolescents in our country. Such violent situations, a rate of 87.61% in 2010, a dramatic increase compared to 2005, may include physical and psychological abuse in the nearest environment (i.e., at home or at the school), abandonment, sexual assault, forced displacement, trafficking, kidnapping, as well as the consequences of living in a context marked by political and criminal violence, the latter which can lead to be a victim of homicide or injury, the explosion of antipersonnel mines, the recruitment of armed groups or damage caused by the consumption and/or abuse of psychoactive substances. The internal armed conflict, combined with the drug production and drug trafficking as well as other criminal activities, presents a scenario in Colombia that crosses and complicates other violent occurrences that children and adolescents are being exposed to in their nearest environment (Unicef, 2014). In the absence of a validation in Colombian context, here we evaluate the psychometric properties of the MSPSS scale in schooled adolescents from Barranquilla, Colombia, and therefore contribute to the effective measurement of perceived social support and its subsequent use as a clinical screening tool in the adolescent population. MethodParticipants A total of 766 individuals from Barranquilla, Colombia, South America, participated in this study. Barranquilla, a modern city with a population of ~2.4 million in its metropolitan area, is the capital of the Atlántico area and is located on the Colombian Northwestern Caribbean coast. The prevalence of African descendants in this area is ~63% (Barragán, 2017) with a vast Amerindian contribution. Barranquilla’s community, on the other hand, is the result of a racial admixture between white Europeans from Andalucía, Spain, Africans, Syrian-Lebanese, Sephardi Jews, Germans, Italians, and English (Villalón, 2008). Participants with missing data on the MSPSS were removed, list-wise, resulting in a sample of 763 schooled adolescents (55.2% male and 44.8% female). The average age of all participants was 15.8 ± 0.984; no difference was found between boys and girls (15.84 ± 1.01 vs. 15.71 ± 0.945, p = .1064); 405 (53%) adolescents were in 10th grade and 358 (47%) in 11thgrade. No difference was found between the percentage of students attending these courses (χ2 1 = 2.66, p = .1028). Design and Procedure A cross-sectional descriptive study was performed as part of a multidisciplinary project whose main objective was to evaluate suicide risk in schooled adolescents in the city of Barranquilla. Data was collected between September and November of 2016. Thus, a battery of self-report scales, including the MSPSS (Zimet et al., 1988), the adolescent coping scale (ACS) (Frydenberg & Lewis, 1994), and the FACES III (Olson, Portner, & Lavee, 1985) was applied. The sample consisted of schooled adolescents (14 to 18 years old) from four public schools in Barranquilla. Participants completed all measures within 30 to 35 minutes (the MSPSS which took 5 to 10 minutes to complete), at a time that was convenient/agreed to/upon by the schools. In this study, individuals participated voluntarily. Ethical Approval and Informed Consent This study considered ethical aspects of research involving human beings considered in Resolution # 008430 of 1993 by the Ministry of Health of Colombia (Ministerio de Salud, 1993), which establishes the scientific, technical, and administrative norms for health research, and Law 1090 of 2006 (Ministerio de Protección Social, 2006) that includes professional secrecy, the right to decline participation or withdraw, informed consent, and return of results. Informed written consent was signed by parents; in this document, the objectives, procedures, risks/benefits, autonomy to continue or withdraw from the study, and the confidentiality of by-products of this research were clearly explained. Similarly, a signed consent assent form was requested from all adolescents to whom a verbal explanation was given. Instruments The MSPSS (Zimet et al., 1988) is a 12-item instrument that measures the perceived adequacy of social support from three sources: family members (items 3, 4, 8, and 11), friends (items 6, 7, 9, and 12), and other significant people (items 1, 2, 5, and 10). Ratings of these 12 items were made on a 7-point Likert-type scale ranging from very strongly disagree (1) to very strongly agree (7). The total score corresponds to the sum of the scores of each answered item, with the higher/lower score corresponding to a greater/lower perceived social support. The MPSS original instrument was translated to Spanish by the authors of this study, and revised by experienced psychologists and experts in the English language. The adolescent coping scale (ACS) (Frydenberg & Lewis, 1994) was designed to measure the frequency of usage of a variety of coping strategies typically used by adolescents between 12 and 18 years old. It consists of a total of 80 items (one open-ended question) that reflect different ways of coping and that are rated on a 5-point Likert scale based on the frequency with which the adolescent feels that he/she uses that strategy (1 = it never happens to me or I never do it, 5 = it happens very frequently or I very frequently do it). The 18 coping strategies can be grouped into four different major coping dimensions: positive and effortful action, hedonist-positive action, intropunitive avoidance, and introversion. ACS can be administered individually or collectively in 10 minutes. According to the authors, the ACS reached coefficients of internal consistency that oscillates between .62 y .87 (M = .73) in the specific form (that allows to evaluate the answers to a particular problem mentioned by the subject or proposed by the examiner) and between .54 y .84 (M = .71) in the general form (subject coping with their problems in general; Frydenberg, 1997); both forms contain the same items, although they vary in the application instructions. The test-retest correlations were more moderate than high; about 50% of the coefficients were less than .70 in both general and specific forms. The FACES III (Olson, et al., 1992; Olson et al., 1985) was developed to assess two major dimensions on the circumplex model: adaptation and cohesion of the family. The circumplex model is a classification system of 16 family types and three or more general types: balanced, mid-range, and extreme. The measure can be used with families across the life-cycle from newlyweds with no children to retired couples. The authors report that children over 12 years old can complete the FACES III to allow for comparisons between family members. Family cohesion assesses degree of separation or connection of family members to the family. There are four levels of family cohesion, ranging from extreme low cohesion to extreme high cohesion: disengaged, separated, connected, and enmeshed. There are four levels of adaptability: rigid, structured, flexible, and chaotic. It is a self-report instrument consisting of 20 items rated on a 5-point Likert scale (1 = never, 5 = almost always). In the Peruvian population (Bazo et al., 2016) the results of the reliability analysis for the scales of cohesion, real and ideal, showed high levels of reliability (internal consistency), never lower than .79. The flexibility scales, real and ideal, showed moderate reliability levels, between .55 and .86. Statistical Analysis Measures of central tendency and dispersion were estimated for continuous variables, and frequencies and proportions for categorical variables. Normality of continuous variables was assessed using the Shapiro-Wilks test. A canonical correlation analysis between categorical variables was performed using Pearson’s linear correlation coefficient. Unless otherwise stated, all statistical analyses were performed in R version 3.3.2 (The R Foundation, 2016). To determine the psychometric properties of the MSPSS, the internal consistency of the scale was calculated using the Cronbach’s. Confirmatory factor analyses was also performed. Confirmatory factor analysis was performed using the psych and lavaan package (Rosseel, 2012) in the R Project for Statistical Computing (Revelle, 2016). Bearing in mind that the KMO test was .84 and Bartlett’s test applied to the correlation matrix χ2 66 = 3505.4, p < .0001 (Figures 1a, 1b), showing a multivariate normal distribution, we used Maximum Likelihood Estimation (MLE) method due to their properties of consistency, asymptotic normality, functional invariance, and higher-order properties (Ximénez & García, 2005). Seven models were developed to identify which of these had the best fit. Model 1 considered the existence of three independent factors, F1, F2, and F3 (that is, no correlation between them was allowed), whilst Model 2 allowed such correlations. Models 3 to 6 are similar to Model 2, but in addition to allowing correlations between factors, it also included correlations between items within factors. For instance, in Model 3 we considered a 3-factor structure and allowed items 3 and 4 to be correlated. Model 7 hypothesizes the existence of three factors and a global factor that depends on them. The quality of the fitted factorial models was assessed using a battery of performance measures that included the Akaike’s Information Criterion (AIC), the Bayesian Information Criterion (BIC), the Non-Normed Fit Index (NNFI), the comparative fit index (CFI), and the root mean square error of approximation (RMSEA). The goodness of fit of the model was determined using the Confirmatory Factor Analysis (CFA) technique. To ensure confidence in parameter estimation and model adjustment, without depending solely on the sample size criterion, we chose to complement adjustment indices based on the statistical significance of χ2 with other fit indices that allowed us to penalize an excess of adjusted parameters of the asymptotic chi-square test, as Akaike’s Information Criterion (AIC), to estimate the goodness of fit from the maximum likelihood of the model and the complexity from the number of parameters; the Bayesian Information Criterion (BIC) was used to measure the degree of certainty that a certain model is the true model generating the data as a consistent criterion, for both criteria, the model with the minimum value of AIC and BIC among the candidate factorial models was selected. However, because the AIC and BIC criteria may entail an excessive simplification of the complexity meaning of the model, we also used other fit indices like Non-Normed Fit Index (NNFI), Comparative Fit Index (CFI), and the Root Mean Square Error of Approximation (RMSEA), all of which are less affected than other indices by sample size and model complexity; it was assumed, with respect to the analysis, that RMSEA values over .10 would suggest an unacceptable model fit while values below .05 would indicate a close model fit. As additional fit indices, CFI and NNFI are bound between 0 and 1. Values below .90 and .95 indicate a non-satisfactory model fit whereas values greater than .95 suggest a close model fit (Schulz, Ainley, & Fraillon, 2011). ResultsInternal Consistency The coefficient of internal consistency for the complete scale was .84 (95% CI = 0.83-0.86), with similar results in the family support (items 3, 4, 8, and 11; α = .82; 95% CI = 0.80-0.84), support from friends (items 6, 7, 9, and 12; α = .84; 95% CI = 0.82-0.86) and support from other significant people (items 1, 2, 5, and 10; α = .75; 95% CI = 0.72-0.77) subscales; the correlations between the items, the dimensions and the overall score were significantly high (Table 1). Furthermore, when specific items are dropped from each subscale the internal consistency coefficient remains within acceptable limits to consider the MSPSS subscale as a psychometric instrument in this population (Table 1). Overall, our results suggest a good-to-acceptable internal consistency of the MSPSS when applied to schooled adolescents from Colombia.
Table 1 Internal Consistency for the MSPSS Scale in a Colombian Sample 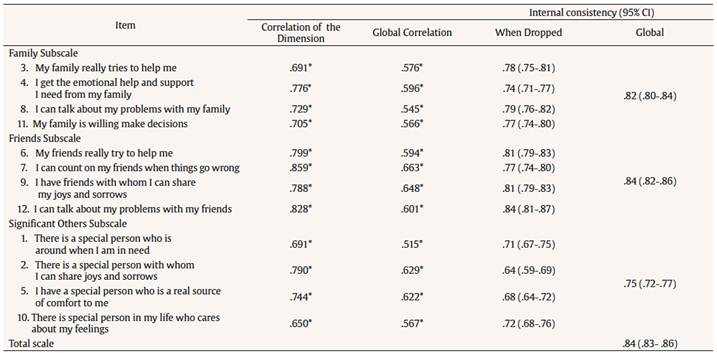 Relationship between Social Support, Gender and Age A canonical correlation analysis was performed using Pearson’s linear correlation coefficient. It was found that family support decreases with age (r = -.10, p = .0053), that there is a gender effect once it is corrected for age (F1, 755 = 5.47, p = .0196), and that the total score for the family subscale in men is ~0.882 (standard error [SE] = 0.3773, p = .0197) points higher than in women after correcting for age. Similarly, support from friends decreases with age (r = -.082, p = .022), there is a gender effect once it is corrected for age (F1, 755 = 11.705, p < .001), and the total score is ~1.35 (SE = 0.3959, p = .0006) points lower in men than in women. As for the dimension of significant people, a gender effect (F1, 755 = 10.71, p = .001) but not an age effect was found (r = -.02, p = .571), and the total score in this subscale was ~1.2 (SE = 0.36804, p = .0011) points lower in men when compared to women. Confirmatory Factor Analysis We fitted seven models of different structure and assessed their goodness of fit using a battery of criteria (see Methods section). The main results are presented in Table 3. Model 1 considered the existence of three independent factors F1, F2, and F3 (that is, no correlation between them was allowed), whilst Model 2 allowed such correlations. Model 3 are similar to Model 2, but in addition to allowing correlations between factors P3~P4; Model 4 as model 2 with P3~P4, P1~P2; Model 5 as model 2 with P3~P4, P1~P2, P6~P7; Model 6 as model 2 with P3~P4, P1~P2, P6~P7, P5~P6; and Model 7 hypothesizes the existence of three factors and a global factor that depends on them. Values of χ2 and df are displayed for each model (Table 3). According to the performance measures in the Statistical Analysis section, Model 6 was selected followed by Model 5. This selected model suggests the existence of three correlated factors with correlated items within factors, whilst Model 5 is similar but does not allow correlation between items 5 and 6 of the MSPSS scale. Furthermore, the index values are AIC = 31680.98, BIC = 31824.74, NNFI= .946, CFI= .975, and RMSEA= .049, suggesting that this model fits the data well. Figure 1c depicts the estimated structure of the 3-factor model along with the existing correlation among composing factors. As expected, F1 is comprised by items 6, 7, 9, and 12 (support from friends, Table 1), F2 by items 3, 4, 8, and 11 (family support, Table 1), and F3 by items 1, 2, 5, and 10 (support from other significant people, Table 1). Table 2 shows the factor (pattern) matrix for the 3-factor model and suggests that the variance of each item is fairly explained by the model.
Table 2 Factor (pattern) Matrix for the MSPSS Scale 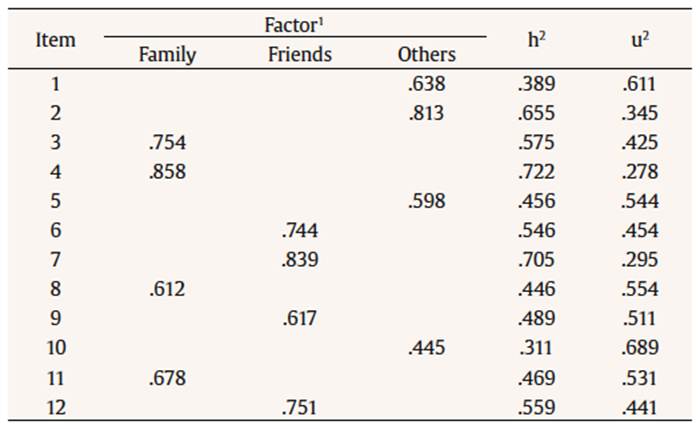
Table 3 Results of the Confirmatory Factor Analysis Applied to the MSPSS Scale in a Caribbean Community 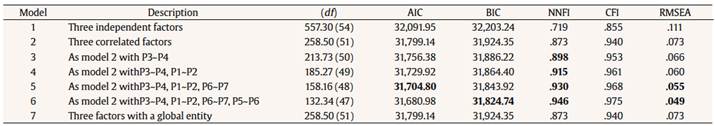
Figure 1 (a) Kaiser-Meyer-Olkin (KMO) test for individual items of the MSPSS scale. Here, values between .80 and .90 represent meritorious sample adequacy to apply factor analysis to the data; (b) Scree plot for the MSPSS scale. Using the Kaiser criteria (above blue line), a 3-factor structure is chosen; (c) Structure of the 3-factor model. Values between factors (F1, F2, and F3) and items (P1, P2, … ,P12) correspond to the pattern matrix in Table 2, whilst those between factors are the estimated linear correlation coefficient. Thus, the correlation between F1 and F2 is .337, between F1 and F3 is .461 and between F2 and F3 is .429. These correlation values are statistically significant at 5%. 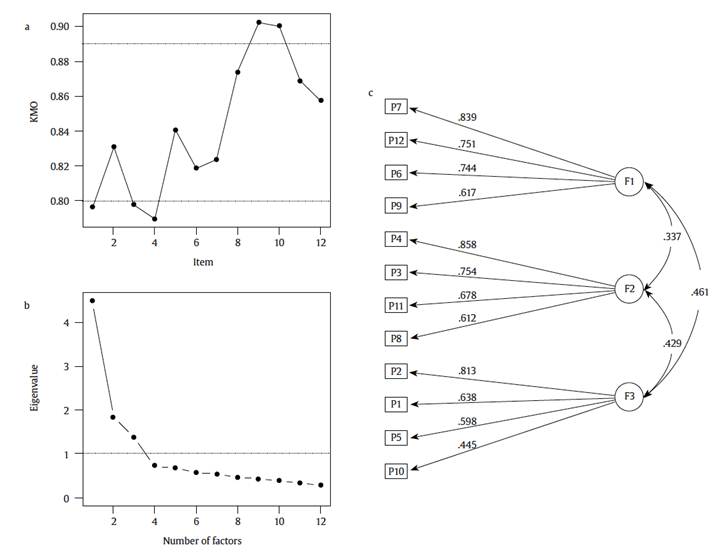 Convergent Validity Correlation with other scales. The results concerning the convergence validity of the MSPSS with the FACES III (Family Cohesion and Family Adaptation subscales) and ACS (seek social support and seek professional help coping strategies) instruments showed significant correlations between several dimensions. Specifically, a high significant correlation was identified between the family members of MSPSS and family cohesion of the FACES III (.415), among friends of MSPSS and seek professional help of the ACS (.332), and among other significant people of MSPSS and seek professional help of the ACS (.306). Other significant but less strong correlations were identified between the family members of MSPSS and family adaptation of the FACES III, and between friends and other significant people of MSPSS with the seek social support of the ACS (Table 4).
Table 4 Discussion Correlations of the MSPSS with FACES III and ACS Scales 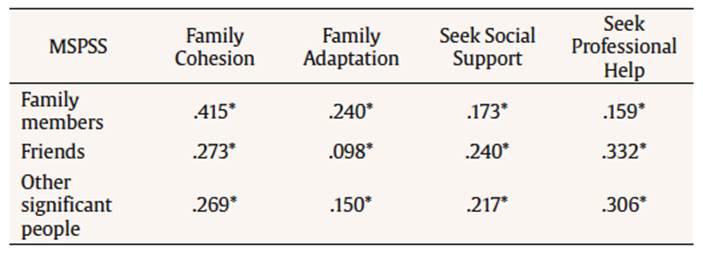 The perception of social support that people have is a source of protection for different stressful events. In adolescents, social support provides psychological resources for the youth to make different interpretations of their reality and possible alternatives to the problems (Acuña & Bruner, 1999). The findings of this research show that age has an important role in the way adolescents perceive social support: as age increases, the adolescent perceived less social support from their parents and friends. These results are consistent with previous studies (Barrera & Li, 1996; Furman & Buhrmester 1992; Musitu et al., 2001; Musitu & Cava, 2003). In relation to the psychometric properties of the instrument, internal consistencies of .84 for the whole scale and between .75, and .84 for the subscales were found. Unlike previous results found in a population of older adults where the reliability indexes vary between .85 and .88 (Arechabala & Miranda, 2002; Pinto et al., 2014), our data show a similar behavior of the MSPSS scale in the adolescent population (Bruwer, Emsley, Kidd, Lochner, & Seedat, 2008; Mosqueda et al., 2015). Regarding the number of factors, we found that a 3-factor structure explained 64.1% of the variance. This result is in line with other studies with adolescents (Canty-Mitchell & Zimet, 2000; Edwards, 2004; Zimet et al., 1990) but differs from those in a population of older adults where a 2-factor structure (that is, unify the subscales family and other significant people) was more appropriate (Arechabala & Miranda, 2002). The most conclusive results of this study indicate that both in the exploratory and confirmatory factor analyses the total variance is better explained (~64%) by a 3-factor structure. This figure is similar to the 69.3% reported by Mosqueda et al. (2015). Although the instrument is valid and reliable for the adolescent population, it is necessary to take into account other variables that may be a source of social support in this vital stage, considering that there is still a 36% of variance that could not be explained by the instrument’s intrinsic 3-factor structure. In this sense, other studies may consider formal sources of social support such as school, health, and religious groups, as well as strategies mediated by information and communications technology that serve the adolescent population to express and feel support from other people, such as forums, groups, and other virtual resources. Within the limitations of the study, it can be pointed out that it would be important to consider in future studies a more detailed characterization of the ethnicity to which the participants belong. Another aspect to consider is the size of the sample, because it would be interesting to perform cross-validation processes that allow the execution of exploratory and confirmatory factor analysis in order to reduce the limitations in the generalization of the model. Referencias |
Apoyo social percibida, Propiedades psicométricas, Análisis factorial, Consistencia interna.
Correspondence: atrejos@uninorte.edu.co (A. M. Trejos Herrera).
Copyright © 2026. Colegio Oficial de la Psicología de Madrid


 PDF
PDF e-PUB
e-PUB CrossRef
 JATS
JATS Print
Print Send
Send