Do you Feel Safe in the Urban Space? From Perceptions to Associated Variables
[┬┐Se siente seguro en el entorno urbano? De la percepci├│n a las variables asociadas]
Vanessa Azevedo1, Ana Sani2, Laura M. Nunes3, and Daniela Paulo1
1University Fernando Pessoa, Porto, Portugal; 2Centro de Investiga├ž├úo em Estudos da Crian├ža da Universidade do Minho (CIEC), Braga, Portugal; 3Centro de Investiga├ž├úo em Justi├ža e Governa├ž├úo (JusGov), Braga, Portugal
https://doi.org/10.5093/apj2021a12
Received 28 September 2020, Accepted 4 November 2020
Abstract
This study aims to provide answers to the following questions: Do you feel safe at Historic Centre of Porto (HCP)? Do you think that crime is increasing? What are the most and less frequent crimes? And the most feared crimes? What conditions promote criminal occurrences? What incivilities occur at HCP? What measures can be taken to increase security? What variables are related to the perception of insecurity? Through the application of the Diagnosis of Local Security Questionnaire, 554 participants that attended HCP were assessed (58.5% women, mean age = 43.82). One in five participants reported feelings of insecurity due to the presence of crime/danger. Robbery, theft, and drugs traffic were perceived as the most common crimes; participants were especially fearful about robbery and theft. Nationality, education, criminal variables, adequacy and satisfaction with policing, seek for formal support, and years living/studying/working at HCP were variables related to perception of (in)security.
Resumen
Este estudio tiene como objetivo proporcionar respuesta a las siguientes preguntas: ¿se siente seguro en el Centro Histórico de Oporto (CHO)?, ¿cree que la delincuencia está aumentando?, ¿cuáles son los delitos más y menos frecuentes?, ¿y los crímenes más temidos?, ¿qué condiciones fomentan los actos delictivos?, ¿qué faltas de civismo ocurren en el CHO?, ¿qué medidas se podrían tomar para aumentar la seguridad?, ¿qué variables están relacionadas con la percepción de inseguridad? Mediante la aplicación del Cuestionario de Diagnóstico de Seguridad Local se evaluó a 554 participantes que asistieron al CHO (58.5% mujeres, edad media 43.82). Uno de cada cinco participantes manifestó sensación de inseguridad debido a la presencia de delitos/peligro. El robo, el hurto y el tráfico de drogas se percibían como los delitos más comunes; los participantes temían principalmente el robo y el hurto. La nacionalidad, la educación, las variables penales, la adecuación y la satisfacción con el trabajo policial, la búsqueda de apoyo formal y los años de vida/estudio/trabajo en el CHO fueron variables relacionadas con la percepción de (in)seguridad.
Palabras clave
Diagn├│stico de seguridad local, Seguridad, Violencia urbana, Percepci├│n de (in)seguridad, DelincuenciaKeywords
Diagnosis of local security, Safety, Urban violence, Perception of (in)security, CriminalityCite this article as: Azevedo, V., Sani, A., Nunes, L. M., and Paulo, D. (2021). Do you Feel Safe in the Urban Space? From Perceptions to Associated Variables. Anuario de Psicolog├şa Jur├şdica, 31(1), 75 - 84. https://doi.org/10.5093/apj2021a12
vazevedo@ufp.edu.pt Correspondence: vazevedo@ufp.edu.pt (V. Azevedo).According to the well-known pyramid of needs from Maslow (1943), safety and security are the second-level basic needs that should be satisfied for all humans. In a more recent work, entitled Needs and subjective wellbeing around the world, Tay and Diener (2011) assessed the association between the fulfilment of needs and subjective well-being across a sample of 123 countries from eight sociocultural regions of the world (i.e., Africa, East & South Asia, Former Soviet Union, Latin America, Middle East, Northern Europe/Anglo, South East Asia, and Southern Europe). Authors found that, in a range from 0 to 1, the mean number of security for individuals was .53 (SD = .50) and .54 (SD = .15) for countries, being particularly relevant for participants from Middle East and Northern Europe/Anglo. Additionally, they concluded “the society in which one lives has strong associations with whether a person’s basic and safety need are met” (p. 363), which interplayed greatly with life evaluations. Concomitantly, there is an increasing trend toward the concentration of people in cities – according to forecasts nearly 70% of the world population will live in urban areas (United Nations - DESA/Population Division, n.d.). This phenomenon constitutes a double-edged sword: on one hand, the city is the place of opportunities and creation of services and goods and, on the other hand, due to the high concentration of people, wealth, and social inequalities, the city becomes an attractive place for crime and violence occurrences (United Nations Humans Settlements Programme, 2007). Therefore, it is not surprising that livability rankings included security and criminality data as one of the indicators (Okulicz-Kozaryn, 2013), being crucial to study perceptions of (in)security about urban space and associated variables. The remainder of this paper is organized as follows. First, we will review conceptual issues and empirical data about perceptions of insecurity, presenting the diagnosis of local security and related variables. Then, the current study is presented in detail. In the Method section, we described the study area, participants, measure, procedures, and statistical analyses. Next, results will be presented. Lastly, our findings will be compared to previous studies in the Discussion section. Perceptions of (in)Security: Conceptual Issues and Empirical Data The study of perception of (in)security comprises particularly several obstacles that need to be discussed. Not infrequently, the concepts perception of insecurity and fear of crime are applied interchangeably, as if they embodied the exact same when actually represent distinct constructs. Indeed, an individual may be able to perceive a certain area as unsafe, while simultaneously not be afraid to be victimized (Curiel & Bishop, 2016). According to Guedes (2016, as cited in Cardoso et al., 2019), perception of (in)security can be organized in two distinct dimensions: objective and subjective. The first dimension – objective insecurity – includes the factual information about juvenile delinquency, urban disorders, and predatory crimes, which can be collected through official statistics. According to the same authors, objective insecurity impacts on subjective insecurity, which includes fear of crime, risk perception, and safety behaviors. Moreover, fear of crime should be conceptually distinguished from risk perception: while the first comprises an emotional reaction toward the self or others, risk perception comprises a cognitive dimension. Despite these conceptual differences, most of the time perception of subjective insecurity and fear of crime are used (and even assessed) interchangeably (Ladenburg et al., 2016), becoming difficult to distinguish between them. In this study we assessed several variables that can be included in the subjective insecurity, such as the feeling of insecurity, most feared crimes, or perceptions about incivilities. Perception of (in)security, either on individual or collective level, refers to individuals’ perception about the environment in which they are inserted that results from the interpretation of the risks or dangers made at specific times and contexts, which translates into a concrete perception of the threat of violence (Lourenço, 2009). Due to the incidence of some social problems in cities, such as unemployment, social exclusion, instabilities in families, and social networks, it is predominantly an urban phenomenon (e.g., Carro et al., 2010; Lourenço, 2010). Perception of (in)security involves signs of physical and social disturbance, along with fear and concern for order, affecting the individual and collective wellbeing; consequently, perception of insecurity is regarded as one of the most severe issues of our times (Collins & Guidry, 2018; Lourenço, 2010). Empirical data about the perception of (in)security across the occidental world suggested that the majority of participants revealed that they felt safe, although figures are quite different. For instance, in a study in the USA with 2,610 participants, 64% answered they never felt unsafe (Porter et al., 2012). In Europe, in a study with 1,312 participants from Finland, Turunen et al. (2010) found that 96% of the respondents felt safe or very safe at the neighbourhood. In Italy, Valente et al. (2019) asked 15,428 residents to rate subjective feelings of unsafety on a 10-point Likert scale, ranging from very safe to very unsafe, and concluded that the mean was 4.36. In Scotland, Allik and Kearns (2017) compared perception of (in)security at house and in the streets and found that 35.1% felt safe at their own homes, but only 15.7% reported feeling safe walking alone at night. According to the latest European Social Survey (2019), 15.3% of the Portuguese participants reported feeling unsafe or very unsafe walking alone in the local area after dark. Based on the British Crime Survey (Allen, 2006), people seemed to be particularly worried about theft of a car, rape, burglary, physical attack, mugging, and theft from a car and less worried about being insulted or pestered in public and racially motivated attacked. In studies focused on university students samples, Wilcox et al. (2007) found that 41.87% were worried about sexual violence, 38.42% were worried about physical violence, and 21.83% were worried about stalking victimisation (all crimes being perpetrated by strangers). Concerning property crime, according to a study by Cook and Fox (2011), during the day students feared mainly vehicle burglary (21%), vandalism (17%), and property theft and vehicle theft (16%). Incivilities, also known as social or physical disorders, may also be relevant for the perception of insecurity. More specifically, the literature identified a set of situations, such as teenagers hanging around on the street, people being drunk or rowdy in public spaces, gang activity, vandalism, sales of drugs graffiti, other deliberate damage to property or vehicles, litter , and degeneration, noise, and poor condition of urban furniture, that seems to influence the perception of (in)security and to promote criminal occurrences (Ladenburg et al., 2016; Valente & Pertegas, 2018). Lastly, it is interesting to revisit public opinion toward improvements on security. For instance, Lindgren and Nilsen (2012) asked to both residents and staff about the topic, through qualitative interviews, and the most valued measures were improvements on lighting and clear up shrubs and trees. Moreover, installing time-locks on entrance doors, conducting safety walks, and increasing vigilance at night were also suggestions presented by the participants. According to Turunen et al.’s (2010) study, 13.0% of the individuals asked for information concerning security in the neighbourhood, 30.1% asked for information from complementary counselling services and 21.6% from municipal services. Both safety and security contribute to an improvement in economic situation, which may be achieved by the decrease of poverty as well as social exclusion, therefore, contributing to the community’s sustainability and well-being (General Directorate of Internal Admnistration [GDIA, 2009]). Previously to the review of the factors involved in the perception of (in)security, we presented the “diagnosis of local security” as a tool to understand insecurity and crime-related issues within a specific community. Diagnosis of Local Security: An Overview Community security, based on local partnerships among individuals affected by insecurity and others whose duty is to promote and preserve the community’s health, welfare, and security, in a collaborative effort to recognize problems and develop effective solutions, seeks to improve the security scenario and the ability to withstand violent pressures associated to conflict and crime (United Nations Development Programme, 2009). Thus, diagnosis of local security (DLS) represents a fundamental and an undoubtedly pertinent tool to obtain a clear perspective of criminality and victimisation, constituting the groundwork for crime decrease and to promote both personal and collective security (GDIA, 2009). The DLS is a methodical analysis developed not only to get a better understanding of both crime and victimisation situations that occur in a certain delineated area, but also to establish available resources for preventive action. Ultimately, it helps to develop a strategy and an action plan according to the priorities previously identified. Guidelines for application and international practices were proposed by the European Forum for Urban Safety, through a compendium, being translated to Portuguese by the GDIA. Briefly, besides criminal and victimisation information, the DLS collects data on the political and institutional context, local population and their perceptions, crime effects and impact and projects already applied to potentially reduce difficulties. Ideally, this approach involves multidisciplinary teams or partnerships with local authorities (e.g., police). In this case, partnerships would allow for a better definition of intervention strategies by organizations of formal social control to guarantee security in spaces used by the citizens (Sani & Nunes, 2017). Given the challenges associated with urban space (Nunes et al., 2017; Sani et al., 2019), it is this kind of commitment that will generate significant results and impacts (GDIA, 2009). Factors Affecting Perception of (in)Security Perception of (in)security seems to be influenced by several variables, such as sociodemographic factors (e.g., age, gender, education, household status, and occupation status), past victimisation experiences, and physical factors (e.g., neighbourhood conditions) that contributed to a specific area to be perceived as unsafe (Carro et al., 2010; Curiel & Bishop, 2016). In turn, this may impact a person’s life and behavior, encouraging vigilance and adoption of routine preventive measures in order to avoid unnecessary risks (Jackson & Gray, 2010). Concerning the influence of sociodemographic variables on security-related issues, perceived insecurity and fear of crime are associated with vulnerability, particularly in relation to women and elderly citizens (e.g., Kullberg et al., 2009; Valera-Pertegas & Guàrdia-Olmos, 2017). Particularly concerning gender, women seem to have a propensity to feel more unsafe than men (Carro et al., 2010; Kullberg et al., 2009; Valera-Pertegas & Guàrdia-Olmos, 2017). Based on the latest European Social Survey (2019), in Portugal there were gender differences in feeling of security of walking alone in the local area after dark, namely there were twice more women who reported feeling unsafe or very unsafe than men (20.33% vs. 8.39%). According to Valera-Pertegas and Guàrdia-Olmos (2017) research, there were clear differences between men and women due to the fact that women present a lower perception of control and ability to cope with potentially threatening situations, greater sensitivity towards the social representation of insecurity, more direct and indirect victimisation experiences, lower perceptions of environmental quality of the place, greater levels of intolerance toward possible antisocial behaviors, and higher perception of incivilities than men. These findings are in accordance with conclusions drawn by other researchers (Jackson, 2011; Killias & Clerici, 2000). Similarly to gender, age is frequently studied in this field of research, since elderly tend to perceive greater insecurity than younger people (e.g., Kullberg et al., 2009). Both phenomena are usually known as the fear of victimisation paradox, which consists of high levels of insecurity despite the low values on victimisation experiences (Hale, 1996). According to Kullberg et al. (2009), education, country of birth, household status, and type of housing were not significantly associated with insecurity in the surroundings. For Covington and Taylor (1991), education may be assumed as a proxy factor for social class (i.e., lower classes are supposed to correspond to people less educated). These authors concluded that individuals who live in intimidating neighbourhoods, in closer proximity to potential offenders, felt less safe than those living in a higher-class neighbourhood characterized by fewer disturbances and great accessibility to services like policing. Nationality is a less studied variable; however, Carro et al. (2010) and Allik and Kearns (2017) found that immigrants presented great levels of perceived security than natives. As stated above, victimisation experiences, both direct and indirect, seem to impact on perception of (in)security. For instance, Covington and Taylor’s (1991) study showed that in neighbourhoods where residents learned about latest criminal occurrences presented high perceptions of insecurity. Similar findings were observed by Kullberg et al. (2009), Turunen et al. (2010), and Visser et al. (2013) concerning direct victimisation. However, it should be noted that according to Covington and Taylor (1991) direct victimisation only had an effect at neighbourhood level, suggesting a high perception of insecurity by those residents who had been victim of crime. Additionally, perception of insecurity had also been linked to the occurrence of crime in certain urban areas; therefore, it is also important to determine crimes perceived by the population as frequent and if the area is perceived as a high crime concentration site. Incivilities, as described by Roché (1996, cit. in Lourenço, 2009), comprise minor violations of community norms, which can result in the loss of standards commonly adopted by communities (LaGrange et al., 1992). These authors differentiated disorderly physical surroundings from disruptive social behaviors. The first ones described the disorders of the physical environments (e.g., trash and litter, unkempt lots, abandoned vehicles, condemned houses, and damaged storefronts), while disruptive social behaviors include antisocial conducts, such as public drinking, rowdy and loitering persons, panhandlers, and thoughtless neighbours. Incivilities may not constitute criminal activity per se, but they are still included in criminal variables, since they can contribute to the perception of (in)security, impacting on wellbeing-being and quality of life of citizens and indicating the inability of administrators to cope with problems (Kullberg et al., 2009; LaGrange et al., 1992; Lourenço, 2009, 2010). The presence of incivilities leaves no space for doubts about the deterioration of physical spaces and, as consequence, the public image of a particular urban area (Lewis & Salem, 1988). Criminal occurrences and incivilities may reflect the inability of the control by the authorities; this is turn, may result in the loss of trust in police’s effectiveness in guaranteeing an environment of security and social order and could lead to non-reporting of a high number of criminal offences (Lourenço, 2010). Despite marked differences in policing practices in urban space (e.g., Tulumello, 2018), Scheider et al. (2003) studied the impact of citizens perceptions on community policing on fear of crime, comparing twelve North American cities, and found that perception of local crime, victimisation, and social disorder predicted both fear of crime and satisfaction with police. Moreover, satisfaction with police also predicted fear of crime. Hence, in a period that is required that police and policing be redefined, reinvented, and redirected (International Centre for the Prevention of Crime, 2020), it is relevant to understand population’s point of view about their intervention, as well as impact on perceptions of (in)security. Regarding community variables, empirical evidence revealed that the level of satisfaction and identification with the neighbourhood influenced perception of security (Carro et al., 2010). Concurrently, according to Curiel and Bishop (2016), familiarity with the region also reduced perception of insecurity, suggesting that the smaller the area, the more security is perceived. Furthermore, the willingness to collaborate in security issues seems to be an important factor of perception of (in)security. Neighbourhoods in which inhabitants had the perception that their peers are more likely to be willing to assist each other towards antisocial conducts presented lower concern about insecurity. However, the same did not happen when an individual recognising himself to be more responsive to problems than his/her neighbours (Covington & Taylor, 1991). Recently, Reid et al. (2020) developed a model of perception of insecurity in the context of crime, based on a sample of 272 participants from eleven European countries (i.e., Romania, Serbia, Spain, United Kingdom, Austria, France, Bulgaria, Germany, Italy, Malta, and Norway), and found seven distinct factors, namely signs of social and physical disorder, trait anxiety, collective efficacy, perceived risk of victimisation, fear of personal harm, fear of property theft, and trust in police. Moreover, authors found that people who perceived crime in neighbourhood as high tended to present high values in signs of social and physical disorder, perceived risk of victimisation, fear of personal harm, fear of property theft, and, oppositely, low values in trust in police and collective efficacy. Current Study Most studies about perceptions of (in)security are concentrated in very specific geographic locations, such as USA (e.g., Collins & Guidry, 2018; Porter et al., 2012) and Latin America (e.g., Singer et al., 2018), especially from countries not properly well-ranked in the Global Peace Index (Institute for Economics & Peace, 2019). Oppositely, in countries such as Portugal, which in recent years consistently remained on the top five of the safest places in the world, research is scarce. Notwithstanding, according to the European Social Survey, Portuguese seemed to be particularly worried about violent crime when compared to most of their counterparts, and this worry affected quality of life (European Comission, 2013). Additionally, most studies about the topic focused on macro-level sites (e.g., countries or big cities) or very narrow sites (e.g., neighbourhood, university campus, green parks), instead of micro- and diverse-level sites, that included spaces where people live, study, work, attend public and private services, and spend leisure time. Most studies relied on a single indicator of perception of (in)security and did not analyse it as a multi-level phenomenon (Porter et al., 2012). In order to contribute to the knowledge in this field, this exploratory study was designed to perform a diagnosis of local security at the Historic Centre of Porto (HCP) and addresses the following research questions: Do you feel safe at HCP? Do you think that crime is increasing? What are the most and less frequent crimes? And the most feared crimes? What conditions promote criminal occurrences? What incivilities occur at HCP? What measures can be taken to increase security? What variables are related to the perception of insecurity? Study Area: The Historic Centre of Porto The Historic Centre of Porto (HCP) is an urban area located in the north of Portugal, belonging to the downtown area of Porto – the second largest Portuguese city. Currently, it includes the former parishes of Cedofeita, Santo Ildefonso, Sé, Miragaia, São Nicolau, and Vitória, covering an extension of 5.43 km2. Based on the last National Census 2011 (Portugal Statistics, 2020), 40,400 inhabitants lived in the HCP and the population density is 7447.5/km2. However, nowadays HCP is strongly attended by tourists because, in 1996, it was classified by UNESCO as World Heritage and recently (i.e., 2012, 2014, and 2017) Porto was awarded as the Best European Destination. Briefly, HCP is not only a residential zone, but also a very overcrowded area attended by workers, students, and tourists, throughout day and night. In comparison to the national background, according to the latest National Census HCP presents a greater percentage of population aged 65 or above, and a significant proportion of them live alone, although middle-aged population prevail. Moreover, a high percentage of buildings require urgent repairs and interventions, although in recent years urban requalification efforts have been made, replacing permanent residents in offices, tourist accommodation, and businesses, especially related to tourism and to tertiary activity. In sum, these sociodemographic indicators suggest that the HCP meets various potential vulnerabilities and risk factors for insecurity and criminality. Table 1 Participants Description (N = 554) 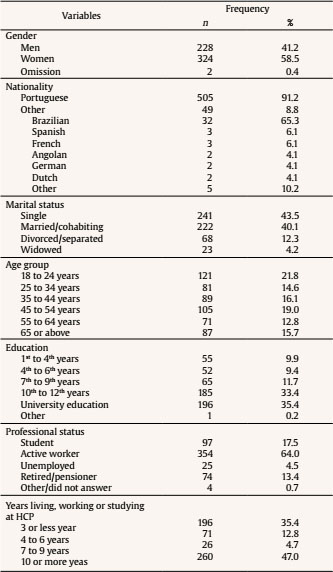 Concerning official crime data provided by the Internal Security System (ISS, 2020), both crimes against people and against property slightly increased in Portugal in 2019. Porto’s district, where HCP is located, was the second with the highest number of police reports, including serious and violent criminality. Notwithstanding, since 2009 the number of reported incidents decreased from 70,717 to 57,879 for general criminality and from 3,860 to 2,256 for serious and violent crime. The most prevalent crimes were theft in motor vehicle, domestic violence between intimates, and offense to simple voluntary physical integrity. Robbery of people in public roads (except stretching) and stretching robbery were also frequent. From the 18 municipalities that make up Porto’s district, Porto represented more than a quarter of all reported incidents. Participants Residents, workers and students at the HCP were recruited as participants in this study. Two inclusion criteria were defined, namely age equal or above 18 years and fluently speaking Portuguese. Data were obtained from 554 participants and none was removed. As shown in Table 1, 58.5% were women. Age ranged from 18 to 96 years, with a mean age of 43.82 (SD = 18.38). Regarding nationality, more than nine in ten participants were Portuguese, while in other nationalities prevailed Brazilian. Most participants were single or married/in cohabitation. Concerning education, participants are quite well distributed by basic education, secondary education, and higher education. Lastly, 64.0% were active workers and 17.5% were students; only 4.5% were unemployed. The majority of the participants (51.7%) had been living and working and/or studying at HCP for seven or more years. Measure Variables were assessed through the Diagnosis of Local Security Questionnaire (Sani & Nunes, 2013), a measure that included both closed- and open-ended questions, allowing for both quantitative and qualitative coding. Briefly, the questionnaire comprises 61 questions organized into five sections: i) sociodemographic information, ii) perception of (in)security, iii) victimisation, iv) social control, and v) community participation. The sociodemographic section includes questions about gender, age, nationality, marital status, education, parish, type of residence, occupational status, and condition of living (alone vs. with other people). In the perception of (in)security section participants were asked if they felt safe in HCP (yes; no; did not know/answer response options) and they were further requested to explain their answers. Participants were also asked if they thought that criminality had been increasing (“perception about the trend of increased crime”) and to provide explanatory reasons. Then, upon a list of fourteen crimes (e.g., fraud, robbery, sexual offense, domestic violence), participants were asked to select those crimes that they thought as frequent (“perception of occurrence”) and those they most feared (most feared crimes). Next, participants were asked to choose from a list of twelve conditions those that promoted crime occurrences (e.g., poverty/unemployment, poor lighting) and to identify the most common incivilities from a list of seven options (e.g., urinating on public roads, produce noise). In the third section, participants were asked, separately, if themselves or someone they knew were victim of crime in the preceding five years in a dichotomous question (“yes” vs. “no” responses), which allows identifying direct and indirect victims; when they answered positively, further details were requested (e.g., time, relationship with the offender), although these questions were not analysed here. The social control section included four questions, namely one about “adequacy of policing” (using a four-point Likert scale ranging from never to always), a second question about satisfaction with policing (using a four-point Likert scale ranging from not satisfied to very satisfied), and lastly two questions about seeking for both formal and informal support (using a four-point Likert scale ranging from never to always). The last section – community participation – comprises the number of years a participant attended the HCP (providing four response options: three or less years, between 4 and 6 years, between 7 and 9 years, and 10 years or more), blank spaces for proposed measures to improve quality of life and security, one question about willingness to collaborate in security measures (using a four-point Likert scale ranging from never to always) and one question about the strength of attachment to HCP (in a four-point Likert scale ranging from weak to very strong). The questionnaire was developed and validated among the Portuguese population (Sani & Nunes, 2013) and has been widely used, even with other populations (Sani & Nunes, 2016; Sani & Nunes, 2017). Procedure After the approval of the internal review board, authorization for data collection was obtained from the Parish Council of HCP. Next, participants were invited to collaborate in a study about perceptions of (in)security and crime at HCP, being recruited in streets, squares, shops, offices, schools, green parks, and other public and private spaces at HCP. Study procedures and conditions of participation were presented and written informed consent was obtained from all individuals who agreed to participate. Data was collected through face-to-face interviews applied by trained interviewers (N = 10). Interviewers were individuals with a Psychology or Criminology graduate or post-graduate degree who received a formal training session with role-play exercises before moving to the streets; then, they observed a senior interviewer to perform a couple of interviews and their first interviews were also accompanied by a senior interviewer. Participants did not receive any incentive to be enrolled in the study and they were assured of the voluntary nature of their participation, their right to refuse to answer, and the privacy of their responses. Statistical Analyses According to our aims, being an exploratory study, univariate descriptive statistics (i.e., relative and absolute frequencies, means, and standard-deviations) were computed for variables assessed in (in)security perception’s section. Moreover, inferential statistics were also computed, namely chi-squares (to test associations between variables) and independent t-tests (to compare groups) between the question “Do you feel safe at HCP?” and variables assessed in other sections. Qualitative data (e.g., explanatory reasons) were at a first stage coded through thematic analysis, by the research team (at least two members to reach a consensus), and secondly they were further analyzed quantitatively. Data were analyzed through the software IBM Statistical Package for Social Sciences (IBM SPSS for Windows, version 25.0, IBM Corp, Armonk, NY, USA). Do You Feel Safe at HCP? Overall, the majority of participants (76.9%, n = 426) answered they felt safe at HCP, while one in five (21.1%, n = 117) reported feelings of insecurity. Lastly, 2.0% (n = 11) did not know or not answer the question. To explain their answers, the most frequent reason associated to insecurity was the presence of crime/danger (9.4%, n = 52) and predominantly during night-time (4.0%, n = 22). Moreover, they reported insecurity by experience/observation (3.6%, n = 20), due to scarcity/limited policing (2.3%, n = 13), due to alcohol and drug traffic/consumption (0.9%, n = 5), and due to lack of residents/neighbours (0.5%, n = 3). Participants reporting security explained it due to experience/observation (57.2% n = 317) and formal social control (7.9%, n = 44). Other reasons pointed out by participants were security limited to residents/known people (3.8%, n = 21), by comparison to other areas (3.8%, n = 21), and due to informal social control (0.9%, n = 5). Do You Think that Crime is Increasing? Nearly 40% considered that crime is increasing (39.4%, n = 218), especially by the presence of strangers (13.6%, n = 60), due to the presence of problems/conflicts (8.6%, n = 38), by mediatization (8.6%, n = 38), by economic problems/unemployment (5.2%, n = 23), due to the occurrence of thefts/assaults (4.8%, n = 21), by experience/observation (3.6%, n = 16), by ineffectiveness in police responses (2.3%, n = 10), and due to aggravation/increase in drug trafficking and consumption (0.9%, n = 4). The remaining 46.4% (n = 257), perceiving that crime was not increasing, explained their answers based on experience/observation (45.9%, n = 203), due to formal social control (3.4%), by mediatization (2.7%, n = 12), due to informal social control (0.2%, n = 1), and because crime is limited to alcohol/drugs consumption and traffic (0.2%, n = 1). It should be mentioned that 14.3% (n = 79) did not know or provide an answer on the perception about the increased trend of crime. What Are the most and less Frequent Crimes? And the most Feared Crimes? As shown in Table 2, robbery, theft, and drugs traffic were perceived as the most common crimes at HCP, while arms traffic and domestic violence against children and elderly were perceived as less frequent. The number of reported crimes ranged from 0 to 14 (M = 4.06, SD = 2.26). Participants were especially fearful about robbery and theft and less fearful about all types of domestic violence. Moreover, one in six participants perceived sexual offense as an occurred crime, while one in four feared it. Participants feared, in average, 3.60 crimes (SD = 3.03, range = 0-14). Table 2 Frequencies of Most Feared Crimes and Perception of Occurrence, by Type of Crime 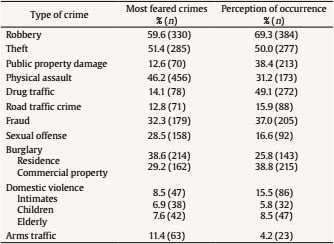 What Conditions Promote Criminal Occurrences? The majority of participants considered that the consumption of legal (e.g., alcohol) and illegal drugs (79.2%, n = 439), poverty and/or unemployment (72.4%, n = 401), and deficient policing (56.3%, n = 312) promoted criminal occurrences. Juvenile delinquency/problems (46.9%, n = 260), family problems (43.7%, n = 242), inability of police action (41.9%, n = 232), and spaces poor attended during night (40.3%, n = 223) were also perceived as crime promoters. About one third believed that low severity with offenders (38.6%, n = 214), presence of strangers (33.8%, n = 187), and poor public lighting (32.7%, n = 181) encouraged criminal behavior. Poor accesses (27.4%, n = 152) and the absence of leisure/green spaces (17.9%, n = 99) were the least presented conditions. The number of the presented conditions ranged from 0 to 12 (M = 5.31, SD = 2.98). What Incivilities Occur at HCP? Participants answered that urinating on public roads (72.0%, n = 399), animal feces on the street (68.4%, n = 379), chaotic car parking (68.1%, n = 377), waste scattered on the street (65.2%, n = 361), and noise produced (61.6%, n =341) were the most common incivilities. Moreover, the majority presented violating traffic rules (54.9%, n = 304) and illegal begging (52.2%, n = 289) were also frequent. Participants reported a mean number of 4.42 incivilities (SD = 1.85), ranging from 0 to 7. What Measures Can Be Taken to Increase Security? Three-quarters of the participants considered that more policing, security, video surveillance, and more effective justice was needed (75.3%, n = 417). The second most presented measure was increasing in lighting (11.6%, n = 64). Other measures were suggested by less than 5% of the participants, namely more services/formal social support (2.2%, n = 12), education/civics (2.0%, n = 11), more residents/tourists (1.4%, n = 8), criminal prevention/drug/better social policies (1.3%, n = 7), more leisure/green spaces (1.1%, n = 6), urban rehabilitation/greater quantity or quality of equipment (1.1%, n = 6), less prostitution/illegal-begging/homeless (0.9%, n = 5), less noise and environmental pollution (0.5%, n = 3), more trade/infrastructures and services (0.5%, n = 3), more jobs (0.4%, n =2), more road education/less traffic (0.4%, n = 2), and more transport (0.2%, n = 1). The number of suggested measures varied between 0 and 3 (M = 0.99, SD = 0.57). Table 3 Frequency and Chi-Square Tests for Perception of Security by Sociodemographic Variables 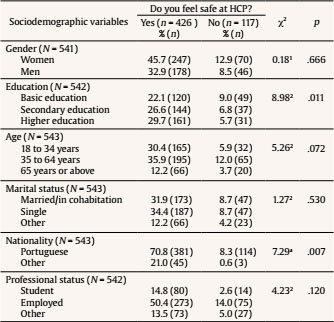 Note. 1df = 1; 2df = 2. What Variables Are Related to the Perception of Insecurity? As can be seen in Table 3, regarding sociodemographic variables, those less educated, Portuguese and residents presented a high perception of insecurity. Concerning criminal and environmental variables, all variables except indirect victimization, were related to the perception of insecurity. Those that perceived that the trend of crime was increasing and were direct victims reported feeling more unsafe. Moreover, those who felt unsafe reported a high number of criminal occurrences, most feared crimes, conditions promoting crimes, and incivilities; they also suggested more measures to increase security (Table 4). As shown in Table 5, adequacy and satisfaction with policing were the social control variables related to the perception of insecurity, suggesting that those that presented negative perceptions were more unsafe. Lastly, on community variables, those who had lived/worked or studied longer at HCP presented a high perception of insecurity. All other variables (Tables 3, 4, and 5) did not achieve statistical significance (p > .05). Table 4 Frequency and Chi-Square Tests and Difference Tests for Perception of Security by Criminal and Environmental Variables 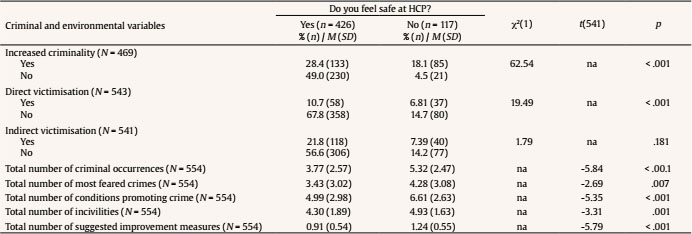 Note. na = not applicable. This study presents a diagnosis of local security performed at Historic Center of Porto which revealed that most people rated it as a safe place, although more than one third considered that crime was increasing. Generally, there was a match between crimes that people feared the most and those that perceived as most common at HCP. Participants presented several reasons that promote criminal behaviors and depicted HCP as a place of incivilities. The perception of (in)security was affected by some demographic, criminal, environmental, social control, and community variables, but not for other. Overall, these results suggested that HCP presented some similarities with other national and international sites, but also some idiosyncrasies and both deserve a comment. Being a central topic in urban environments, insecurity remained as a central concern across the world (Collins & Guidry, 2018; Lourenço, 2010). Portugal is not an exception and, according to our findings, around 20% of the participants reported feeling unsafe at HCP. Our result is in line with other authors, who also found that most individuals felt safe (Turunen et al., 2010; Valente et al., 2019), although being slightly higher than data from Portuguese people in the European Social Survey (2019). This trend may be explained by the fact that most studies – similar to ours – focused on urban areas, while the European Social Survey included both urban and rural spaces. The presence of crime and danger was the main reason pointed out by participants who felt unsafe, which favours the idea of the city as an attractive place for criminal and violent occurrences (United Nations Humans Settlements Programme, 2007). More than one third of our participants believed that crime was increasing at HCP, which seems to contradict data from ISS (2020), that depicted a trend of crime decreasing in Porto district; however, we should be cautious about this comparison because so far we have no official data specific to HCP. Table 5 Frequency and Chi-Square Tests for Perception of Security by Social Control and Community Variables 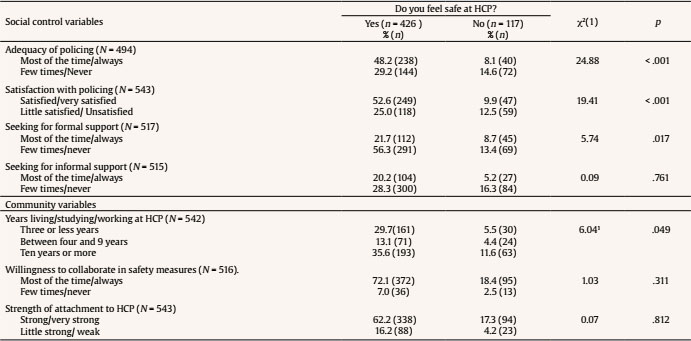 Note. 1df = 2. According to official crime data, theft in motor vehicle, domestic violence between intimates, and offense to simple voluntary physical integrity were the most common crimes, figures about robbery of people in public roads being also relevant (except stretching), and stretching robbery were also frequent. When asked about criminal occurrences more common at HCP, our participants partially confirmed these conclusions. For instance, robbery and theft were also perceived as common, while domestic violence was the most unusual crime. This similarities and differences may be related to the nature of the crimes: while robbery and thefts seems to be “public crimes” for instance occurring at public space or shared through informal conversations, domestic violence is traditionally a hidden and private crime that occurred inside home and within families. It should also be stressed that crimes that people feared the most match those perceived as most common, namely robbery and theft, being also among the crimes that British people worried the most (Allen, 2006). Still concerning most feared crimes, similar to findings by Wilcox et al. (2007) and Cook and Fox (2011), robbery, theft, and physical assault were also stressed by our participants. Based on our findings, incivilities are quite frequent at HCP, especially urinating on public roads, animal feces on the street, litter and noise, which is in line with results found by other researchers (e.g., Ladenburg et al., 2016; Valente & Pertegas, 2018). These incivilities seem to comprise minor violations of community norms, which may impact individual and community well-being and quality of life (LaGrange et al., 1992). Factors that promote crime, identified by participants, seems to be an understudied variable, despite being crucial according to DLS guidelines and practices (GDIA, 2009). Our results suggest that consumption of legal and illegal drugs, poverty and/or unemployment, and deficient policing were the main reasons presented. Indeed, the increase in consumption of illegal drugs seems to be a current issue affecting HPC, that has been noticed not only by media and political actors (e.g., Jornal de Notícias, 2019), but also by the scientific community (Nunes & Sani, 2014). In the same line, according to the latest census (Portugal Statistics, 2020), unemployment seems to be a major problem that is also perceived by our participants. Lastly, deficient policing may be explained not only by structural changes (e.g., some police stations were closed and resources were relocated at central stations), but also to changes in traditional strategies of policing (e.g., car patrols instead of foot patrols). Indeed, when asked about measures to improve security, suggestions that were presented more frequently were policing, security, video surveillance, and more effective justice, which may be perceived as an individual and community interest to be enrolled in partnerships for improving security, as proposed by the Diagnosis of Local Security guidelines (GDIA, 2009). Our findings concerning improvements in lighting are consistent with Lindgren and Nilsen’s (2012), suggesting that insecurity may be particularly relevant at night and in spaces with low visibility. Besides information regarding perceptions of (in)security, we were also interested to understand which variables may be related to the feeling of unsafety; therefore, we analyzed sociodemographic, criminal, environmental, social control, and community variables. Despite the fact that age and gender seem to be particularly distinguishable variables (e.g., Kullberg et al., 2009; Valera-Pertegas & Guàrdia-Olmos, 2017), we found no significant associations with perception of (in)security. This different pattern may be explained by the fact we include a broad definition of security and comprehensive set of crimes, including both property and against person’s occurrences. Additionally, although not being assessed, and according to the situational opportunity theories of crime (Wilcox & Cullen, 2018), we could especulate that women and elderly adopted routines to prevent insecurity and victimisation experiences, while men and younger participants did not. Concerning nationality, we found that Portuguese feel less safe than non-Portuguese, that confirms previous findings by Carro et al. (2010) and Allik and Kearns (2017). We should stressed that our immigrant participants were mainly Brazilian, who tended to compare security at HCP to those areas they attended in Brazil, which, according to the Global Peace Index, occupies the 116th rank (Institute for Economics and Peace, 2019). Similar to Visser et al. (2013), our findings suggests that people who were less educated presented a high perception of insecurity, which may represent a sense of vulnerability that should be further addressed. Concerning to criminal and environmental variables, all but indirect victimisation were related to the perception of (in)security. Overall, these results stressed the relevance of criminal and environmental variables to the perception of (in)security, as suggested by the model proposed by Reid et al. (2020). It is reasonable to expect that those who perceived crime as increasing reported the highest perception of insecurity, despite the first perception contradicts official crime data (Portugal Statistics, 2020). Nonetheless, as claimed by others (e.g., Cardoso et al., 2019), not always subjective and objective features of insecurity match. Those who had been direct victims and presented most feared crimes tended to report more insecurity, being in accordance with findings by Kullberg et al. (2009), Turunen et al. (2010), and Visser et al. (2013). A similar trend applies to incivilities: a high number of incivilities were presented by those participants that felt unsafe. As previously mentioned, the presence of incivilities signals deterioration of physical spaces and, as consequence, the public image of a particular urban area worsen (Lewis & Salem, 1988). Once again, an overall sense of vulnerability may contribute to these associations, further exploring these issues being crucial. According to our findings, perception of (in)security was related to adequacy and satisfaction with policing; this substantiates previous findings in the literature (e.g., Scheider et al., 2003). According to a study by Kaariainen (2007), comparing trust in police in 16 European countries, Portugal presented the fourth worst rank, being just surpassed by Slovenia, Poland, and Czech Republic. This may be seen as a demand for more community policing practices (Nunes et al., 2020) and the benefits of involving police as a stakeholder when performing a diagnosis of local security (GDIA, 2009). Lastly, community variables also deserve a comment: in contrast to Carro et al. (2010) and Curiel and Bishop (2016), willingness to collaborate in security measures and strength of attachment were not associated with perception of (in)security. However, participants who had lived or worked/studied longer at HCP presented a higher perception of insecurity. These findings may be related to a traditional perspective, that believes that security and safety issues are civil rights that should be guaranteed by government and security forces, especially police. Concomitantly, recent changes at HCP (e.g., increased number of tourists in recent years, decreased number of permanent residents) may booster perception of insecurity among those who attended longer the HCP. Our results are informative for the development of proper measures and programs to improve perception of security. Creating a perception of security needs to reflect local circumstances and to build on knowledge and experiences of people who live, work, and study there, requesting both physical and social measures. Improvements in policing were the measure most suggested by our participants, and it can be associated to both physical and social dimensions. For instance, through the use of video surveillance and reinforcement of the number of patrols we are introducing physical measures, while the adoption of community policing can be understood as a social measure. Indeed, there is a clear need to generate policing strategies aimed at prevention, addressing population’s involvement in security issues in an area in which feelings of belonging and co-responsibility are developing. Concomitantly, informal social control measures can be applied; for instance, in Sweden, Neighbourhood Watch programs were implemented with promising results (Kullberg et al., 2009). As proposed by crime prevention through environmental design principles (e.g., Cozens & Love, 2015) that are generally not applied in Portugal (Saraiva et al., 2020), physical and environmental measures can be implemented, such as improvements in lighting, urban rehabilitation, and greater quantity/quality of equipment. Lastly, social measures to intervene in legal and illegal drug consumption/traffic should be developed at primary, secondary, and tertiary levels. Several potential limitations and future work should be considered. One methodological limitation is the cross-sectional design, which does not allow causal inferences. We assessed perceptions of insecurity using a nominal variable (i.e., yes vs. no vs. did not know/answer) in order to have a straight perspective of a participant’s perception and to analyze in combination with perception about the trend of increased crime. Notwithstanding, other works applied Likert scales and these different approaches make comparisons across studies difficult. Additionally, participants were asked about perceptions of insecurity in a static manner, preventing an analysis of its evolution throughout time. Therefore, to further our research, longitudinal studies should be performed. A number of potential variables involved in perception of (in)security was not included in this study, such as area reputation, income, objective space, and social characteristics (e.g., lighting, crime rate, unemployment rate). Some of these variables are included in the ongoing research project, so they should be analyzed in future papers. Moreover, we applied a general and comprehensive question to assess perception of (in)security – i.e., “How safe do you feel at HCP?”, which did not constraint the period of the day (i.e., at night). Despite the fact that this option provides a broad perspective, it compromises comparisons with traditional studies that applied a different approach. Lastly, despite the fact that data collection occurred in private (e.g., shops, laundries) and public (e.g., streets, parks) spaces, we cannot interview old inhabitants aging in place without contact with those spaces. Being a contemporary universal need (Tay & Diener, 2011), security seems to impact across fields – community and individual behavior, economy, health, education, quality of life, etc. – that may in turn deeply impact political discourses and practices (International Centre for the Prevention of Crime, 2016; United Nations Humans Settlements Programme, 2007). The diagnosis of local security provides a comprehensive and detailed picture of the phenomena of insecurity and crime within the community. Moreover, it allows identifying the dimension and nature of crime and insecurity, promoting participation from local actors and proposing recommendations and suggestions for intervention. This study was a contribution to this field of research and practice, aiming to encourage similar efforts. Conflict of Interest The authors of this article declare no conflict of interest. Cite this article as: Azevedo, V., Sani, A., Nunes, L. M., & Paulo, D. (2020). Do you feel safe in the urban space? Do you feel safe in the urban space? From perceptions to associated variables. Anuario de Psicología Jurídica, 31, 75-84. https://doi.org/10.5093/apj2021a12 Funding. This study is part of the Research Project “LookCrim: Looking at crime: Communities and physical spaces”, that was supported by Fundação para a Ciência e a Tecnologia I. P. (FCT) under the grant PTDC/DIR-DCP/28120/2017. The funding source had no involvement in study design, data collection, analysis, and interpretation and the decision to submit the article for publication. References |
Cite this article as: Azevedo, V., Sani, A., Nunes, L. M., and Paulo, D. (2021). Do you Feel Safe in the Urban Space? From Perceptions to Associated Variables. Anuario de Psicolog├şa Jur├şdica, 31(1), 75 - 84. https://doi.org/10.5093/apj2021a12
vazevedo@ufp.edu.pt Correspondence: vazevedo@ufp.edu.pt (V. Azevedo).Copyright © 2026. Colegio Oficial de la Psicología de Madrid


Herramientas:
 PDF
PDF e-PUB
e-PUB CrossRef
 JATS
JATS Imprimir
 Enviar
ALERTA POR E-MAIL
La Revista de Anuario de Psicología Jurídica está distribuida bajo una licencia de Creative Commons Reconocimiento-NoComercial-SinObra Derivada 4.0 Internacional.com