
Smartphone Addiction and Social Support: A Three-year Longitudinal Study
[Adicci├│n a los tel├ęfonos inteligentes y apoyo social: un estudio longitudinal durante tres a├▒os]
Juan Herrero1, Andrea Torres1, Pep Vivas2, and Alberto Urue├▒a3
1Universidad de Oviedo, Spain; 2Universitat Oberta de Catalunya, Spain; 3Universidad Polit├ęcnica de Madrid, Spain
https://doi.org/10.5093/pi2019a6
Received 17 December 2018, Accepted 12 February 2019
Abstract
For some years now, scholars have been exploring some of the negative consequences for the psychosocial well-being of users that the rapid incorporation of smartphones into our lives has caused. Most of the empirical studies to date are cross-sectional and are carried out with participants from convenience samples, which has been a limitation in this field. In this study, we evaluated the evolution over three years of smartphone addiction and social support in 241 Spanish users of a representative national sample. The results of the analysis of latent growth and growth mixture modeling indicate that both trajectories are interconnected: the more addiction decreases, the more social support increases. In addition, high levels of addiction and relatively low levels of support remained stable over time in a group of users. Users of this high-addiction group would represent a trend in the digital society characterized by higher rates of loneliness and technological dependence.
Resumen
Desde hace algunos años los estudiosos han venido explorando algunas de las consecuencias negativas que la rápida incorporación de los teléfonos inteligentes en nuestra vida ha tenido en el bienestar psicosocial de los usuarios. La mayoría de los estudios empíricos hasta la fecha son de corte transversal y se realizan con participantes de muestras de conveniencia, lo que ha sido una limitación en este campo. En este estudio evaluamos la evolución durante tres años de la adicción a teléfonos inteligentes y el apoyo social en 241 usuarios españoles de una muestra nacional representativa. Los resultados del análisis del modelado del crecimiento y modelado de la mezcla de crecimiento indican que ambas trayectorias están interconectadas: a medida que aumenta la adicción aumenta el apoyo social. Además, los altos niveles de adicción y los niveles relativamente bajos de apoyo se mantuvieron estables en el tiempo en un grupo de usuarios. Los usuarios de este grupo de elevada adicción representarían una tendencia en la sociedad digital caracterizada por mayores índices de soledad y dependencia tecnológica.
Keywords
Longitudinal studies, Adult population, Empirical research, Social support, Smartphone addiction, Psychosocial well-being, Growth modeling.Palabras clave
Estudios longitudinales, Poblaci├│n adulta, Investigaci├│n emp├şrica, Apoyo social, Adicci├│n a los tel├ęfonos inteligentes, Bienestar psicosocial, Modelado del crecimiento.Cite this article as: Herrero, J. , Torres, A. , Vivas, P. , & Urue├▒a, A. (2019). Smartphone Addiction and Social Support: A Three-year Longitudinal Study. Psychosocial Intervention, 28, 111 - 118. https://doi.org/10.5093/pi2019a6
Correspondence: alberto.uruena@upm.es (A. Urue├▒a).For approximately fifty years, scholars have empirically confirmed the benefits of social support for health and well-being. This empirical evidence comes from cross-sectional and longitudinal studies carried out both in the general and at-risk populations (Holt-Lunstad, Smith, & Layton, 2010; Taylor, 2011; Uchino, 2009; Uchino, Cacioppo, & Kiecolt-Glaser, 1996). It is a fact among current scholars that social support is a key element in people’s psychosocial well-being. For this reason, it is common to monitor levels of social support in processes as diverse as oncological treatments, victims of natural disasters, refugees, and displaced persons, or people in mourning, to mention but a few (Hogan, Linden, & Najarian, 2002; Roehrle, & Strouse, 2008; Tol et al., 2011). In the last two decades, social scientists have been analyzing how changes in social communication technologies affect the creation and maintenance of social support ties for users (Kraut et al., 1998). These studies initially focused on communication technologies such as accessing the Internet through residential equipment – desktop computers and telephone and cable connections ( Herrero, Meneses, Valiente, & Rodríguez, 2004; Kraut et al., 2002). Most recent studies have analyzed the use of mobile phones and smartphones (Herrero, Urueña, Torres, & Hidalgo, 2017a). The mobile revolution has changed our daily experiences, including the way we work (Urueña, Arenas, & Hidalgo, 2018). Smartphones are a modern synthesis of desktop computers and mobile phones: they are small – and relatively powerful – computers focused on social interaction – whether by text, voice, or video. Their use has grown steadily in the population. Indeed, smartphone adoption will grow by 20 percentage points globally between 2017 and 2025; by then, three out of four mobile connections would operate on smartphones. In many countries, smartphones represent more than 75% of the percentage of total mobile connections (GSM Association, 2018). The versatility of smartphones for communication has the potential to promote an increasingly extensive use in our daily lives and scholars are beginning to warn about its associated potential negative consequences. Researchers differentiate between the use of smartphones and their extensive use and, eventually, their addiction. While the first one suggests an adaptation of the device to the social life of a person, the other two reflect behaviors with potential negative effects on the psychosocial adjustment of users. The problematic use does not necessarily imply addictive behavior, although it poses a risk to users (Elhai, Dvorak, Levine, & Hall, 2017; Elhai et al., 2018; Panova & Carbonel, 2018). In fact, although related, these terms present both convergent and divergent points. Although sometimes the problematic use of smartphones can be linked to addiction (craving, for example), there are other types of problematic uses that would not necessarily imply addiction (reckless driving when sending text messages, for example) (Billieux, Maurage, Lopez-Fernandez, Kuss, & Griffiths, 2015; Billieux, Philippot et al., 2015). In the present study, we analyze the smartphone addiction and its relation to users’ social support. The studies on smartphone addiction represent a continuation of the first studies on addiction to the Internet and to mobile phones and share some of their premises (Herrero et al., 2017a; Herrero, Urueña, Torres, & Hidalgo 2019). For example, these studies share the idea that communication technologies can lead to social isolation, which has negative consequences for well-being. They also share the idea that smartphone addiction have the same negative consequences stemming from behavioral addictions (such as gambling, for example), like poor psychological adjustment, problems at work, or an increase in conflicts with family and friends. The study of smartphone addiction has also brought some novelties like its effects on potential increases of security vulnerabilities and potential exposure to future cyber victimizations (for instance, phishing) (see Herrero et al., 2017a for an analysis). The empirical evidence on the relationship between users’ smartphone addiction and psychosocial well-being is still incipient. As indicated a few years ago by the World Health Organization - WHO (2015), most of the available evidence comes from cross-sectional studies. In addition, much of this research uses convenient samples of university students. Both circumstances considerably limit the validity and generalizability of research findings. Smartphone Addiction and Social Support Smartphone Addiction as a Consequence of Low Social Support A large part of the studies analyzes the addition to smartphones as a result of trying to maintain or increase the levels of social support through the use of information technologies. This is the main area of research in this field: the need to generate support ties in the user leads to an increasingly extensive use of terminals, which, in the end, can lead to a behavioral addiction (Billieux, Maurage et al., 2015; Billieux, Philippot et al., 2015). In fact, among people with high levels of loneliness and low social support it seems that non-face-to-face communication is the preferred way to try to increase support levels (Kim, 2017). Moreover, users who most frequently use social networks on their smartphone tend to develop addictive habits faster (Jeong, Kim, Yum, & Hwang, 2016). Numerous cross-sectional investigations have identified that users with lower levels of social support show also higher levels of smartphone addiction (Aker, Sahin, Sezgin, & Ouz, 2017; Billieux, Philippot et al., 2015; Ihm, 2018; Kim, 2017, 2018; Kwon, So, Han, & Oh, 2016; Lu et al., 2011). Longitudinal studies in this field are less frequent. Of particular relevance is the study by Tossell, Kortum, Shepard, Rahmati, and Zhong (2015). In their research, these authors provided smartphones to a group of users and monitored their use for a year. The most relevant finding of the study was that users with higher levels of addiction made a more intermittent use of communication apps (i.e., Facebook, text messages). For these authors, addicted users presented a need for constant access to information about their social relationships that in the end could be difficult to control over time and might lead to a behavioral addiction. In other words, the need to obtain social support in these users increased their potential risk of smartphone addiction (see Billieux, Maurage et al., 2015; Herrero et al., 2019; van Deursen, Bolle, Hegner, & Kommers, 2015). Smartphone Addiction as an Antecedent of Low Social Support The second area of research explores how this type of behavioral addiction can socially isolate users and reduce their levels of social support. Smartphones offer so many functionalities for communication that they could have the paradoxical effect of isolating users: as we can communicate with everyone and all times, in the end, we communicate poorly with everyone, which affects our ability to create and maintain support ties (Herrero et al., 2019). From this view, the addiction to smartphones in addition paradoxically erodes users’ social world, because of the extensive use of – and potential addiction to – a social communication technology. It is important to note that both perspectives make similar predictions: the levels of smartphone addiction negatively relate to levels of social support. Beyond this agreement, they recognize a different origin. While the former places emphasis on the existence of a deficit in psychosocial adjustment (i.e., low social support) prior to the development of addictive behaviors with smartphones, the latter does not. According to the second perspective, even at appropriate levels of psychosocial adjustment the development of addictive behaviors with smartphones would be possible. It was not until the first longitudinal investigations that it was possible to unravel the type of relationship between smartphone addiction and social support. Empirical research conducted using longitudinal design from this perspective (Herrero et al., 2019) has shown that addiction relates to a reduction in social support over time. Herrero et al. (2019) found in a Spanish national representative sample of 416 smartphone users that the previous levels of addiction influenced the evolution of social support. Specifically, these authors found using growth mixture modeling techniques that users with higher levels of addiction evidenced a greater reduction of social support in the following 12 months. Although their research allowed overcoming some limitations of previous studies – they used a longitudinal design and data from a national representative sample of people older than 15 years – the authors could not explore the evolution of smartphone addiction and social support over time due to the lack of temporary measurements, so it remains technically unexplored to date. Further research should deepen in these aspects in order to identify the relationships between smartphone addiction and social support of users (WHO, 2015). The Present Study The empirical findings of longitudinal research have provided initial empirical support to the idea that smartphone addiction is associated with a poor psychosocial well-being of users (i.e., low social support). It is important to note that this empirical evidence improves our understanding of the first results obtained in cross-sectional studies, which, despite their limitations, provided insight into the relationship between users’ smartphone addiction and psychosocial well-being. To date, longitudinal research has partially analyzed these influences, but it is necessary to incorporate the simultaneous analysis of the two processes in the same longitudinal design to understand the relationship between smartphone addiction and the psychosocial well-being of users. This is a methodological challenge since it requires the follow-up of users over time in the variables of interest as well as the use of techniques of analysis to capture the covariation of trajectories. The present study aims to address some of these challenges using panel data from 241 smartphone users from a representative Spanish national sample. The general objective that guides the present research is the study of the relationships between social support and smartphone addiction over time. According to the empirical evidence available, mostly from cross-sectional studies, our working hypothesis about the evolution of these processes is that a decrease in smartphone addiction will be associated to an increase in social support. To empirically test for this assumption, social support and smartphone addiction of users were followed-up for three years. We also included sociodemographic variables in our study since previous research has shown that levels of smartphone addiction and social support vary across age, gender, educational attainment, and size of locality (Herrero et al., 2019). Participants We used six waves of data from the Cybersecurity and Confidence in Spanish Households national survey conducted by the National Observatory of Telecommunications and Information Society of the Spanish Ministry of Industry for this study (see Herrero et al., 2017a; Herrero, Urueña, Torres, & Hidalgo 2017b; Herrero et al., 2019, for a detailed description). Participants belonged to a representative sample of the Spanish population of Internet users, 15 years old and over sampled within households. Initially, 879 users completed the self-reported questionnaire at wave 1. From these 879 users, 241 users (27%) remained in the study after three years. Variables and Scales Sociodemographic variables. Sex (male 55.3%, female 44.7%), age in five age groups years –15 to 24 years (5.4%), 25 to 34 years (19.9%), 35 to 44 years (42.8%), 45 to 54 years (25.3%), and more than 55 years (6.6%) (M = 3.08, SD = 0.96) –, educational background (highest educational level attainment: 1 = elementary, 1%; 2 = secondary, 45 %; and 3 = university studies, 54%; M = 2.54, SD = 0.50), and size of locality (from 1 – less than 10,000 - to 6 – more than 500,000 inhabitants -; M = 4.05, SD = 1.75). Social support. The strong-tie support scale (Lin, Dean, & Ensel, 1981) was used to measure social support from intimate and confidant relationships with three items in a five-point scale from 1= never to 5 = most of the time. It measures to what degree respondents felt fulfilled their support needs from close companions. The three items of the strong-tie support scale is a recommended measure of social support for large-scale surveys (Herrero, Fuente, & Gracia, 2011). Averaged social support was measured in all six waves. Cronbach’s alpha was adequate for the six waves of data (as ≥ .65) in line with other research (Herrero et al., 2019). Sample statistics for each wave were as follows: T1 (M = 3.53, SD = 0.88), T2 (M = 3.56, SD = 0.92), T3 (M = 3.62, SD = 0.89), T4 (M = 3.68, SD = 0.87), T5 (M = 3.71, SD = 0.88), and T6 (M = 3.74, SD = 0.86). A first inspection, the evolution of the means of social support throughout the six waves reflects an upward trajectory. Smartphone addiction. Smartphone addiction was evaluated with the Smartphone Addiction Symptoms Scale (SAPS; Bian & Leung, 2015). The SAPS consists of 19 items in a five-point category response (1 = never to 5 = most of the time) that measures smartphone extensive use across several dimensions. For the measurement of smartphone addiction, Bian and Leung (2015) suggest using the information from eight items of the SAPS that are most conceptually equivalent to Young’s screening instrument of Internet addiction. Specifically, a global score of smartphone addiction was obtained from these eight items whose scores from 1 to 5 were first dichotomized as follows: 4 (many times) or 5 (most of the time) = 1; all remaining response categories equal to zero. Items were summed. Smartphone addiction was measured in five occasions (as ≥ .78): T1 (M = 0.97, SD = 1.64), T3 (M = 0.85, SD = 1.64), T4 (M = 0.82, SD = 1.56), T5 (M = 0.80, SD = 1.50), and T6 (M = 0.70, SD = 1.43). The evolution of smartphone addiction over the five waves reflects a downward trajectory. Analytical Strategy In this study, we analyzed the relationships between social support and smartphone addiction through the study of their trajectories over time. With this strategy, we used the full information on all measurement time points. We analyzed growth curves for social support and smartphone addiction for the estimation of trajectories. For the study of the evolution of the trajectories, we estimated their covariation. We used MPLUS 8.2 software (Muthén & Muthén, 2018) to estimate this set of relationships through growth latent modeling (GLM) techniques. In the GLM approach, the main emphasis lies in explaining variability between subjects in the parameters that describe their growth curves (Hox & Stoel, 2005). This makes it possible to analyze the covariation among different trajectories or growth patterns (whether ascending or descending), and allows the researcher to answer questions, like does a decrease in smartphone addiction relate to an increase in social support over time? Latent growth modeling techniques approach the study of variation in time by identifying two parameters that describe the growth trajectory: a factor of the initial level (intercept) and a growth factor (slope). The means of both factors correspond to the level at the beginning of the study and the ascending or descending trajectory in time respectively. A negative slope means that the variable decreases with time. A positive slope means that the variable grows over time. An average of zero in the slope means that there is no significant growth in the sample (neither an increase nor a decrease over time). The variance of the intercept indicates the variability of the measure at the beginning of the study. If the variance is zero (i.e., not significant) it indicates that all the subjects started at the same level at the beginning of the study. This rarely happens in panel studies because in such studies the initial values across participants are usually different (for example, different initial levels of social support or smartphone addiction). The slope variance indicates potentially different growth rates in the sample. A statistically significant variance of the slope suggests that not all participants in the sample grow or decrease at the same rate. A non-significant variance of the slope suggests that the estimated trajectory does not vary across participants and it is, therefore, a valid description for the entire sample (for example that all participants grow or all decline at the same rate). For the estimation of model fit we used the robust Satorra-Bentler c2 and its associated probability for n degrees of freedom, the robust comparative fit index (CFI), and the robust root mean squared error of approximation (RMSEA) and its corresponding 90% confidence interval (CI). A CFI higher than .95 along with a RMSEA lower than .05 indicated a good fit for the model. Although GLM allows identifying the evolution over time of social support and smartphone addiction, this type of analysis assumes that the growth trajectories are unique for the entire population. It is possible, however, that different subgroups of the population show different trajectories. For example, that while one group shows an ascending trajectory, another group shows a downward trajectory. Growth mixture modeling (GMM) allows exploring the existence of these subgroups among participants. To do this, we estimated different competing models with an increasing number of groups (or classes in the GMM terminology). The comparison between the models allows identifying the optimal number of classes. Technically, models are compared from various indicators, in which the literature highlights the Bayesian information criteria (BIC), the Lo-Mendell-Rubin likelihood ratio test (LRT), and the bootstrapped likelihood ratio test (BLRT). Models with smaller BICs present better fit to the data. LRT and BLRT compare neighboring models with a class difference of n = 1. When LRT and BLRT are not statistically significant (p >.05), the model with the smaller number of classes better fits the data. We also used other indicators to select the best model such as entropy (which measures the distance between classes and indicates the goodness of the classification of subjects in the classes) or the number of subjects per class. Finally, the optimal model must also fit the theory and be conceptually plausible (Bauer & Curran, 2003). Attrition Analyses Close inspection of dropouts across socio-demographic variables revealed that dropouts (M = 3.46, SD = 1.05) were older than non-dropouts (M = 3.09, SD = 0.97), F(1, 878) = 22.70, p < .001. No significant differences were found for sex, c2(1) = 0.84, ns, Cramer’s V = .01, ns; size of locality, F(1, 878) = 1.22, ns; and educational background, F(1, 878) = 2.29, ns. We also found that dropouts (M = 3.41, SD = 0.90) significantly scored lower on social support at wave 1 than non-dropouts (M = 3.53, SD = 0.88), F(1, 878) = 6.70, p = .010. Overall, dropouts and non-dropouts were mostly equivalent across sociodemographic and study variables with two exceptions: dropouts were older and self-reported lower levels of social support at the T1. Latent Growth Modeling The model fitted adequately the data (c2 = 131.12, S-B c2 = 91.45, df = 52, p < .001, robust CFI = .98, robust RMSEA = .03, 90% CI [.02, .04]). Inspection of modification indexes revealed, however, that estimation of the error covariance between smartphone addiction measures at T1 and T6 would significantly improve model fit (c2 = 108.91, S-B c2 = 75.92, df = 51, p < .001, robust CFI = .99, robust RMSEA = 0.02, 90% CI [.01, .04]) (difference in S-B c2 = 17.46, df =1, p < .001). We did not further modify the model to improve model fit. As can be seen in Table 1, initial levels of social support (at T1) were significantly and negatively associated with the initial levels of smartphone addiction (at T1) (cov. = -0.27, SE = 0.06, p < .001). Social support significantly increased in the follow-up period (b = 0.04, SE = 0.01, p < .001) an average of 0.04 units every six months. Smartphone addiction significantly decreased 0.03 units every six months (b = -0.03, SE = 0.014, p < .05) (see Figure 1). There was a significant covariation between trajectories over time (cov. = -0.01, SE = 0.0, p < .01), suggesting that increases in social support were related to decreases in smartphone addiction in the 3 years of follow-up. Table 1 Summary of Unstandardized Parameter Estimates for both Model 1 and GMM Two-class Model (N = 241) 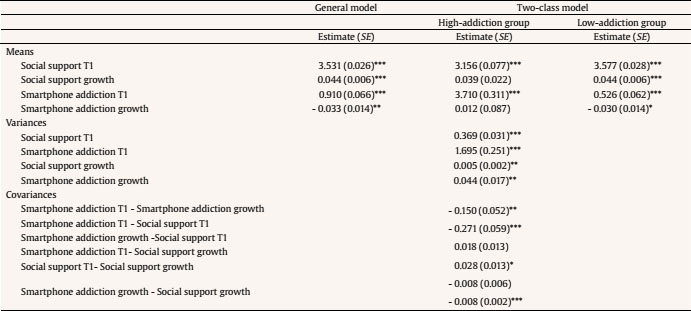 *p < .05; **p < .01; ***p < .001. Figure 1 Unstandardized Parameter Estimates of the Evolution of SmartphoneAddiction and Social Support for Three Years (Model 1). 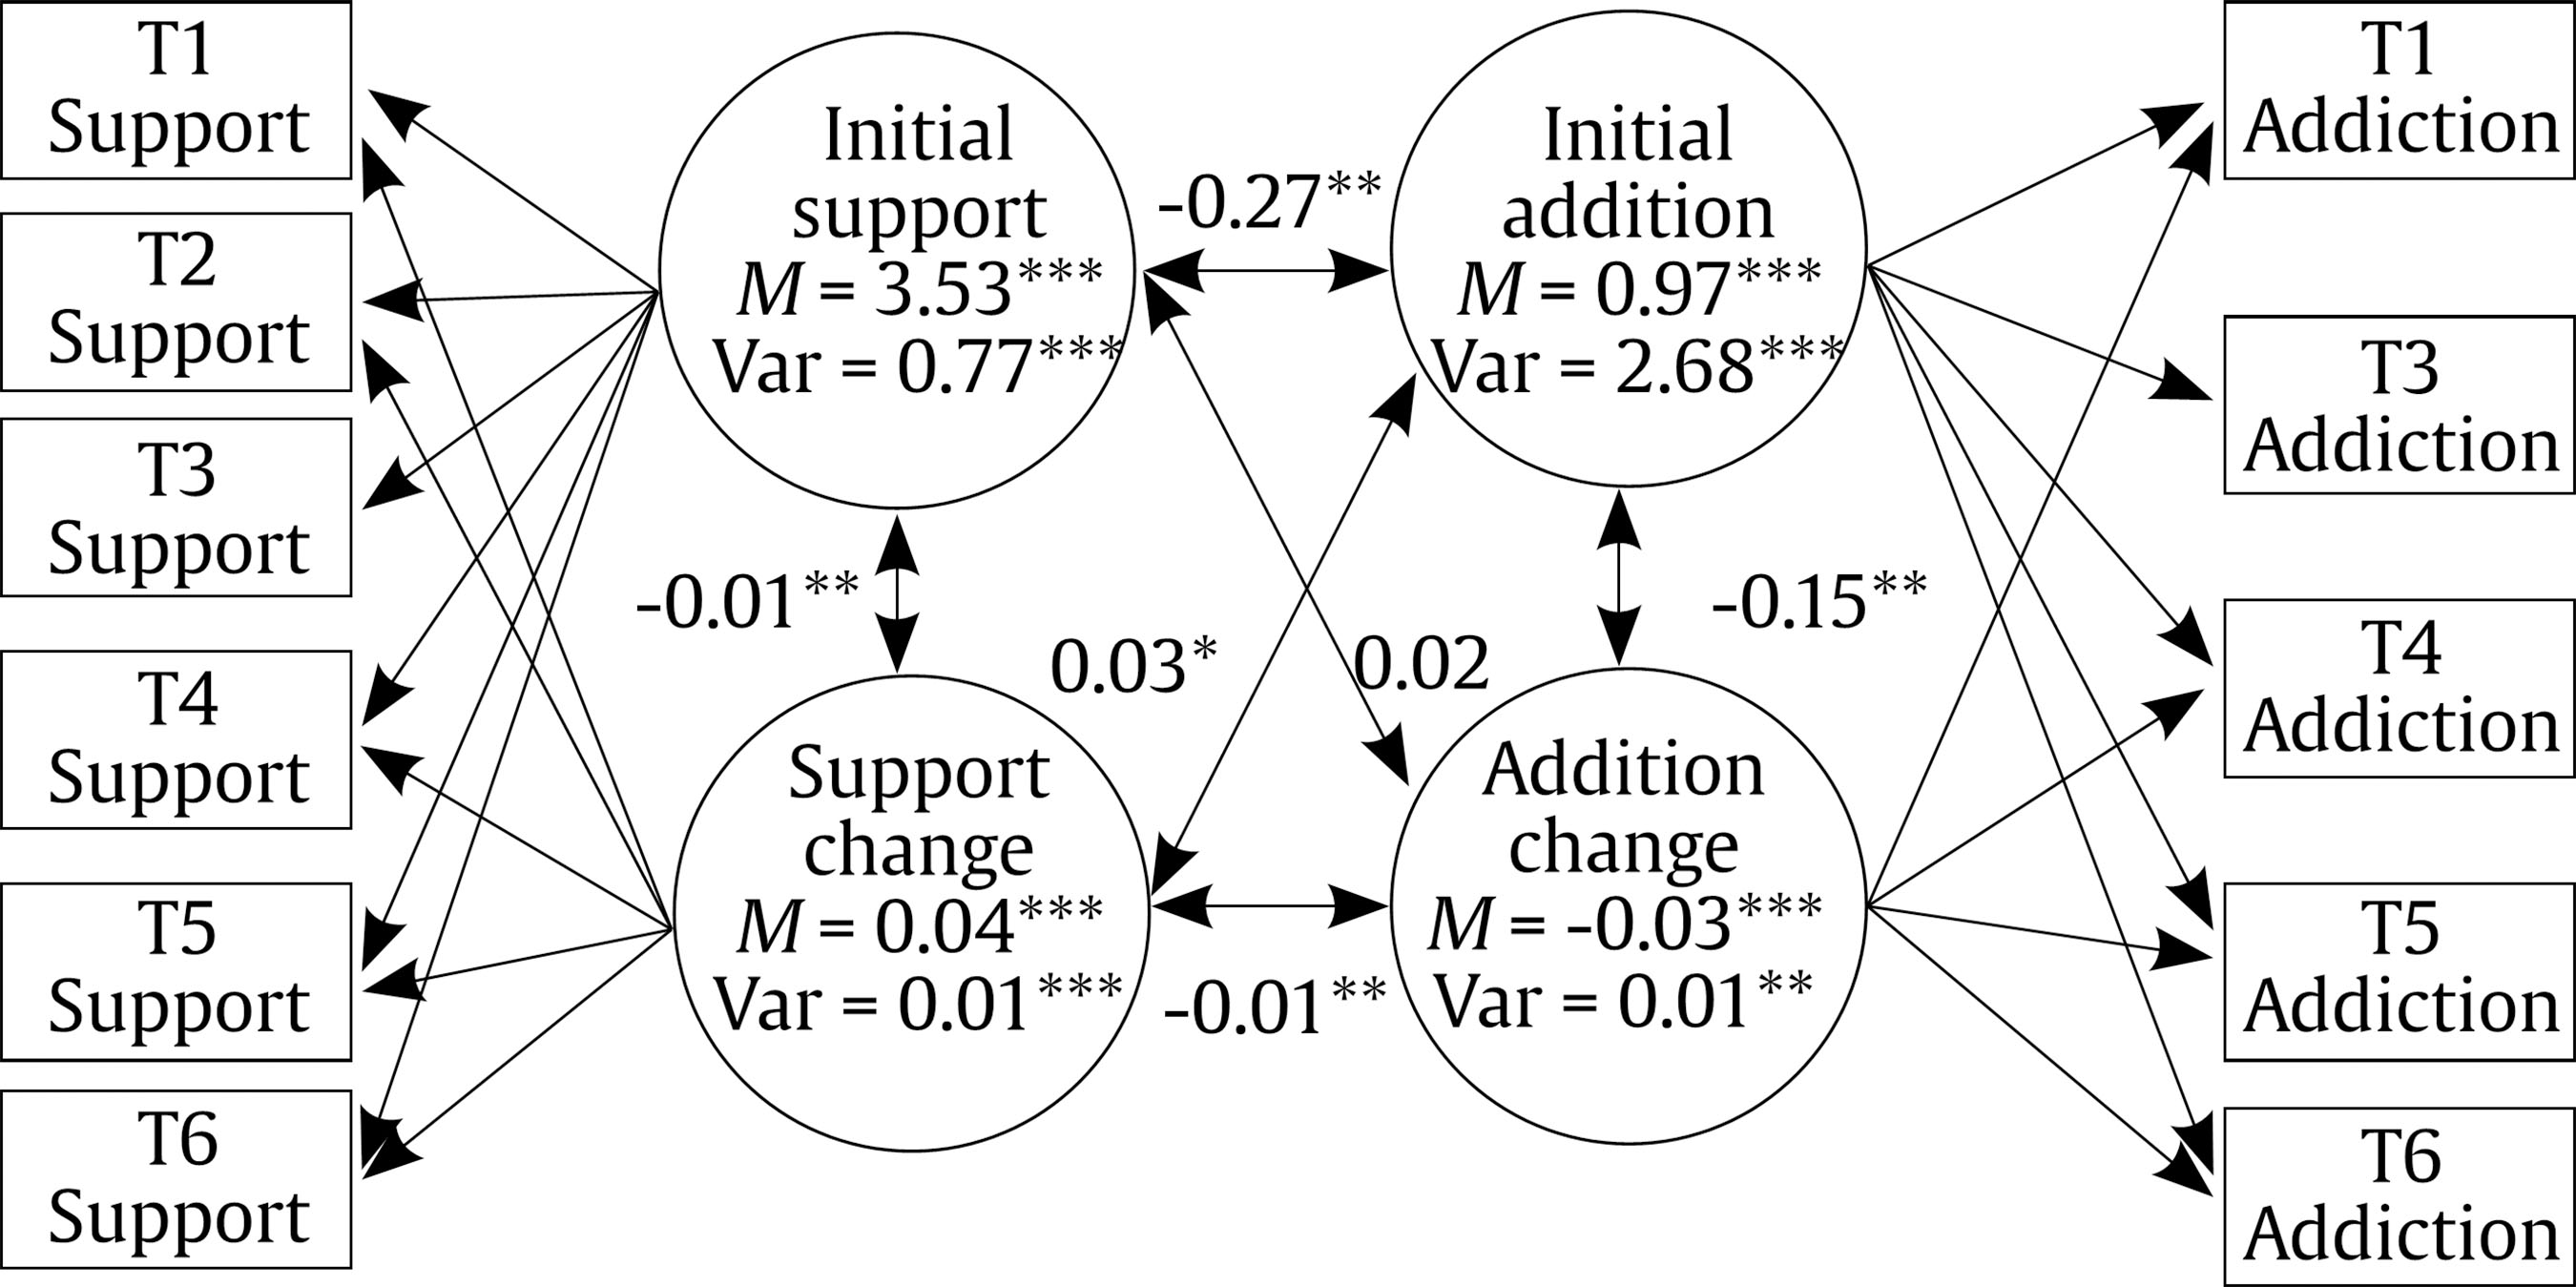 The initial levels of social support were statistically unrelated to the trajectory of social support (cov. = -0.01, SE = 0.00, ns), suggesting that growth in social support was homogeneous across different initial levels. The initial levels of smartphone addiction significantly related to the smartphone addiction growth trajectory (cov. = -0.15, SE = 0.05, p < .01), indicating that those users with higher levels of smartphone addiction at T1 showed a lower growth slope over the follow-up period. Because the slope was negative for the sample (b = -0.03) it means that more addicted users showed a faster decline (a lower negative slope) in smartphone addiction over time. Finally, the initial levels of support did not significantly relate to the smartphone addiction growth rate (cov. = 0.02, SE = 0.01, ns). The initial levels of smartphone addiction were significantly associated with the social support growth rate (cov. = 0.03, SE = 0.01, p < .01). This does not imply that the addiction increases the support – in fact, both in its initial levels and in its growth rates, smartphone addiction negatively related to social support. This effect may be marginal and requires a more in-depth study to draw definitive conclusions. The Influence of Sociodemographic Variables For the study of the influence of the sociodemographic variables, we modified Model 1 to include sex, age, size of locality, and educational background as predictors of both the initial levels of social support, smartphone addiction as well as of their growth trajectories. We freely estimated the covariation of all sociodemographic variables. Model 1a presented a good fit to the data (S-B c2 = 112.41, df = 79, p < .001, robust CFI = .98, robust RMSEA = .02, 90% CI [0.01, 0.03]). Inspection of results for Model 1a revealed that sociodemographic variables negatively related to the initial levels of social support and smartphone addiction at T1. Sex (b = -0.11, SE = 0.05, p < .05), age (b = 0.05, SE = 0.02, p < .05), and educational background (b = 0.12, SE = 0.05, p < .05) significantly predicted social support scores at T1: men, older participants, and participants that were more educated scored higher on social support at T1. Smartphone addiction (b = -0.18, SE = 0.06, p < .01) scores were higher in the lower range of age at T1. Sociodemographic variables were statistically unrelated to the trajectories of social support and smartphone addiction. The inclusion of the covariates did not remove the negative covariation between the trajectories of social support and smartphone addiction (cov. = -0.01, SE = 0.00, p < .001). These results support the existence of a general model for the evolution of social support and smartphone addiction. That is, although the initial levels in these variables were different for some sociodemographic groups, this did not affect their trajectories over time (whether ascending or descending): as smartphone addiction decreases, social support increases. Growth Mixture Modeling General Model 1 was re-evaluated using GMM techniques. Model 1 maintained that the trajectory of social support negatively related to the trajectory of smartphone addiction. Using GMM we tried to verify if several subgroups existed in the sample with different trajectories. In addition, we entered the sociodemographic variables of Model 1b to predict class membership. When the number of classes takes values greater than 1, the relation between the sociodemographic variables and the class variable represents the logistic regression of sociodemographic variables on class membership (binomial or multinomial, depending on the final number of classes). Table 2 Growth Mixture Modeling Analysis: Results of Competing Models (N = 241).  Note. LMR = LO-Mendell-Rubin; BIC = Bayesian information criterion; BLRT = parametric bootstrapped likelihood ratio test. ***p < .001. Table 2 presents a summary of the GMM analyses. The two-class model outperformed the one-class model in the indicators analyzed, (lower BICs, and both statistically significant LRT and BLRT). A three-class model showed an inadmissible solution with a class of n = 1. Therefore, we selected the two-class model for further inspection of results. The trajectories of group 1 (low addiction group) were similar to that found for the complete sample: average initial levels of social support with a significant growth every six months of 0.04 units (b = 0.04, p <.01), and low levels of addiction, with a significant decrease every six months of 0.03 units (b = -0.03, p <.05). Group 2 (high addiction group), which represented around 10% of the sample (see Table 1), showed average levels of support at the beginning of the study (b = 3.15, p <.001), stable throughout the 3-year period (b = .04, ns). This growth rate, however, varied across participants (var. = 0.001, SE = 0.00, p < .05). Unlike the low-addiction group, the initial levels of addiction were high (b = 3.71, p <.001) and very stable over time (b = 0.01, ns) in this group, although it varied across participants (var. = 0.05, SE = 0.02, p < .05). When the effect of sociodemographic variables was analyzed, results showed that the high-addiction group was composed of younger individuals (OR = 0.72, SE = 0.08, 95% CI [0.59, 0.87), p < .05]): comparing low vs. high-addiction groups, the odds ratio of being in the high addiction group decreased 0.72 times with every unit increased in age. None of the remaining sociodemographic variables showed statistical relationship to group membership (sex, OR = 0.98, SE = 0.23, ns; size of locality, OR = 0.97, SE = 0.06, ns; education, OR = 1.03, SE = 0.24, ns). According to this, there was a significant relationship between decrease in addiction and growth of social support at both low and high smartphone addiction initial levels. In users with high smartphone addiction, however, there was a general tendency to maintain their levels of social support and smartphone addiction stable over time (zero growth). The study of the relationship between smartphone addiction and social support has attracted the attention of researchers during the last years. Despite the growth of studies in the last years, the recommendations of international organizations point to a greater emphasis on longitudinal studies that allow to unravel the relationships between both (WHO, 2015). Currently, the scientific literature is very fertile in studies, generally cross-sectional, which emphasize the effect that the search for support exerts on the subsequent addiction (smartphone addiction as a consequence of low social support). Longitudinal research has recently emerged challenging this view, suggesting that smartphone addiction may also reduce support levels over time (smartphone addiction as an antecedent of low social support). In the present research, we have analyzed the evolution of smartphone addiction and social support in 241 Spanish smartphone users from a national representative sample over three years. The results of this study show that the levels of social support increased throughout the period while the addiction decreased. Moreover, the greater the increase in support, the greater the reduction in addiction. These results suggest that both processes are intertwined and that, to a certain extent, changes in one are related to changes in the other. It does not seem that the potential addiction to smartphones can help to generate new support ties or help to maintain them. Quite the contrary, it reduces them over time. According to the literature, if the addition to smartphones is associated with a desire of users to maintain and increase their support relationships (Kim, 2017), this is obviously a wrong strategy. In the end, they will isolate themselves more, lose social support and, in a negative spiral, end up increasing their levels of addiction more. However, even at good levels of support, according to the second perspective, the excess of online communication through the smartphone may, in certain cases, lead to an increase in the addiction and the consequent loss of support. These findings are in line with previous research that has also found a relationship between the evolution of social support and the levels of smartphone addiction. Herrero et al. (2019) found that users who increased their social support also showed lower levels of smartphone addiction at the end of the study. Their study, however, did not analyze the evolution of smartphone addiction, so authors could not draw conclusions in longitudinal terms, as our study does. The implications of these findings suggest a special monitoring of smartphone use in users with both poor and good levels of psychosocial adjustment. As noted in the literature in this area, users with problems of loneliness or low social support often rely more on online (i.e., smartphone) than on off-line (i.e., face-to-face) communication to reduce their feelings of loneliness and isolation (Kim, 2017). This, according to our findings, will only worsen their psychosocial adjustment: they will increasingly depend on smartphones (i.e., addiction) and, simultaneously, they will feel even more isolated. In fact, users feeling lonely or with low levels of support must take notice of their non-face-to-face communication so that they employ it in a way that enhances existing friendships and/or builds new ones (Nowland, Necka, & Cacioppo, 2018). The findings of our study also extend to users with a better psychosocial adjustment. In these users, it is also very important not to increase their dependence on smartphones (i.e., addiction) since this will reduce their levels of support. How could this happen? The pervasive presence of smartphones in our daily lives has caused non-face-to-face communication to become an increasingly common aspect of our social interactions. In fact, non-face-to-face communication frequently overlaps with our face-to-face communication in real world situations. As recently pointed out by Herrero et al. (2019), it is usual to observe groups of people sharing leisure activities in which everyone is using a smartphone to communicate with other people – who are also sharing leisure activities with other people – thus isolating themselves to monitor and answer messages. It is common to find, for example, that all the diners at a restaurant table are absorbed using their smartphones, without interacting face-to-face with each other. This can generate a dependency on the terminal that, even in psychosocially adjusted people, increases their social isolation. As Wilson (2018) has recently reminded us, there seems to be a fine balance between technology use to improve social connectedness and an over-dependence on technology that can actually worsen our psychosocial adjustment. This problem can be exacerbated in younger users (for example, adolescents) in whom their adult relational patterns are still consolidating (Andreassen, 2015; Martínez-Ferrer, Romero-Abrio, Moreno-Ruiz, & Musitu, 2018; Santisteban, & Gámez-Guadix, 2017). While the adult user may be able to distinguish which types of relationship are better for their social development, the younger user may be more confused about this, leading them to socialize in potentially addictive relational environments. The findings of the GMM analyses also suggest that there was a sizable group of users (around 10% of the participants) with high levels of addiction and relatively low levels of social support throughout the three years of the study. Somehow, these users were able to keep their addictive patterns with smartphones stable at relatively high levels. This dependence was associated with relatively lower levels of social support that, in any case, remained unchanged throughout the study period. This stability in both smartphone addition and social support seems to suggest that these users had incorporated into their lifestyle a high dependence on terminals at the expense of lower support levels. As some scholars advocate, the digital society is promoting higher rates of loneliness and technological dependence among citizens (Greengard, 2011; McPherson, Smith-Lovin, & Brashears, 2006). According to this, users of this high-addiction group would represent this trend in society. This group, in addition, was composed of younger users but with similar levels in other sociodemographic markers such as sex, size of the locality, or educational background. Our research presents strengths and potential limitations. The longitudinal nature of the study is undoubtedly a strength of the study that allows overcoming some limitations of previous studies in this area. To date, most studies in this field are cross-sectional, which, together with the frequent use of convenience samples, has limited the growth of this field (WHO, 2015). While the relationship between social support and smartphone addiction has been empirically tested in several studies (Aker et al., 2017; Billieux, Maurage et al., 2015; Billieux, Philippot et al., 2015; Ihm, 2018; Kim, 2017, 2018; Kwon et al., 2016; Lu et al., 2011), the analysis of the evolution in time had remained largely neglected. Cross-sectional studies have allowed the empirical evaluation of tentative hypotheses about the relationship between social support and smartphone addiction. This has allowed a rapid growth of theoretical explanations that, nevertheless, require longitudinal designs that allow a more precise understanding of the processes under study. These longitudinal studies are relatively scarce, probably because of the greater research effort they require in comparison to cross-sectional studies. In our case, we followed up 241 users from a representative national sample for three years. This has made it possible to study the evolution of smartphone addiction and social support, which translates into a new impulse for research in this area. Related to this, empirical studies with convenience samples (college students, for example) have traditionally dominated this area of study, which offers some doubts about the generalizability of these studies, and in any case limits their scope. The fact of having users of all ages in our research is a strength of the study. Longitudinal designs, by their nature, provide information that is more detailed but, in turn, require the use of more complex techniques that capture the relationships between variables over time. In our study, we used growth modeling and growth mixture modeling to analyze in depth the trajectories in social support and smartphone addiction of users. We believe that this also constitutes a strength of the study. The study also presents potential limitations. First, there is a potential selection bias in the participants who completed the study. This occurred mainly in terms of their levels of social support: the dropouts scored significantly less in social support. This, together with the fact that only around 27% of the users who started the study remained in it until the end, can limit the generalization of this study’s findings. In this sense, the trajectories of support of users were ascending while the evolution of their addiction was descending. It might be a subgroup with an adequate psychosocial adjustment, which may have affected the relationships found in the study. New studies with participants with higher levels of addiction and lower levels of social support – risk groups, for example – would allow a better understanding of the processes under study. For example, monitoring users with high levels of addiction over time could provide new empirical evidence. Related to this, the study of other areas of psychological and psychosocial well-being (i.e., stress, depression) in their relationship with smartphone addiction would allow understanding the consequences of this type of addiction largely. Finally, this research has followed an addiction measurement strategy based on self-reports. The literature has pointed out, however, that there are other ways of measuring addiction based on users’ behavior with their terminal – for example, through smartphone applications – that allow a more detailed study of this behavioral addiction (Rozgonjuk, Levine, Hall, & Elhai, 2018). This limitation also extends to the evaluation of social support. Our study has focused on confidant and intimate relationships (Lavallee, Sheridan, Coffee, & Daly, 2018), when several studies have shown that social support might stem from social networks as well as from communities (see Fuente & Herrero, 2012; Halamová, Kanovský, & Naništová, 2018; Herrero & Gracia, 2004, 2007; Herrero et al., 2004; Trejos-Herrera, Bahamón, Alarcón-Vásquez, Vélez, & Vinaccia, 2018). These constitute new avenues of research with a promising future in this field of study. Cite this article as: Herrero, J., Torres, A., Vivas, P., & Urueña, A. (2019). Smartphone addiction and social support: A three-year longitudinal study. Psychosocial Intervention, 28, 111-118. https://doi.org/10.5093/pi2019a6 |
Cite this article as: Herrero, J. , Torres, A. , Vivas, P. , & Urue├▒a, A. (2019). Smartphone Addiction and Social Support: A Three-year Longitudinal Study. Psychosocial Intervention, 28, 111 - 118. https://doi.org/10.5093/pi2019a6
Correspondence: alberto.uruena@upm.es (A. Urue├▒a).Copyright © 2026. Colegio Oficial de la Psicología de Madrid


 e-PUB
e-PUB CrossRef
 JATS
JATS
