
Measuring Perceived Severity of Intimate Partner Violence against Women (IPVAW) among the General Population and IPVAW Offenders
[Evaluaci├│n de la gravedad percibida de la violencia de pareja contra la mujer en la poblaci├│n general y en hombres agresores de pareja]
Manuel Martín-Fernández1, Enrique Gracia2, and Marisol Lila2
1Autonomous University of Madrid, Spain; 2University of Valencia, Spain
https://doi.org/10.5093/pi2022a8
Received 12 February 2022, Accepted 18 April 2022
Abstract
Public perceptions of the severity of intimate partner violence against women (IPVAW) incidents are an important factor that has been linked to key issues regarding this type of violence, such as acceptability or tolerance, personal sense of responsibility, attitudes toward intervention, and the public’s, professionals’, and victims’ responses to IPVAW. The aim of the present study was to provide further validity evidence for the perceived severity of IPVAW scale (PS-IPVAW), by assessing its measurement invariance between gender and age groups, and between men from the general population and male IPVAW offenders. Item response theory was also used to assess the discrimination of the items and their position on the measured latent trait continuum (i.e., perceived severity of IPVAW). To this end, the psychometric properties of the scale were examined in four different samples from the general population (N = 2,627) and in one clinical sample of male IPVAW offenders (N = 200). Our findings showed that the PS-IPVAW scale has excellent internal consistency (α = .89-.90) and a clear one-factor latent structure (CFI = .91-.96, RMSEA = .055-.086), and that partial strict invariance holds across different gender and age groups. We also found that IPVAW offenders’ perceptions of the severity of IPVAW may follow a different pattern to that of men from the general population. The PS-IPVAW scale is able to yield accurate assessments of the perceived severity of this type of violence among the general population and IPVAW offenders.
Resumen
La percepción pública de la gravedad de los incidentes de violencia contra la mujer en las relaciones de pareja (VMP) es un factor importante relacionado con aspectos clave de este tipo de violencia, como su aceptabilidad o tolerancia, el sentido de responsabilidad personal, las actitudes hacia la intervención y las respuestas a la VMP de la población general, los profesionales y las víctimas. El objetivo de este estudio fue proporcionar nuevas evidencias de validez de la escala PS-IPVAW [Perceived Severity of Intimate Partner Violence against Women], analizando su invarianza factorial entre géneros y distintos grupos de edad y entre hombres de la población general y hombres agresores de pareja. También se utilizó la teoría de respuesta al ítem para evaluar la discriminación de los ítems y su posición en el continuo del rasgo latente evaluado (i.e., la gravedad percibida de la VMP). Se examinaron las propiedades psicométricas de la escala en cuatro muestras de la población general (N = 2,627) y en una muestra clínica de hombres agresores de pareja (N = 200). Los resultados mostraron que la escala PS-IPVAW tuvo una excelente consistencia interna (α = .89-.90), una estructura latente unifactorial (CFI = .91-.96, RMSEA = .055-.086) y que se puede mantener el nivel de invarianza factorial estricta parcial entre géneros y distintos grupos de edad. Se encontró también que los hombres agresores de pareja mostraban un patrón diferencial en la evaluación de la gravedad percibida de la VMP en comparación con hombres de la población general. La escala PS-IPVAW es un instrumento capaz de evaluar de forma precisa la gravedad percibida de la VMP en la población general y en hombres agresores de pareja.
Keywords
Intimate partner violence against women, Perceived severity, Intimate partner violence offenders, Measurement invariance, Item response theoryPalabras clave
Violencia contra la mujer en las relaciones de pareja, Gravedad percibida, Hombres agresores de pareja, Invarianza factorial, Teor├şa de respuesta al ├ştemCite this article as: Martín-Fernández, M., Gracia, E., & Lila, M. (2022). Measuring Perceived Severity of Intimate Partner Violence against Women (IPVAW) among the General Population and IPVAW Offenders. Psychosocial Intervention, 31(2), 109 - 119. https://doi.org/10.5093/pi2022a8
manuel.martinfernandez@uam.es Correspondencia: manuel.martinfernandez@uam.es (M. Mart├şn-Fern├índez).Intimate partner violence is the most common form of violence suffered by women (Devries et al., 2013; Stöckl et al., 2013). With an average global lifetime prevalence of 27% and regional prevalence estimates ranging from 16% to 51%, intimate partner violence against women (IPVAW) is considered by the World Health Organization (WHO) as a major public health problem of epidemic proportions (WHO, 2013, 2021). IPVAW is a human rights violation and a barrier to gender equality and women’s empowerment, and constitutes one of the main challenges that modern societies must address to align with United Nations (UN) Sustainable Development Goal 5.2 to “eliminate all forms of violence against all women and girls in the public and private spheres, including trafficking and sexual and other types of exploitation”, set to be achieved by 2030 (United Nations [UN, 2015]). Beyond individual and relational factors, the phenomenon of IPVAW is also rooted in its socio-cultural context (Gracia et al., 2020; Heise, 1998, 2011; WHO, 2002). Public perceptions and attitudes toward IPVAW reflect the social and cultural context in which IPVAW takes place. The degree to which this type of violence in intimate relationships is tolerated or accepted, perceived as serious and of public concern, and thus deemed worthy of personal or institutional involvement, contributes to creating a social climate in which IPVAW can be facilitated or deterred (Carlson & Worden, 2005; Gracia, 2004; Powell & Webster, 2018; Waltermaurer, 2012; WHO, 2002). In this regard, a large body of research has shown that public perceptions and attitudes toward IPVAW are closely related to their perpetration, reporting and incidence rates, a victim’s help-seeking behavior, and public and professional responses to cases of IPVAW (Archer & Graham-Kevan, 2003; Capaldi et al., 2012; Copp et al., 2019; Faramarzi et al., 2005; Gracia et al., 2015; Rizo & Macy, 2011; Sardinha & Catalán, 2018; Worden & Carlson, 2005). Research has typically focused on four broad categories of public perceptions and attitudes toward IPVAW (Gracia et al., 2020): legitimation of IPVAW (e.g., victim blaming, justification), acceptability of IPVAW (e.g., tolerance, approval), attitudes toward intervention in cases of IPVAW (e.g., willingness to help, attitudes toward reporting, propensity to intervene), and perceived severity of IPVAW (e.g., seriousness, or minimization). Interestingly, of these four categories, perceived severity of IPVAW has received the least scholarly attention (Gracia et al., 2020). Perceived severity of IPVAW is, however, an important factor that has been linked to key issues regarding this type of violence, such as its acceptability or tolerance, personal sense of responsibility, attitudes toward intervention, and responses to incidents of this type of violence among the general public, professionals, and victims of IPVAW (Gracia et al., 2020). The public’s, professionals’, and victims’ responses may depend on the perceived severity of IPVAW incidents. If some IPVAW incidents are perceived as normal, trivial, or not serious enough, and only certain types of IPVAW behaviors that involve repeated, severe, or extreme violence are considered sufficiently serious, it is more likely that some violence toward women in intimate relationships may be deemed acceptable or tolerable, and therefore not deserving the involvement and intervention of people who are aware of the incidents or even efforts by the victim to seek help (Gracia, García, & Lila, 2009; Gracia et al., 2018; Leon et al., 2021). For example, according to psychosocial models of bystander intervention (Latané & Darley, 1970; Piliavin et al., 1981), the perceived severity of an incident is a precondition to the decision to intervene and, therefore, if some incidents of IPVAW are perceived as not serious enough, those aware of the incident will be less willing to intervene (Gracia, Herrero, et al., 2009; Gracia et al., 2018). In this regard, a substantial body of research has illustrated the link between the perceived severity of IPVAW incidents and the type of public and professional responses and involvement, as well as victims’ help-seeking behaviors (Baldry & Pagliaro, 2014; Djikanovi et al., 2012; Ergöçmen et al., 2013; Fanslow & Robinson, 2010; Frías, 2013; Gracia et al., 2008; Gracia, García, et al., 2009; Gracia, Herrero et al., 2009; Hyman et al., 2009; Kiss et al., 2012). Finally, another important reason to address the perceived severity of IPVAW is that perception of incidents of this type of violence as normal, trivial, or not serious enough is still quite prevalent. For example, a report on attitudes toward violence against women in the European Union (Gracia & Lila, 2015) found that relevant percentages of women respondents from different countries and age groups did not want to talk about or report violence because “the incident was too trivial”, because “they do not consider aggressions as something serious”, or because “the victims considered the experienced violence as normal or not serious.” In light of the above, it becomes apparent that psychometrically sound instruments are needed to accurately assess the perceived severity of IPVAW across community and clinical samples, thereby advancing our knowledge on public perceptions, attitudes, and responses to IPVAW, and contributing to the prevention efforts to reduce and gradually eliminate this type of violence in our societies. To this end, in this study we present further validity evidence for the perceived severity of IPVAW (PS-IPVAW) scale, a widely used questionnaire to measure this construct. The Present Study The perceived severity of IPVAW (PS-IPVAW) scale is an 8-item measure developed initially to assess this construct both among the general population and law enforcement professionals (Gracia et al., 2008; Gracia, García, et al., 2009). It has been widely used in different settings (including Ecuador, Portugal, Spain, and USA), with different purposes and samples, including the general public, law enforcement professionals, and IPVAW offenders (Catalá-Miñana et al., 2013; El Sayed et al., 2020; Expósito-Álvarez et al., 2021; Gracia et al., 2011, 2014; Lila et al., 2013; Lila et al., 2019; Martín-Fernández, Gracia, & Lila, 2018; Martín-Fernández, Gracia, Marco, et al., 2018; Martín-Fernández et al., 2021; Sani et al., 2018; Vargas et al., 2017; Villagrán et al., 2020, 2022; Vitoria-Estruch et al., 2017). It is important, however, to continue examining the validity evidence for the PS-IPVAW scale. On the one hand, although this scale has been used as a one-dimensional measure, to the best of our knowledge, no study has tested its latent structure using factor analysis. On the other hand, the measurement invariance of the PS-IPVAW scale has not been examined across different gender and age groups. Establishing measurement invariance is an important step before making comparisons between groups to rule out a potential measurement bias. Ascertaining whether respondents from different gender and age groups conceptualize the construct and interpret the items in a similar way allows researchers to make proper and valid comparisons across such groups (Putnick & Bornstein, 2016). Neither has the measurement invariance of the PS-IPVAW scale been tested across men from the general population and IPVAW offenders, which is important not only to rule out measurement bias between these populations, but to establish whether IPVAW offenders show a different pattern in the way they perceive the severity of this type of violence. Testing measurement invariance between men from the general population and IPVAW offenders is also crucial to develop new intervention strategies and improve existing ones used with this clinical population. Hence, the aim of the present study was to provide further validity evidence for the PS-IPVAW scale. To this end, the psychometric properties of the scale were examined in four different samples by assessing the scale’s internal consistency and latent structure, and testing its measurement invariance across gender and age groups. The measurement invariance of the scale between men from the general population and a clinical sample of IPVAW offenders was also tested. In addition, the discrimination of the items and their position on the latent trait continuum (i.e., perceived severity of IPVAW) were assessed through item response theory (IRT). Validity evidence based on its relation to other variables was also assessed by relating the factor scores of the PS-IPVAW scale to other relevant constructs regarding attitudes toward IPVAW such as acceptability of IPVAW, victim-blaming attitudes, willingness to intervene in cases of IPVAW, and gender prejudice conveying negative images and beliefs about women such as ambivalent sexism (Glick & Fiske, 1997; Gracia et al., 2018; Herrero et al., 2017; Lelaurain et al., 2021; Lila et al., 2013; Martín-Fernández, Gracia, & Lila, 2018; Martín-Fernández et al., 2021). Participants and Procedure A total of 2,627 participants were recruited for the present study through online sampling using social media and e-mail snowballing, an effective and cost-efficient sampling method (Thornton et al., 2016; Topolovec-Vranic & Natarajan, 2016). Participants provided their informed consent to take part in the study before accessing and completing an online form. Participation was anonymous and voluntary. Two inclusion criteria were used: being adult and responding to all the questions and items in the online form. Participants were randomly split into four sample groups with a similar proportion of respondents of the same gender, age, educational level, and nationality. In addition, a clinical sample consisting of 200 male IPVAW offenders court-mandated to a community-based intervention program was also recruited. The sociodemographic characteristics of the samples are shown in Table 1. Table 1 Sociodemographic Characteristics of the Samples 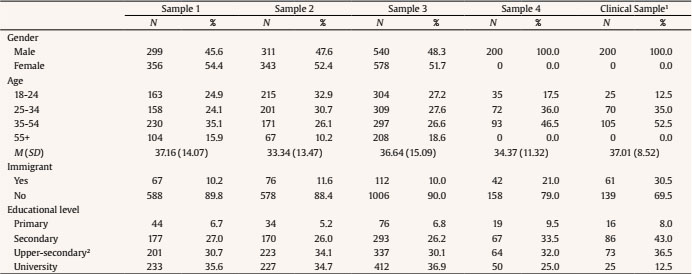 Note. 1The clinical sample comprised male IPVAW offenders. 2Upper-secondary education is the stage before university education and includes vocational, technical and employment education. The first and second samples were used to assess the psychometric properties of the PS-IPVAW scale and to cross-validate the latent structure of this measure. The third sample included a larger number of participants in order to examine the measurement invariance across gender and age groups. The fourth sample was used to inspect the measurement invariance between men from the general population and the clinical sample of IPVAW offenders. Measures Perceived severity of IPVAW (PS-IPVAW; Gracia et al., 2008). The original PS-IPVAW scale is an 8-item instrument in which each item presents an IPVAW scenario (e.g., “In an argument, a man hits his partner and later apologizes to her”). Participants in this study were asked to rate the level of severity of each scenario on a scale from 0 to 10 (the higher the number, the higher the severity). Previous research has related the PS-IPVAW scale scores to other constructs such as ambivalent sexism, empathy, personal responsibility, attitudes of acceptability of IPVAW, victim-blaming attitudes, and willingness to intervene in IPVAW cases (Gracia et al., 2011; Gracia et al., 2018; Lila et al., 2013; Martín-Fernández, Gracia, & Lila, 2018; Martín-Fernández et al., 2021). Attitudes of acceptability of IPVAW (A-IPVAW; Martín-Fernández, Gracia, Marco, et al., 2018). The short version of the A-IPVAW scale was used in this study (Martín-Fernández et al., 2021). This measure comprises 8 items assessing an individual’s levels of acceptance of this type of violence (e.g., “It is acceptable for a man to shout at his partner if she is continuously arguing and nagging him”). The items were rated on a 3-point Likert-type scale (1 = not acceptable, 3 = acceptable). This instrument has demonstrated adequate validity evidence in previous research and has been linked to other relevant IPVAW-related constructs such as victim-blaming attitudes to IPVAW, willingness to intervene in cases of IPVAW, ambivalent sexism, and social perception of IPVAW (Gracia et al., 2018; Martín-Fernández, Gracia, & Lila, 2018; Sánchez-Hernández et al., 2020). The internal consistency of the A-IPVAW scale across all samples of this study was acceptable overall (αSample1 = .75, αSample2 = .73, αSample3 = .78, αSample4 = .68). Victim-blaming attitudes in cases of IPVAW (VB-IPVAW; Martín-Fernández, Gracia, & Lila, 2018). The 5-item version of the VB-IPVAW scale was used in this study. Participants rated their level of agreement with each of the items (e.g., “A man will change his behavior toward his partner if she becomes more obedient”) on a 4-point Likert-type scale (1 = strongly disagree, 4 = strongly agree). This scale has been validated in the Spanish and Ecuadorian socio-cultural contexts, and it showed a strong relationship with individuals’ levels of ambivalent sexism, acceptability of IPVAW, and willingness to intervene in cases of IPVAW (Gracia et al., 2018; Martín-Fernández, Gracia, & Lila, 2018; Villagrán et al., 2020). The internal consistency of the scale in this study was good (αSample1 = .83, αSample2 = .79, αSample3 = .85, αSample4 = .77). Willingness to intervene in cases of IPVAW (WI-IPVAW; Gracia et al., 2018). The WI-IPVAW scale assesses an individual’s pro-intervention attitudes in cases of IPVAW. The 9-item version was used in this study, which presents different scenarios tackling three specific factors corresponding to three types of behavioral intentions: reporting the incident to the authorities (e.g., “If I found out that a woman in my neighborhood was frequently beaten by her partner, but did not want to report it to the authorities, I would call the police”); personal involvement in the case (e.g., “If I heard a man shouting violently at his partner in the communal area of my building, I would intervene to stop the situation”); and ignoring the situation (e.g., “If a young couple was shouting and insulting each other in the street, I would ignore them”). Participants responded to the items on a 6-point Likert-type scale (1 = very unlikely, 6 = extremely likely). Individuals’ scores in the WI-IPVAW scale have been associated with attitudes of acceptability of this type of violence, victim-blaming attitudes, and hostile sexism (Gracia et al., 2018). The internal consistency of the overall scale was also good across all samples (αSample1 = .80, αSample2 = .78, αSample3 = .76, αSample4 = .84). Hostile sexism (Expósito et al., 1998; Glick & Fiske, 1997). The short version of the hostile sexism subscale of the original Ambivalent Sexism Inventory was used in this study (Rollero et al., 2014). This 6-item version evaluates hostile sexism with a 6-point Likert-type scale (e.g., “Women seek to gain power by getting control over men”; 1 = totally disagree, 6 = totally agree). This scale has been adapted to more than 20 countries, showing adequate psychometric properties (Glick et al., 2000; Glick et al., 2002). Scores on this scale have been related to attitudes toward intervention, responsibility attribution, justification of partner violence, acceptance of myths about IPVAW, victim-blaming attitudes, and beliefs about domestic violence in European countries (Gracia et al., 2020). The internal consistency of this shortened version in this study was excellent (αSample1 = .88, αSample2 = .89, αSample3 = .90, αSample4 = .90). Data Analysis The following analyses were carried out to examine the psychometric properties of the PS-IPVAW scale. First, the descriptive statistics of the items (i.e., mean, standard deviation, skewness, and kurtosis), as well as the item-test corrected correlation, were computed for all items using the first sample. To assess the latent structure of the scale, an exploratory factor analysis (EFA) and a confirmatory factor analysis (CFA) were conducted using the first and second samples, respectively. Before conducting the EFA, the Kaiser-Meyer-Olkin (KMO) statistic was obtained, and Bartlett’s sphericity test was performed to assess the suitability of the dataset to perform this analysis. A parallel analysis was also carried out to determine the number of factors to extract (Garrido et al., 2013). An EFA was conducted afterwards using the robust maximum-likelihood (MLR) estimation method, as this procedure yields accurate model parameter estimates and standard errors with either normally or non-normally distributed continuous indicators (Asparouhov & Muthén, 2005; Maydeu-Olivares, 2017). The goodness of fit of the factorial solution was evaluated using a combination of fit indices: comparative fit index (CFI) and Tucker-Lewis index (TLI) values above .90 and .95 indicate an acceptable and good fit, respectively; root mean square error of approximation (RMSEA) values below .10, .08, and .06 indicate poor, mediocre, and excellent fit, respectively; and standardized root mean square residual (SRMR) values below .08 indicate good fit (Hu & Bentler, 1999; MacCallum et al., 1996). To further inspect the properties of the items and their information, an item response (IRT) model was fitted. Considering the continuous nature of the data, the continuous response model was applied to the first sample (Samejima, 1973), estimated using maximum-likelihood with the expectation-maximization algorithm (Zopluoglu, 2012, 2013). This model allows us to identify which levels of the latent trait continuum (i.e., perceived severity) are better assessed by each item. A CFA was then conducted to test the stability of the latent structure found in the first sample by replicating the same factorial model in the second sample. The model was also fitted using the MLR estimation method. The goodness of fit was assessed using the same combination of fit indices (i.e., CFT/TLI ≥ .95, RMSEA ≤ .06, and SRMR ≤ .08). The internal consistency of the scale was evaluated by computing Cronbach’s alpha for each sample. Once the latent structure of the scale had been established, we examined whether the PS-IPVAW was invariant across gender and age groups using the third sample. To do so, four age groups were established, grouping participants aged between 18 and 24, 25 and 34, 35 and 54, and above 55. This age categorization is similar to the one used to map Spanish internet users (Acebes-Arribas, 2016). A series of multi-group CFA were carried out to test for configural, metric, scalar, and strict invariance (Putnick & Bornstein, 2016). Configural invariance tests whether the same factorial model is applicable to the different gender and age groups. Metric invariance evaluates whether the same item loadings can be estimated across groups. Scalar invariance adds a new constraint to the metric invariance, assessing whether the values of the item loadings and intercepts can be equal across groups. Strict invariance adds another constraint to the scalar invariance, testing whether the residual variances of the items can be fixed to the same value across gender and age groups. All models were estimated using MLR. To assess the fit of the measurement invariance models, we obtained the changes in CFI (ΔCFI) and RMSEA (ΔRMSEA) indices. We followed the usual guidelines proposed for measurement invariance testing (Milfont & Fischer, 2010; Putnick & Bornstein, 2016), considering that there were no differences between two invariance models if ΔCFI ≤ |.010| and RMSEA≤ |.015| (Chen, 2007; Cheung & Rensvold, 2002). If at least scalar invariance holds across groups, then participants’ responses can be compared across gender or age groups through a latent means analysis. After the measurement invariance of the scale was examined, criterion-related validity was assessed using the first and second samples by obtaining the correlations between the PS-IPVAW scale and the A-IPVAW, VB-IPVAW, WI-IPVAW, and hostile sexism scales. In addition to these analyses, we examined the psychometric properties of the PS-IPVAW scale in a clinical sample of IPVAW court-mandated offenders. To this end, a new CFA was conducted to examine the latent structure of the scale and its internal consistency was evaluated by obtaining Cronbach’s α with the clinical sample of IPVAW offenders. We also compared the differences in the factor means between the fourth sample of male participants from the general population and the clinical sample through a new multi-group CFA. The descriptive, IRT, and validity analyses were conducted with the statistical package R (R Core Team, 2021), using the psych and EstCRM libraries (Revelle, 2021; Zopluoglu, 2012). Factor analyses were carried out using the statistical package Mplus 8.2 (Muthén & Muthén, 2017). Descriptive Analysis The first sample was used to conduct the descriptive analysis of the PS-IPVAW scale. The descriptive statistics of the items showed that most of the participants rated the severity of the scenarios highly, with mean values around 9 and standard deviations around 1.30. The skew and kurtosis statistics also showed this tendency as all items presented negatively skewed and leptokurtic response distributions, showing that most of the participants’ ratings were in the upper values of the response scale. The corrected item-test correlations were above .40 for all items, indicating a strong relationship between each item and the rest of the scale (Table 2). Table 2 Descriptive Statistics of the PS-IPVAW (Sample 1) 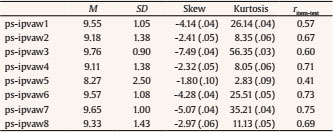 Exploratory Factor Analysis and Item Response Theory To test the latent structure of the PS-IPVAW, an EFA was conducted with the first sample. The Kaiser-Meyer-Olkin statistic (KMO = .89) and Bartlett’s sphericity test, K2(7) = 1,147.6, p < .001, indicated that the dataset was suitable to conduct this analysis. The parallel analysis showed that only one factor was needed, and hence a one-factor solution was estimated. The goodness of fit of the resulting model was poor, albeit close to an acceptable fit (CFI = .89, TLI = .85, RMSEA 90% CI = .085 [.071, .101], and SRMR = .053). All item loadings presented values above .50, except for item 5, which was .40 (Table 3). Table 3 PS-IPVAW Item Loadings and IRT Parameters (Sample 1) 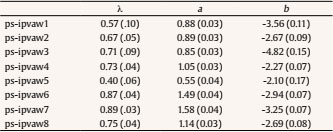 To further inspect the item properties, the continuous response IRT model was fitted afterwards. The discrimination a-parameters indicate how informative each item is to assess the latent trait continuum (i.e., perceived severity of IPVAW), whereas the position b-parameters show the point on the latent trait continuum where the information reaches its peak. In this case, the a-parameters were above 0.80 for most of the items —except for item 5, which was 0.55— and the b-parameters were all negative and below -2, suggesting that the items are especially informative for very low levels of perceived severity (Table 3). The item response curves showed that as the perceived severity increases, so does the responses given by the participants to the items (Figure 1). Figure 1 Item Category Response Curves (Sample 1). 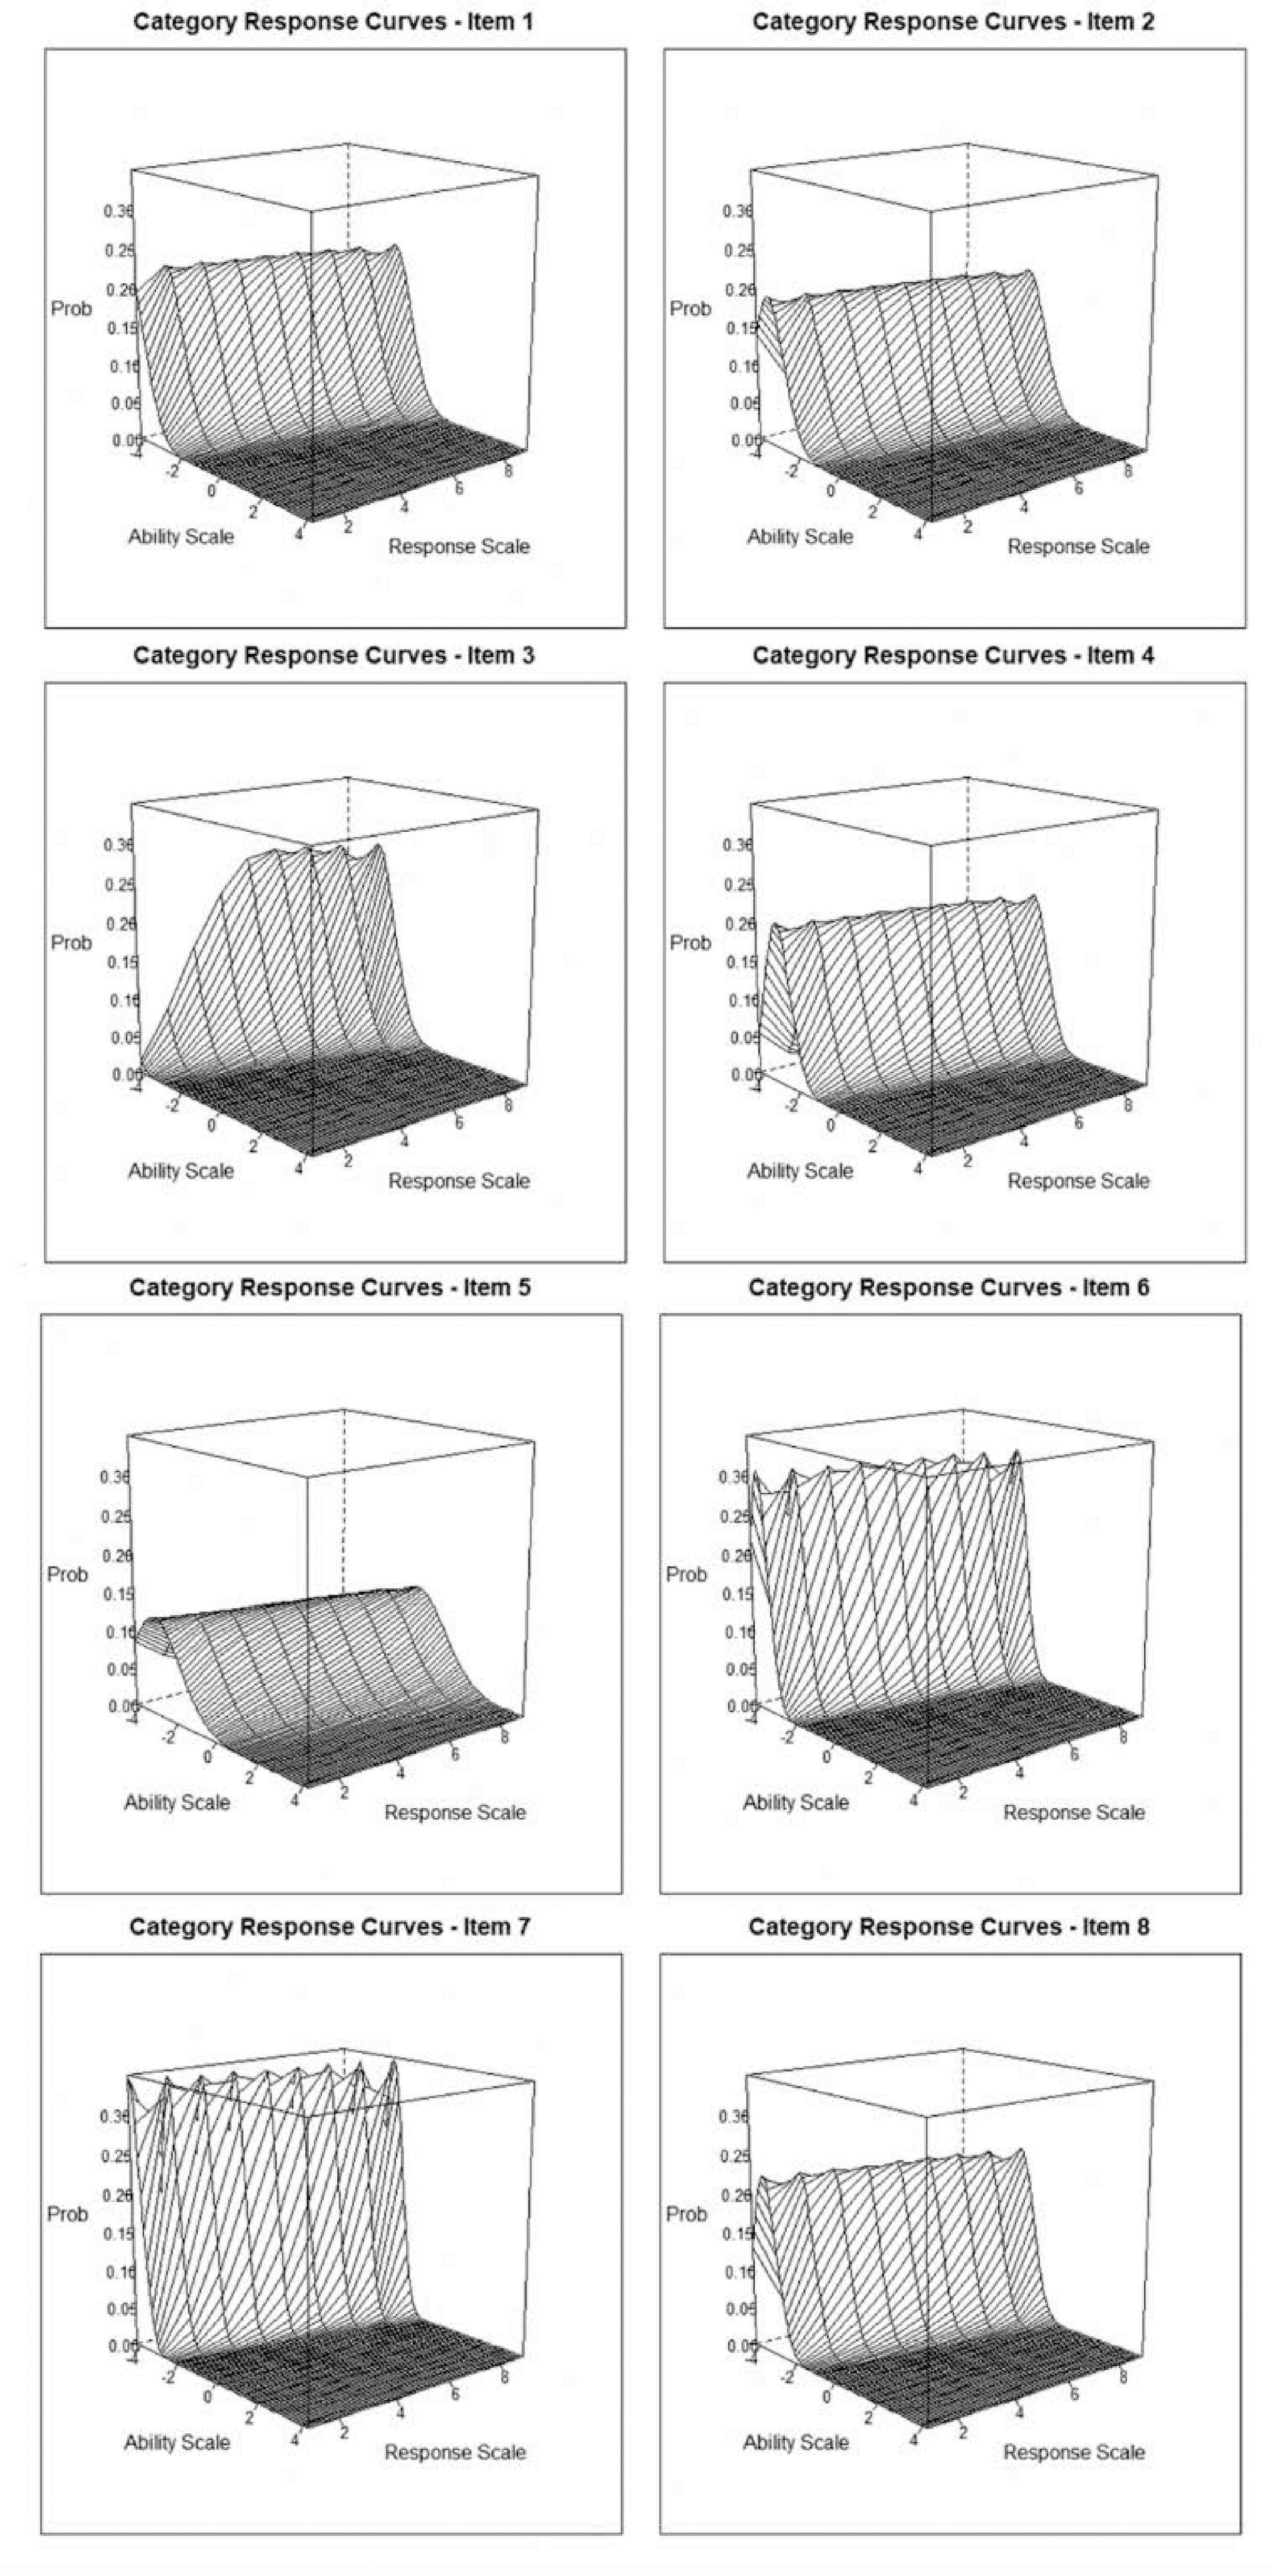 Given that item 5 presented the lowest item loading and discrimination a-parameter and that the information provided by this item was also the lowest, we removed it from the original scale and from the following analyses. By doing so, the model goodness of fit improved and showed an acceptable fit (CFI = .91, TLI = .86, RMSEA 90% CI = .086 [.068, .104], and SRMR = .051). The final 7-item PS-IPVAW scale can be found in the Appendix. Confirmatory Factor Analysis and Internal Consistency The second sample was used to replicate the one-factor solution in a different independent sample. The one-factor model showed an excellent fit (CFI = .96, TLI = .94, RMSEA 90% CI = .055 [.036, .075], SRMR = .032). All loadings were above .60, supporting a strong relationship between each item and the factor of perceived severity (Figure 2). Figure 2 CFA Model (Sample 2). 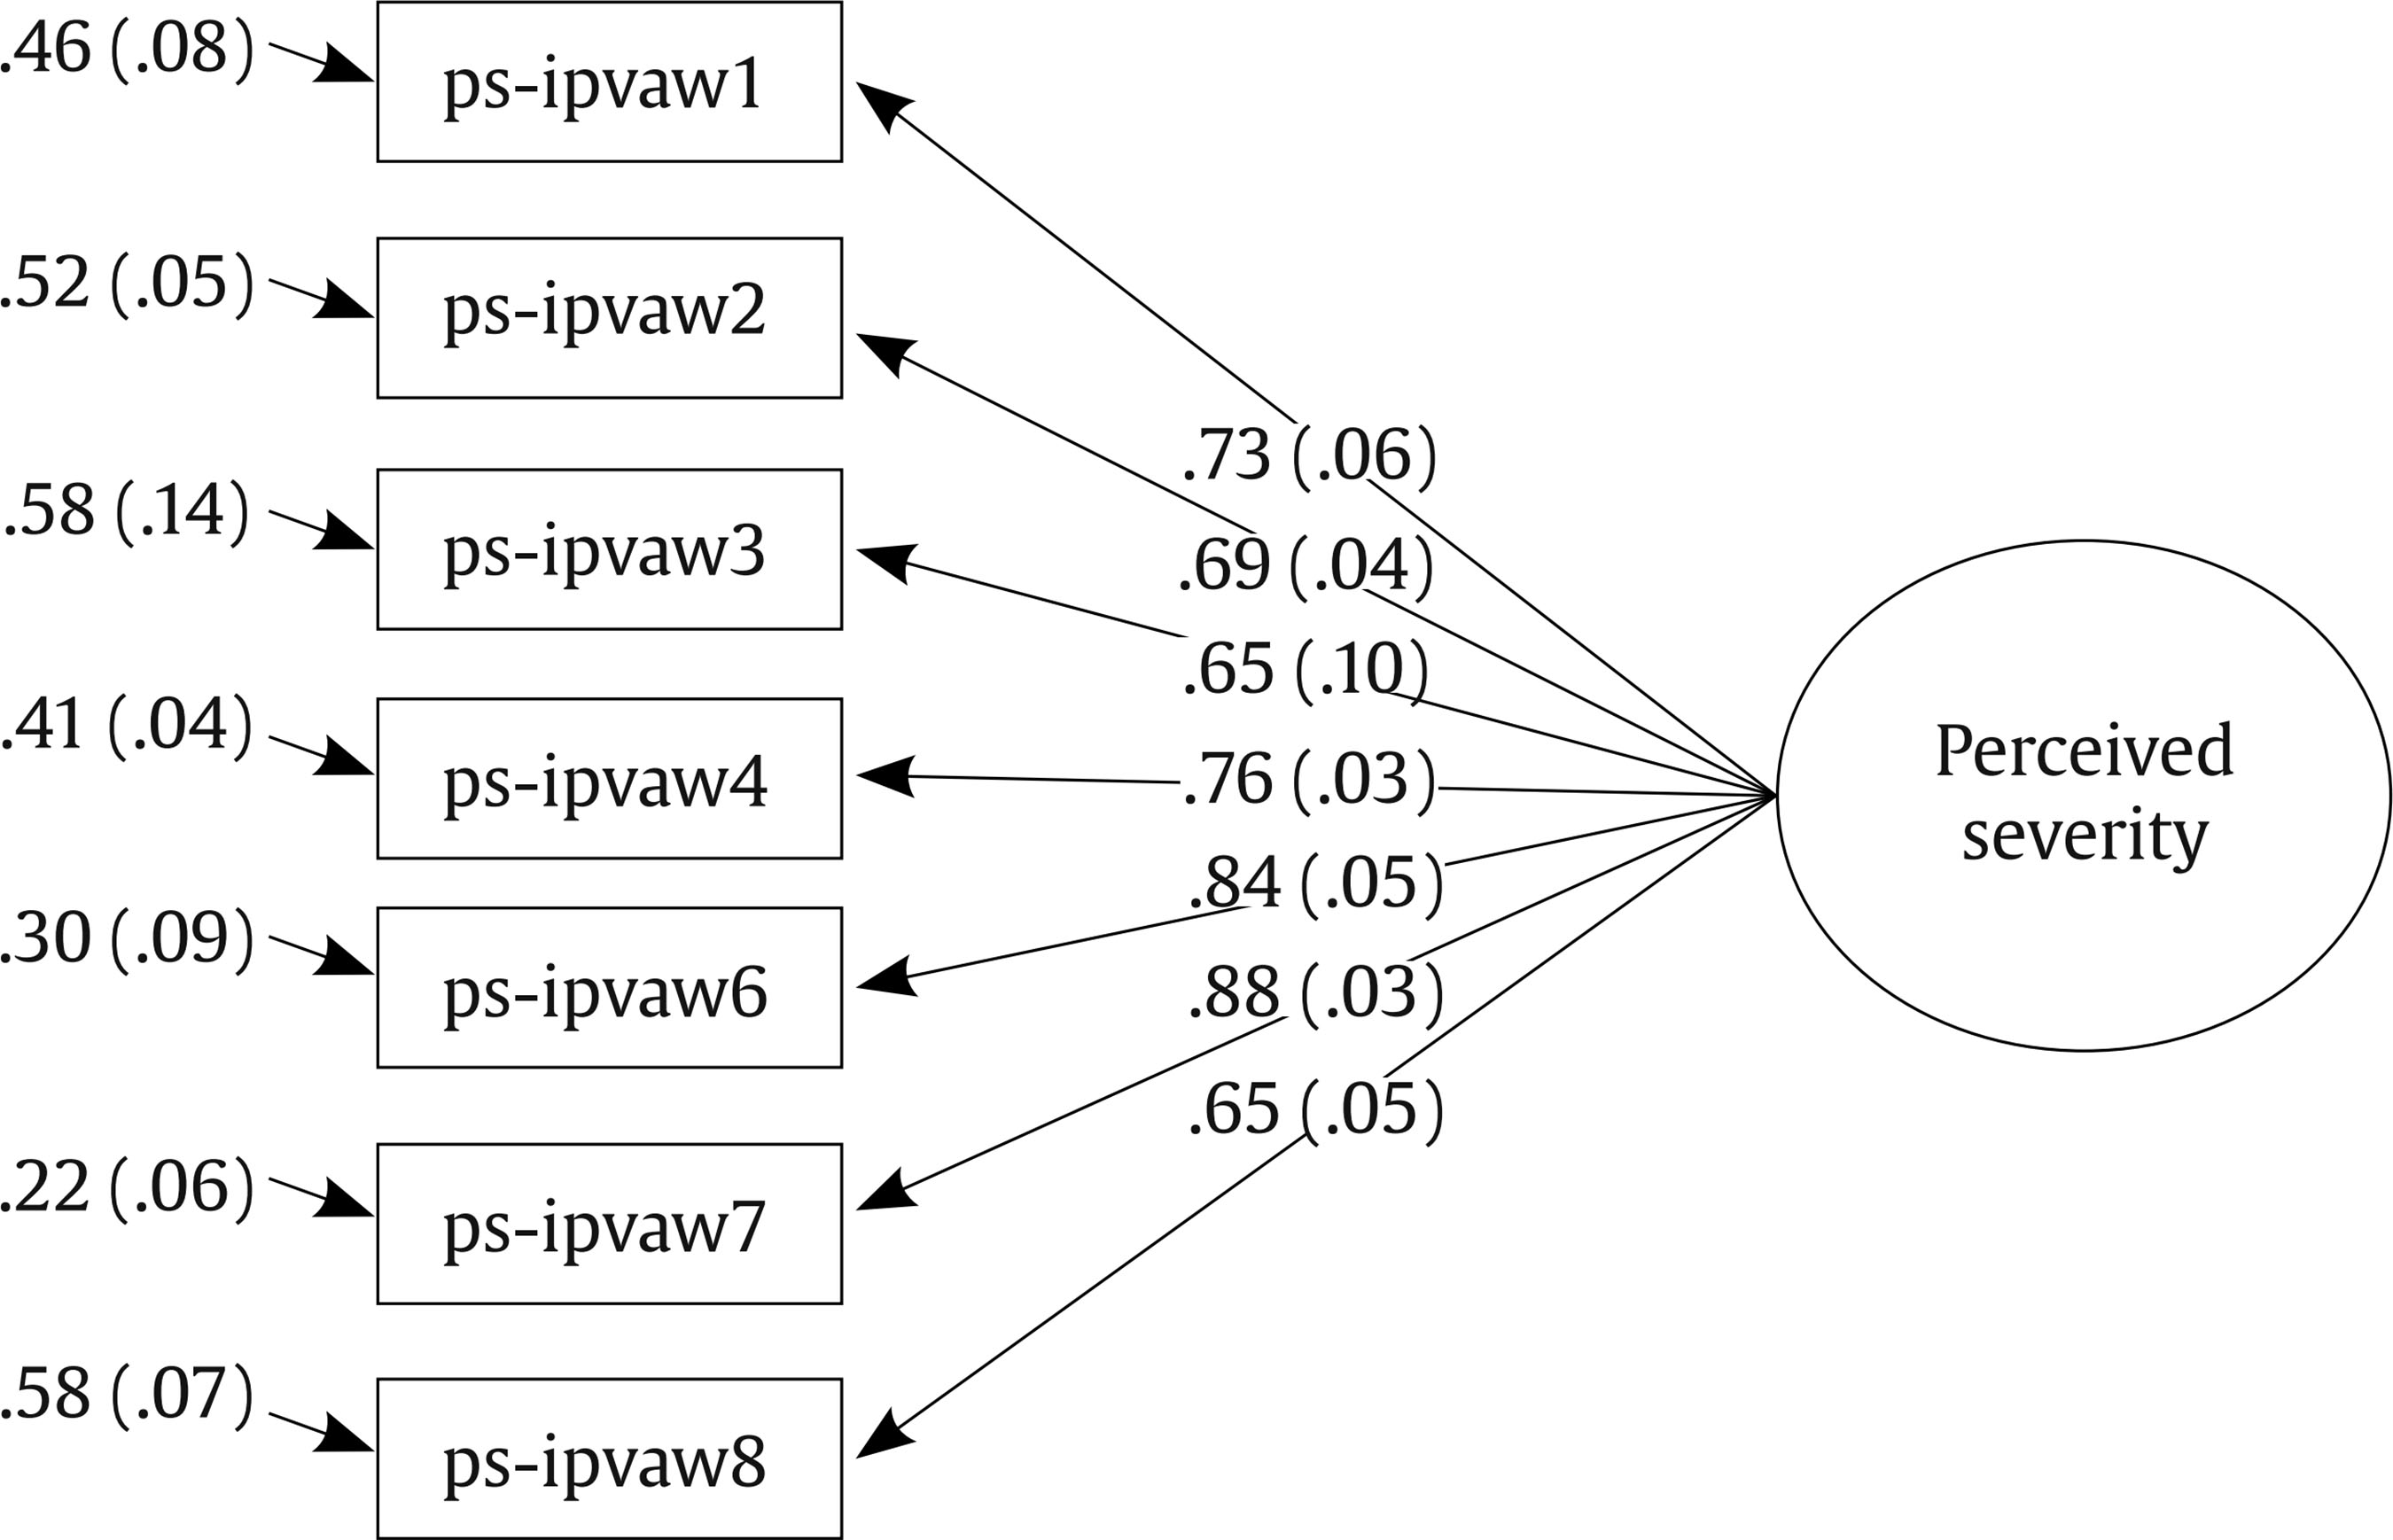 After the latent structure of the scale had been determined, its internal consistency was examined. Cronbach’s α was .89 in the first sample and .90 in the second sample, indicating a good internal consistency for the PS-IPVAW scale. Measurement Invariance The measurement invariance of the PS-IPVAW scale across gender and age groups was assessed using the third sample (Table 4). Configural invariance was first tested across gender as the base line model. It showed a good fit to the data, supporting that the same factorial model could be applied to men and women. When the item loadings were fixed to the same value across gender, the fit indices of the model improved slightly, albeit exceeding the ΔCFI ≤ |.010| cutoff suggested by Cheung and Rensvold (2002). No differences were found, however, between the configural and metric invariance models when they were compared using the Satorra-Bentler scaled chi-square difference test, Δχ2(7) = 0.38, p = .999, and hence metric invariance was supported. The full scalar invariance model was not supported across gender (ΔCFI = -.021). A close inspection of the modification indices suggested that freeing the intercept parameters of items 2 and 4 was necessary. A partial scalar invariance model was then tested, and the fit indices obtained were below ΔCFI ≤ |.010| and ΔRMSEA ≤ |.015|, indicating that partial scalar invariance held. Finally, strict invariance was assessed by fixing all residuals to the same value across gender and, given that the changes in the fit indices were below the cutoffs, the strict invariance model was also supported. Table 4 Measurement Invariance across Gender and Age Fit Indices (Sample 3)  Note. χ2 = scaled chi-square; df = degrees of freedom; CFI = comparative fit index; RMSEA = root mean squared error of approximation; ΔCFI = change in the CFI; ΔRMSEA = change in the RMSEA. 2-4Intercepts of items 2 and 4 freed across groups. 4Intercept of item 4 freed across groups. Similar results were found for the measurement invariance of the scale across age groups. The configural invariance model showed excellent goodness of fit, but the fit indices improved slightly when the item loadings were constrained to be equal across groups in the metric invariance model. However, these differences were not significant, Δχ2(21) = 14.92, p = .827, thus supporting metric invariance. The full scalar model again showed a decrement above the ΔCFI ≤ |.010| cutoff, and a partial scalar invariance model was tested by freeing the intercept of item 4. The changes in the fit indices of this partial invariance model were below the ΔCFI and ΔRMSEA cutoffs, and hence partial scalar invariance was supported. Fixing the item residual to the same value across age groups did not substantially decrease the fit indices of the model, thus indicating that strict invariance also held. After establishing strict invariance across gender and age groups, the factor means were compared by a latent means analysis. In this comparison, men presented lower perceived severity levels than women, Zmen = -0.264, SE = 0.061, p < .001. No differences were found between participants aged between 18 and 24 and those between 25 and 34, Z25-34 = 0.067, SE = 0.084, p = .426, and above 55, Z55+ = 0.137, SE = 0.097, p = .160. Significant differences were found, however, between participants aged between 18 and 24 and those aged between 35 and 54, with the latter group presenting higher perceived severity levels, Z35-54 = 0.189, SE = 0.080, p = .018. The goodness of fit of both models was good (Table 4). Validity Evidence Based on Its Relation to Other Variables Participants’ total scores in the PS-IPVAW scale were correlated to the A-IPVAW, VB-IPVAW, WI-IPVAW, and hostile sexism scales in the first two samples (Table 5). Results indicated that participants with higher levels of perceived severity also presented lower levels of acceptability, victim-blaming attitudes, and hostile sexism. We also found that participants who showed higher levels of perceived severity tend to present higher willingness to intervene in cases of IPVAW. Table 5 Correlations between the PS-IPVAW and Other Related Variables (Samples 1 and 2) 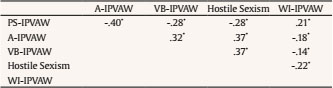 Note. PS-IPVAW = perceived severity; A-IPVAW = attitudes of acceptability; VB-IPVAW = attitudes of victim blaming; WI-IPVAW = willingness to intervene. *p < .05. Measurement Invariance between Men from the General Population and IPVAW Offenders The latent structure of the scale was first assessed in a clinical sample of IPVAW offenders. The one-factor model was replicated, and the results showed an acceptable goodness of fit (CFI = .95, TLI = .93, RMSEA [90% CI] = .063 [.037, .088], SRMR = .051). The internal consistency of the PS-IPVAW was also good (α = .86). A new multi-group CFA was performed to compare the factor means of men from the general population and IPVAW offenders (Table 6). Configural and metric invariance were supported. Although the metric model presented a better fit than the configural model, these differences were not significant, Δχ2(6) = 5.75, p = .548, thus supporting metric invariance. The scalar invariance model, however, presented a CFI substantially lower than the metric invariance model, and hence we proceeded to check the modification indices and fit three additional models to test for partial metric invariance. The intercept of three items (i.e., items 2, 4, and 6) needed to be freed across the IPVAW offenders and male participants from the general population to obtain a CFI below ΔCFI = |.010|. The intercept of these items was lower for the IPVAW offenders (τ2 = 3.17, τ4 = 3.16, τ6 = 4.34) than for the male participants (τ2 = 6.17, τ4 = 6.39, τ6 = 8.75), indicating that, on average, IPVAW offenders tend to systematically rate these items as less severe than male participants from the general population. The strict invariance model showed a poor goodness of fit, and hence the item residuals were left unconstrained across groups. Table 6 Measurement Invariance across Men from the General Population and IPVAW Offenders (Sample 4 and Clinical Sample) 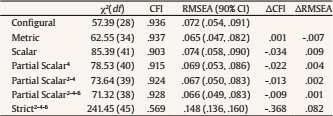 Note. χ2 = scaled chi-square; df = degrees of freedom; CFI = comparative fit index; RMSEA = root mean squared error of approximation; ΔCFI = change in the CFI; ΔRMSEA = change in the RMSEA. 4Intercept of item 4 freed across groups. 2-4Intercepts of items 2 and 4 freed across groups. 2-4-6Intercepts of items 2, 4, and 6 freed across groups. The latent means of both groups were thereafter freely estimated. The resulting model showed an acceptable fit (CFI = .94, TLI = .93, RMSEA [90% CI] = .064 [.045, .080], SRMR = .070), and we found that male participants from the general population presented a higher latent mean in the factor (i.e., perceived severity) than IPVAW offenders, Z = 0.456, SE = 0.109, p = .007. The density distributions of the factor scores in the PS-IPVAW of both groups are displayed in Figure 3. Although the distributions of both groups were centered around moderate levels of perceived severity, the factor scores of the male participants from the general sample presented a leptokurtic form, indicating that most of the participants were around moderate levels of perceived severity. The IPVAW offenders, on the other hand, were more scattered between low and moderate levels of perceived severity, presenting a higher density for negative factor scores on the scale, which in turn suggests that IPVAW offenders are more likely to be found among participants with low levels of perceived severity than men from the general sample. Figure 3 Factor Scores Distribution for Men from the General Population and IPVAW Offenders. 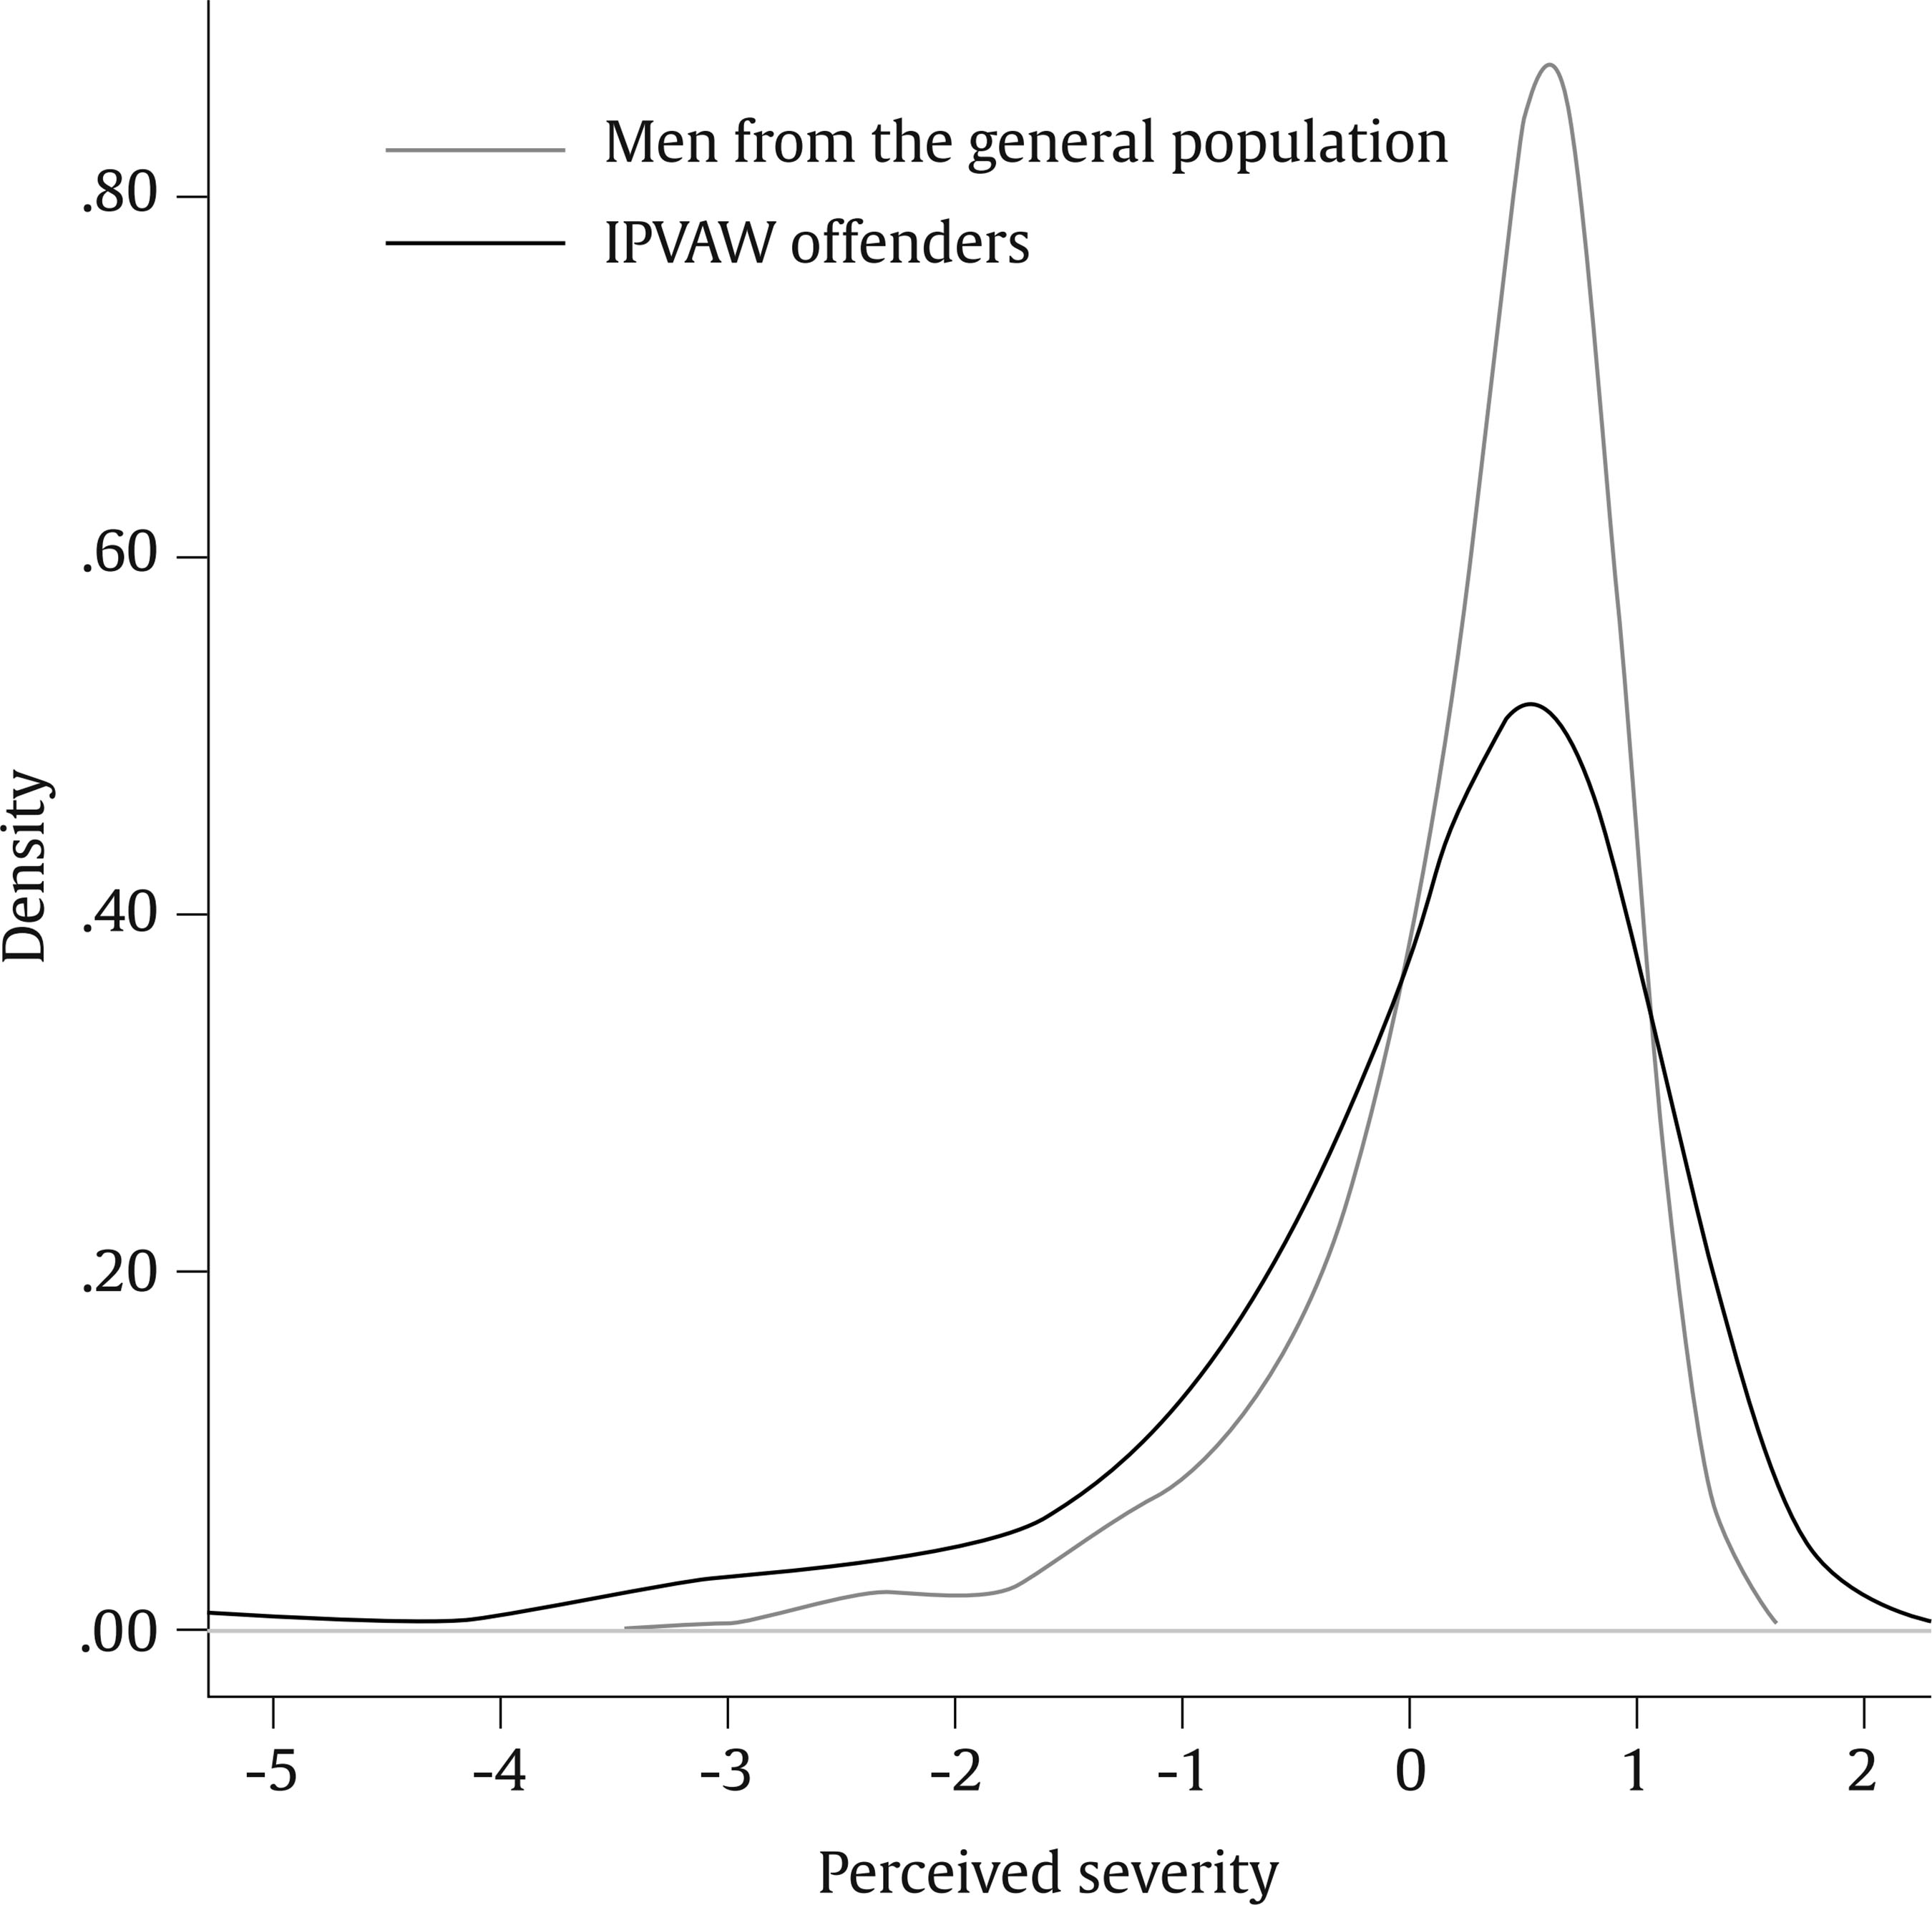 In this study we aimed to provide further validity evidence for the PS-IPVAW scale, an instrument widely used to assess perceived severity of IPVAW, by assessing its measurement invariance between gender and age groups, and between men from the general population and male IPVAW offenders. In line with previous research, our findings supported that the PS-IPVAW scale presented adequate psychometric properties to assess perceived severity of this type of violence. We found that the scale has a solid factorial structure and a good internal consistency across several samples from the general population. The IRT analyses allowed us to refine this measure by removing the least informative item from the original measure. We also found that this scale was invariant across gender and age groups, which in turn indicated that it could be used to make appropriate comparisons between men and women, and between individuals from different age groups, as they conceptualize and interpret perceived severity in a similar way (Putnick & Bornstein, 2016). Our results show that, on average, men presented lower levels of perceived severity than women, which is consistent with previous research (Webster et al., 2018). As for age, we found a similar U-trend as the one reported by Sánchez-Prada et al. (2020), where younger participants showed lower perceived severity levels than middle aged participants. Regarding the validity evidence based on the relations of the PS-IPVAW to other relevant constructs, our results are consistent with previous research linking perceived severity to attitudes of acceptability of IPVAW, attitudes of victim blaming, ambivalent sexism, and willingness to intervene in cases of IPVAW (Gracia et al., 2018; Lelaurain et al., 2021; Martín-Fernández, Gracia, & Lila., 2018; Martín-Fernández et al., 2021; Martín-Fernández, Gracia, Marco, et al., 2018). In particular, our findings show that participants with higher levels of perceived severity also tended to present lower levels of acceptability of IPVAW, victim-blaming attitudes, and hostile sexism, and showed higher levels of willingness to intervene in cases of this type of violence. The measurement invariance analysis comparing the item functioning of a sample of men from the general population with a clinical sample of IPVAW offenders constitutes one of the main strengths of this paper. This analysis showed that three intercepts of the items were substantially lower for IPVAW offenders, which in turn indicated that offenders tend to rate these items as less severe than men from the general population. This finding suggested that offenders may follow a different pattern when assessing the perceived severity of IPVAW scenarios. Intervention strategies addressing the perceived severity of IPVAW among this type of offenders could assess whether the item intercepts of the PS-IPVAW scale change across different time points during the intervention process, leading to a response shift phenomenon similar to other intervention programs (Krägeloh et al., 2018). This study has some limitations. First, the general population samples were collected through online sampling, which presents some tradeoffs: on the one hand, it is a cost-efficient way to gather a large pool of responses; on the other hand, it makes it difficult to verify the sociodemographic characteristics of the participants and to overcome possible self-selection bias, as participants who are more motivated by the aims and the topic of the study may be more willing to take part (Thornton et al., 2016; Topolovec-Vranic & Natarajan, 2016). Second, the cross-sectional study design prevented us from assessing how individuals’ levels of perceived severity might change over time. Third, although the PS-IPVAW is especially informative for individuals with low and moderate levels of perceived severity, the precision of this measure is lower for individuals with high and very high levels on this construct. Finally, the study was conducted in Spain, one of the European Union countries with the lowest rates of IPVAW (Gracia & Merlo, 2016; Martín-Fernández et al., 2019, 2020; Vives-Cases et al., 2011), highlighting the need for more research to examine the psychometric properties of the PS-IPVAW in other socio-cultural contexts. Perceived severity is a key variable that can lead to a better understanding of intimate partner violence, as it is closely related to its acceptability, personal sense of responsibility, attitudes toward intervention, and public and professional responses to IPVAW (Baldry & Pagliaro, 2014; Gracia et al., 2011; Gracia et al., 2018; Hyman et al., 2009; Lelaurain et al., 2018). The availability of psychometrically sound measures to assess perceived severity is an important step for researchers and practitioners, as it would allow them to make precise and valid evaluations of this construct. The PS-IPVAW can be useful to assess perceived severity at individual level in the general population in large-scale studies where time and space can be an issue, such as demographic surveys (Gracia et al., 2018; Martín-Fernández et al., 2021). It could also be used to monitor attitudes and attitudinal change as a result of IPVAW education or awareness campaigns (Gracia et al., 2020). This instrument can also be useful for high-risk populations, such as IPVAW offenders, either as a screening tool or to study the efficacy of prevention and intervention strategies targeted to these individuals (Bowen et al., 2008; Cunha & Gonçalves, 2015; Santirso et al., 2020). In sum, the PS-IPVAW scale could potentially fill this gap in the literature, as it is able to yield accurate assessments of perceived severity of this type of violence among the general population and among IPVAW offenders. Conflict of Interest The authors of this article declare no conflict of interest. Funding: This study has been supported by FEDER/Spanish Ministry of Science, Innovation, and Universities – State Research Agency (PSI2017-84764-P) and by the program of stimuli for young researchers of the Autonomous Community of Madrid (SI3/PJI/2021-00195). Cite this article as: Martín-Fernández, M., Gracia, E., & Lila, M. (2022). Measuring perceived severity of intimate partner violence against women (IPVAW) among the general population and IPVAW offenders. Anuario de Psicología Jurídica. Avance online. https://doi.org/10.5093/pi2022a8 Referencias Appendix PS-IPVAW Scale Below are seven scenarios that can occur between a male-female couple. On a scale from 0 to 10, please indicate how serious these scenarios seem to you (the higher the number, the higher the severity of the scenario). [A continuación se describen siete situaciones que pueden ocurrir entre una pareja de hombre y mujer. Indica en una escala de 0 a 10 hasta qué punto esas situaciones te parecen graves: a mayor número, mayor gravedad]1.  Note. 1In brackets the original instructions and items in Spanish. |
Cite this article as: Martín-Fernández, M., Gracia, E., & Lila, M. (2022). Measuring Perceived Severity of Intimate Partner Violence against Women (IPVAW) among the General Population and IPVAW Offenders. Psychosocial Intervention, 31(2), 109 - 119. https://doi.org/10.5093/pi2022a8
manuel.martinfernandez@uam.es Correspondencia: manuel.martinfernandez@uam.es (M. Mart├şn-Fern├índez).Copyright © 2026. Colegio Oficial de la Psicología de Madrid


 PDF
PDF e-PUB
e-PUB CrossRef
 JATS
JATS Print
Print Send
Send