


Attitudes towards School Violence Questionnaire, Revised Version: CAHV-28
[Cuestionario de Actitudes hacia la Violencia Escolar, versi├│n revisada: CAHV-28]
José A. Ruiz-Hernández, David Pina, Esteban Puente-López, Aurelio Luna-Maldonado, and Bartolomé Llor-Esteban
University of Murcia, Spain
https://doi.org/10.5093/ejpalc2020a8
Received 28 October 2019, Accepted 9 April 2020
Abstract
School coexistence/violence is often the subject of social alarm. There is no consensus on the prevalence of violent behavior in the classroom, but there does seem to be about its differences according to sex, socioeconomic level, or the importance of preventive interventions for its reduction. Models consider attitudes towards violence as an indicator of risk for its expression. The objectives of this study are to explore the psychometric properties of the revised version of Cuestionario de Actitudes Hacia la Violencia [Attitudes towards Violence Questionnaire] (CAHV-25) in primary and secondary education students, proposing a version of four scales and a total of 28 items, along with the exploration of their significance as a function of sex and academic cycle. A qualitative review of CAHV-25 and a psychometric study of the revised version in each of its original dimensions was carried out, obtaining the fit indicators of exploratory and confirmatory factor analysis. In addition, the scale was studied as a function of sex and educational stage se in school children (N = 600) of the Region of Murcia (Spain). The four dimensions show better psychometric properties in their revised version. Attitudes towards violence are more present in males and in secondary school. As conclusions, the proposed version optimizes the detection of attitudes towards violence in schoolchildren and suggests more specific school violence prevention programs.
Resumen
La convivencia/violencia escolar, a menudo, es objeto de alarma social. No parece existir consenso en la prevalencia de conductas violentas en las aulas, pero sí en sus diferencias según sexo, nivel socioeconómico o la importancia de las intervenciones preventivas para su disminución. Los modelos sitúan a las actitudes hacia la violencia como un indicador de riesgo para la manifestación de dichas conductas. Los objetivos del presente estudio son explorar las propiedades psicométricas de la versión ampliada del Cuestionario de Actitudes Hacia la Violencia (CAHV-25) en alumnos de Educación Primaria y Secundaria, proponiendo una versión dividida en cuatro escalas y 28 ítems en total, junto a la exploración de la significación según sexo y etapa académica. Se ha llevado a cabo una revisión cualitativa del cuestionario CAHV-25 y se realizó un estudio psicométrico de la misma para cada una de sus dimensiones originales obteniendo los indicadores de ajuste de Análisis Factorial Exploratorio y Confirmatorio en menores de Educación Primaria y Secundaria (N = 600) de la Región de Murcia (España). Los resultados indican que las cuatro dimensiones tienen mejores propiedades psicométricas en su versión revisada. Las actitudes hacia la violencia son mayores en varones y en Secundaria. Se concluye que la versión propuesta permite maximizar la detección de actitudes hacia la violencia en menores escolarizados, sirviendo de base para el planteamiento de posibles programas de prevención de violencia escolar más específicos.
Keywords
Violence, Children, Adolescents, Attitudes, ScalePalabras clave
Violencia, Ni├▒os, Adolescentes, Actitudes, EscalaCite this article as: Ruiz-Hernández, J. A., Pina, D., Puente-López, E., Luna-Maldonado, A., & Llor-Esteban, B. (2020). Attitudes towards School Violence Questionnaire, Revised Version: CAHV-28. The European Journal of Psychology Applied to Legal Context, 12(2), 61 - 68. https://doi.org/10.5093/ejpalc2020a8
David.pina@um.es Correspondence: David.pina@um.es (D. Pina)School violence is a phenomenon of great social interest, and also for applied psychology and research. Studies carried out by Heinemann (1972) and Olweus (1993) are among the most relevant antecedents, from which Olweus’ conceptualization of bullying derives, referring to oppressive behaviors, regardless of their nature, that are carried out by peers in the educational context, with the aim of subjecting and/or controlling another peer, and which may produce physical, psychological, or social harm. This phenomenon requires intentionality, an imbalance of power between aggressor and victim, and recurrence of these behaviors over time. The current concept hardly differs from early definitions, considering bullying or harassment as behaviors that can cause physical or emotional harm, and that may manifest as verbal aggression, humiliation, social exclusion, physical harm, or destruction of property, among others. It also includes several categories, such as disruption in the classroom, disciplinary problems, and peer abuse (Jiménez-Barbero, Ruiz-Hernández, Llor-Zaragoza, et al., 2016; Modecki et al., 2014; Sentse et al., 2017). The importance of the phenomenon derives from the consequences it produces: anxious-depressive syndromes, behavioral disorders, academic performance problems, risk of social exclusion, or suicidal behavior, among others (Bauman et al., 2017; Kowalski & Limber, 2013; Lereya et al., 2015). Studies addressing the prevalence of school violence in many countries indicate figures ranging from 20% to 30%, although other research calculates exposure to these behaviors at around 50% (Craig et al., 2009; Leff & Feudtner, 2017). In Spain, a prevalence of violent behaviors ranging from 10.2% to 19.6% has been found (Zych et al., 2017). Recently, within the socio-cultural context of this study, the highest rate of bullying cases at national level was found in Spain, with a percentage of 13.8%, thereby ranking by extension as one of the first regions of Europe (Calmaestra et al., 2016). Recently, UNESCO (2019) has stated that at least 32% of children worldwide have been exposed to violence. However, these studies should be interpreted with caution, as percentages depend on the concept of bullying used, as well as on the use of non-representative samples. Multiple factors related to school violence (social, family, school, personal, parent-related, etc.) have been found (Álvarez-García et al., 2018; Gallego et al., 2019; Jiménez & Estévez, 2017; Jiménez-Barbero, Ruiz-Hernández, Llor-Esteban, et al., 2016; Jiménez-Barbero, Ruiz-Hernández, Llor-Zaragoza et al., 2016; López-Ossorio et al., 2017; Ruiz-Hernández et al., 2019; Waasdorp et al., 2017). This paper draws on the theoretical models proposed by Brown et al. (2011) and Fazio (1990), suggesting the importance of attitudes, considered as a predisposition to act mainly when behaving non-deliberately, thus maximizing attitude-behavior connection. In the context of school violence, this relationship could be considered the tendency toward aggressive behaviors whether or not influenced by the presence of such attitudes, which can sometimes reach extreme violence (Jiménez-Barbero, Ruiz-Hernández, Llor-Zaragoza et al., 2016; Mulvey & Cauffman, 2001; Ruiz-Hernández et al., 2009). Therefore, the correct evaluation and intervention in attitudes towards violence can be an objective for improving school coexistence. Assessment of Attitudinal Beliefs towards Violence Many instruments assess attitudes towards violence. Among the main contributions, we find Bandura’s (1973) proposal of group evaluation through 6 items. Also noteworthy is Thornberry et al. (1994) Delinquent Beliefs – Rochester Youth Development Study and Loeber et al. (1988) Attitude toward Delinquency – Pittsburgh Youth, which aims to evaluate adolescents’ attitudes towards more extreme or criminal behaviors. Despite this variety of instruments, there seems to be a problem concerning the methodology proposed for the evaluation of attitudes. Since the studies by Azjen and Fishbein (1977) on the assessment of the attitude-behavioral relationship, the importance of assessing attitudes towards predicted behaviors at the same level of specificity has been highlighted. As an example, to evaluate the use of violence in peer relationships in the school context it is necessary to formulate items that measure specific behaviors, thoughts, or emotions about this type of situation. In this regard, there appears to be a lack of adequacy of these instruments for the assessment of attitudes in the school context (except for Bandura’s proposal), as the instruments tend to address extreme or criminal behaviors more than behaviors occurring in the school setting during children’s daily coexistence. On the other hand, more current proposals address attitudes taking into account this perspective, such as the suggestions by Garland et al. (2017), McConville and Cornell (2003), or Mills et al. (2002). Despite achieving moderately high consistency and exploring the behavior-attitude relationship more specifically, their instruments use a very small number of items and a single dimension, making it difficult to interpret the results. Other questionnaires of similar characteristics to those mentioned can be found in the compendium by Dahlberg et al. (2005). In an effort to address these points of improvement, along with the appropriate contextualization to the Spanish population, in this study we will focus on the Attitudes towards Violence Questionnaire (CAHV-25; Ruiz-Hernández et al., 2009), which takes into account specific attitudes, and therefore specific behaviors, in its four original factors (attitudes towards violence as a way to have fun, attitudes towards violence as a way to increase self-esteem, attitudes towards violence as a way of relating and solving problems, and attitudes towards violence perceived as legitimate). The questionnaire is part of an extensive development derived from preventive practice, as the main axis of Count on Me program, designed to modify attitudes towards violence and improve school coexistence (Jiménez-Barbero et al., 2013; Ruiz-Hernández et al., 2009). This questionnaire has been applied in multiple contexts and translated into other languages, mainly finding more attitudes towards violence in adolescents and in boys than in girls. In clinical population, a strong relationship has been found between attitudes, verbal aggression, and externalizing behavior disorder (Jiménez-Barbero, Ruiz-Hernández, Velandrino-Nicolás et al., 2016; Santander, 2016, 2018; Serrano-Patten et al., 2018; Vasconcelos et al., 2017). Some aspects of the CAHV-25 are improvable for improvement, such as the original internal consistency, that was not very high. These aspects include the use of reversed items in children’s population, which can lead to confusion, response bias, and lack of robust indicators of factor analysis (Ruiz-Hernández et al., 2009). Performing adaptations so that each dimension can be used individually would also lead to a more versatile revised instrument. Study Aims The evidence presented so far indicates that school violence and, specifically, attitudes as a predictive variable, is complex. In this sense, we propose generating a tool with appropriate psychometric properties that can be used in multiple contexts, from research to the evaluation of the effectiveness of intervention programs. We established two main objectives. First, to qualitatively and quantitatively review the original dimensions of CAHV-25, subjecting the original four-factor structure to an individualized factor analysis, and secondly, we will determine the significance of the scales obtained as a function of sex and academic cycle. This study followed a dual-strategy research design. On the one hand, a psychometric study was carried out that aims to explore in depth the scales’ properties. On the other hand, a descriptive-comparative cross-sectional study with natural groups was developed (Ato et al., 2013). Participants The sample consists of 823 children aged between 10 and 17 years (M = 14.38, SD = 1.85), belonging to 10 schools in the Region of Murcia, Primary Education 4th year and Secondary Education 2nd year, randomly selected by Murcia Region’s Observatory of Coexistence. After analyzing data, particularly controlling for social desirability, 223 participants were removed, making up a final sample of 600 children, of whom 296 were boys (49.3%) and 304 girls (50.7%). Concerning academic level, 77% of the sample were Secondary Education students. Regarding sociodemographic variables (Table 1), the most common academic grade is “notable” (37.8%) followed by “passed” (32.5%). Parents’ training level was similar – 49.4% with no studies and 44.4% with basic studies (school graduate) – and regarding family structure, the students mainly lived with both parents (79.7%). Table 1 Overview of Sociodemographic and Socioeducational Variables 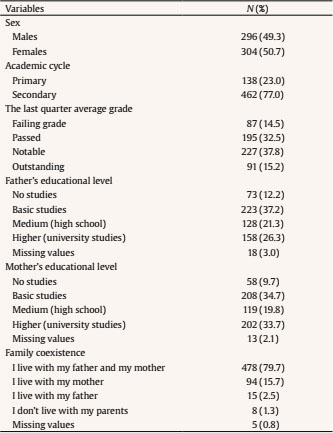 Instruments We applied a protocol containing a total of 65 items that included sociodemographic variables (sex, academic cycle, the last quarter average grade, father’s educational level, mother’s educational level, and family coexistence), CAHV-25 with the proposed modifications, along with the variables described below, as well as a self-reported question on sincerity. Indicators of school violence. Sixteen items were included that collected frequency (1 = never, 5 = daily) of common violent behaviors at school grouped into five categories (physical, verbal, social, material, and technological) according to the meta-analysis by Jiménez-Barbero, Ruiz-Hernández, Llor-Zaragoza, et al. (2016) and the recommendations of the legal regulations of the Region of Murcia (Resolution on April 4, 2006, published in BORM). Examples of these items are: “I push him/her”, “I hit him/her”, “I insult him/her”, “I hide or remove his/her things” or “I spread rumors or lies about him/her”, among others. Social Desirability Subscale of Child and Adolescent Self-Control Questionnaire (CACIA; Capafons and Silva, 1985). This social desirability subscale was used as an indicator of response validity of the protocol, consisting of 14 items with a Cronbach coefficient of α = .63 (Capafons & Silva, 1998). In this study we obtained a value of α = .65. In addition, a self-reported sincerity question was included to extend the study and avoid children’s tendency to give a socially desirable response as far as possible (Miller et al., 2015). Response levels ranged from totally sincere to I’ve lied a lot. Procedure CAHV-25 is part of the evaluation protocol of Count on Me program, from its onset in 2013 (Jiménez-Barbero et al., 2013). The need for the amendments proposed in this study stems from previous studies (Jiménez-Barbero, Ruiz-Hernández, Llor-Zaragoza, et al., 2016). As mentioned above, in this work we modified the two reverse items that misled the children. In addition, the original 45 items of the scale from these previous works were re-analyzed (Ruiz-Hernández et al., 2009). Once the protocol was developed, including the amendments to items of the CAHV-25, it was applied to a sample of 10 schools and a total of 36 classes (14 students of Primary Education 4th year and 22 students of compulsory Secondary Education 2nd year) of the Region of Murcia (southeastern Spain) in the academic year 2016/2017. The selection of schools was carried out by the Observatory of School Co-Existence, which depends on the Region of Murcia’s Head of Education. Taking social demand into account, this organism suggested the implementation of this program in the schools, randomly selected by this agency among all available schools. Participants were provided with an informed consent to be delivered to their families. Subsequently, an initial interview was conducted with directors, heads of studies, and associations of mothers and fathers of centers chosen. After this, a full-information session of the program was held, and evaluation questionnaires were presented to children’s parents. Before protocol implementation, students were informed of the general aspects of the study and the voluntary and anonymous nature of their participation. Emphasis was placed on the importance of sincerity and of not interacting with other classmates when completing the questionnaires. Data collection took place between January and April 2017 during tutoring hours, and interviewers and classrooms’ tutors were present throughout the process. To avoid the tendency to respond randomly, as well as the distortion of the response itself, the scores on the social desirability questionnaire that were + 1SD below group mean, and the explicit recognition of sincerity in the final self-reported question of the questionnaire were used as inclusion criteria. Cases that did not meet these criteria and/or had not completed the entire protocol were excluded. For the development of this study, we considered the ethical considerations proposed by the American Psychological Association (2002, 2010) and the favorable report of the Ethical Research Commission of the University of Murcia (ID: 2317/2019). Data Analysis For psychometric fit, we followed the methodology proposed by Brown (2014). A factor analysis was performed with Factor 10.8 program. (Lorenzo-Seva & Ferrando, 2007), as it provides fit statistics for exploratory factor analysis (EFA) and confirmatory factor analysis (CFA) of each of the prior scales, together with the modification and inclusion of items. Polychoric correlations were applied, using the unweighted least squares method. Parallel analysis (PA) was used for factor selection, after a one-dimensional exploration of the scales. Kaiser-Meyer-Olkin (KMO) and Bartlett’s sphericity statistics were used as criteria for the definition of dimensionality in the EFA. Also, statistics based on root mean square error of approximation (RMSEA) and root mean square residual (RMRS) were calculated, and the structure was explored with CFA, using comparative fit index (CFI) and non-normalized fit index (NNFI). Further, goodness of fit index (GFI) and adjusted goodness of fit index (AGFI) were explored. Cronbach alpha values were also calculated. Table 2 Fit Statistics (N = 600) 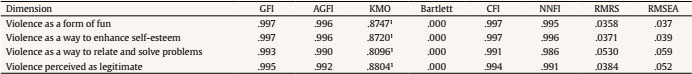 Note. 1Value within the confidence interval. For item selection, items with factorial loadings higher than .40 and items not loading simultaneously higher than .30 on two or more factors were incorporated. Regarding dimensionality, values within recommended KMO range and a significant Bartlett sphericity statistic were established as selection criteria. Each factor had to contain at least 4 items, whose GFI and AGFI values were greater than .95, and whose CFI and NNFI values had to be greater than .90, and RMSEA and SRMR statistics had to be less than .08. After structure and psychometric properties of the scales were studied, and in order to explore the predictive capacity of attitudes towards violence in violent behaviors, a ROC curve analysis was carried out to determine the cutting points with greater sensitivity and specificity. The study of sensitivity and specificity took into account the part of the sample whose score in School Violence Indicators was at the extremes of the distribution (non-violent group and high violence group). As the sample did not meet the assumptions of variance homogeneity and normality in the distribution, Mann-Whitney’s U-statistics were used to compare the means between two factors with two levels, sex and academic cycle. Besides, to quantify the magnitude of effect size, the probability of superiority of effect size (PSES) was estimated. PSES was used because it has demonstrated its practical utility (Fariña et al., 2017; Monteiro et al., 2018). These analyses were performed with SPSS (Statistical Package for Social Sciences) version 22. Structure of the Factor Analysis Concerning the first objective, individual EFA was applied to each of the four scales, using the unweighted least squares method with normalized Varimax rotation, to explore the possible multidimensionality of the original four factors. The analysis (Tables 2 through 6) indicated for each of the scales that factor structure had an adequate fit for a single dimension. Following these indications, multidimensional analysis was discarded. Finally, a single dimension was extracted for each of the scales, with a total of 28 items of the proposed items (the original 23 items, plus 2 reworded items and 3 new items). A dimension was obtained for each of the four scales, with the following characteristics: Table 3 Summary of Items of Scale I: Violence as a Form of Fun (N = 600, α = .807, 59.04% explained variance) 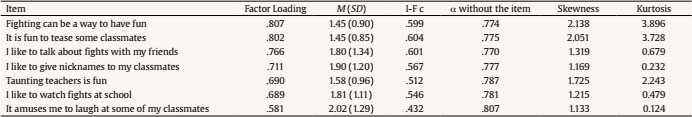 Note. M = mean; SD = standard deviation; I-F c = item-factor correlation; α without the item = corrected alpha when deleting the item. Table 4 Summary of Items of Scale II: Violence as a Way to Enhance Self-esteem (N = 600, α = .819, 65.4% explained variance)  Note. M = Mean, SD = Standard deviation, I-F c = Item-factor correlation, α without the item = corrected alpha when deleting the item. Table 5 Summary of Items of Scale III: Violence as a Way to Relate and Solve Problems (n = 600, α = .758, 56.41% explained variance) 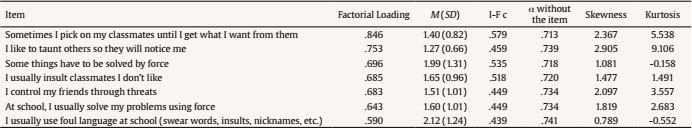 Note. M = mean; SD = standard deviation; I-F c = item-factor correlation, α without the item = corrected alpha when deleting the item Table 6 Summary of Items of Scale IV: Violence Perceived as Legitimate (N = 600, α = .834, 59.95% explained variance) 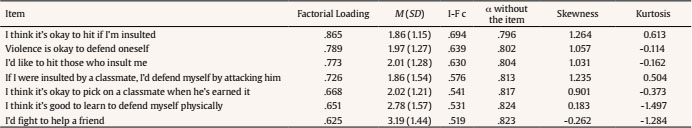 Note. M = mean; SD = standard deviation; I-F c = item-factor correlation, α without the item = corrected alpha when deleting the item. Scale I: Violence as a form of fun (KMO = .87, 95% CI [0.86, 0.89]; Bartlett’s sphericity test 3 = 1,118.9, p < .0001) with 7 items related to the instrumental use of violence as a form of leisure and/or fun, explaining 59.04% of variance (α = .807). Scale II: Violence as a way to enhance self-esteem (KMO = .87, 95% CI [0.86, 0.89]; Bartlett’s sphericity test 3 = 1,200.1, p < .0001), which consists of 7 elements related to the use of violence in order to feel better about oneself, accounting for 65.4% of variance (α = .819). Scale III: Violence as a way to relate and solve problems (KMO = .81, 95% CI [0.78, 0.85]; Bartlett’s sphericity test 3 = 912.0, p < .0001), composed of 7 items that refer to the use of violence to deal with others and solve problems in a group setting, explaining 56.41% of variance (α =.758). Scale IV: Violence perceived as legitimate (KMO = .88, 95% CI [0.87, 0.90]; Bartlett’s sphericity test 3 = 1,372.7, p < .0001), consisting of 7 elements that relate to the perception of the use of violence in situations perceived as justified, explaining 59.95% of variance (α = .834). Analysis of Cut-off Points of the Scales As the final phase of psychometric analysis, criteria and cut-off points were established. The cut-off points that allow the scale to be interpreted were determined by ROC curve analysis and the percentiles (Tables 7 and 8). This analysis yielded areas of .944, .875, .933, .912 for dimensions I, II, II, and IV, respectively. Each scale has a different cut-off point, which is higher for the Violence perceived as Legitimate dimension (19.5) followed by dimensions related to Violence as a Form of Fun and Violence as a Form of Relationship and Problem Solving (14.5 and 14.5) and, finally, Violence as a Way to Enhance Self-esteem (10.5). Regarding gender, cut-off points were consistently higher in boys than in girls, whereas in the academic cycle, cut-off points were higher in secondary education than in primary education. Table 7 Cut-off Points and Results of ROC Curves of the 4 Dimensions 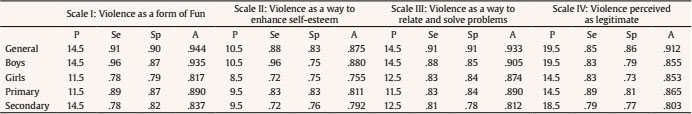 Note. P = cut-off point; Se = sensitivity; Sp = specificity; A = area. Table 8 Comparison of Means in Sex and Academic Cycle 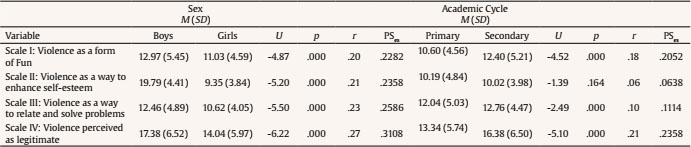 Descriptive Statistics and Internal Consistency Regarding the relationship between the scales and sex, high scores were found in boys, especially in the dimension of violence used to enhance self-esteem (dimension I, U = -4.87, p < .00, r = .20; dimension II, U = -5.20, p < .00, r = .21; dimension III, U = -4.98, p < .00, r = .23; dimension IV, U = -4.869, p < .00, r = .27). Regarding educational cycle, attitudes towards violence were higher in secondary education in all cases (dimension I, U = -4.52, p < .00, r = .18; dimension III, U = -3.50, p < .00, r = .06; dimension IV, U = -5.10, p < .00, r = .10), except for dimension II (U = -1.39, p < .03, r = .21). The magnitude of effect size was over 22% of all possible effect size results based on sex in all dimensions, highlighting dimension IV, where it was 31.08%. In academic cycle, dimensions I and II stood out at 20.52% and 23.58% respectively, whereas dimensions II and III contributed lower values (6.38% and 11.14% ) (Table 8). The development of this study allowed us to expand CAHV-25 to a version that is easy to apply and adapt it to child-juvenile population, modifying the original version with the inclusion of 5 items (2 reworded items and 3 new ones), CAHV-28. EFA produced results that support the one-dimensionality of each of the scales. The four dimensions match the original structure proposed by the authors (Ruiz-Hernández et al., 2009) but with a greater number of total items, which increases the amount of information extracted from its application. Regarding the significance of the scales, we observed that the prevalence of school violence varies considerably depending on the type of indicators that are used to study the phenomenon. Coinciding with various studies, we find that indicators of violence as a way to relate, enhancing self-esteem, or having fun are frequent, with an apparent predisposition based on a more affective or emotional facet, and not so instrumental (Crapanzano et al., 2010; Stevens et al., 2000). Classical studies such as Beynon’s (1989) suggest a link between school violence and social rules and hierarchies, that is, violence assumed as legitimate, which would be used to impose one’s will on others. Similarly, the increase in attitudes related to dimension II (violence to enhance self-esteem) would also reflect the concepts defended in other studies that consider it a component to maintain one’s positive image and well-being (Fein & Spencer, 1997; Taylor et al., 2007). Some studies find differences in the frequency of violent behaviors as a function of sex. Same results have been found in attitudes towards violence, which would strengthen the connection between the two variables. Similarly, concerning age, a higher frequency of attitudes towards reported violence in secondary school students was obtained, as is the case with violent behaviors themselves (UNESCO, 2019). These results suggest different areas of intervention from the perspective of attitudes, and it would be interesting to work on the possible modification of attitudes before reaching these critical ages, and thus avoid the typical peak in high school students. However, it may not be advisable to focus efforts exclusively on male population, as our results seem to indicate, because, although there are differences, it is a phenomenon that occurs in both sexes. Therefore, this phenomenon is just as important from the perspective of improving school coexistence (Fundación ANAR, 2018; Jiménez-Barbero et al., 2013; Kowalski & Limber, 2013; Modecki et al., 2014). Research, Clinical and Policy Implications Taking the studies reviewed by Torregrosa et al. (2011) into account, we consider that the internal consistency of the four resulting scales in our study is above the average of questionnaires evaluating similar or related constructs. Likewise, obtaining cut-off points can promote interpretation of attitudes towards violence and thus be useful in the assessment of school coexistence. We remind readers that the high relationship between the scales obtained would allow us to use any of them as a screening element, to be complemented later on, if required, with the rest of the scales. In conclusion, the compendium of the scales that make up CAHV-28 can be used in the assessment of attitudes towards violence, and these, in turn, can become a fundamental axis in preventive interventions. The full or partial use of the scales also allows a cost-benefit ratio, pursuing simplicity in the format, easy handling, and more application possibilities, which would complement the overall interpretation of the scales, facilitating our understanding of attitude-behavior relationship with the support of cut-off points. The main objective of this study was the development of four scales that would allow a specific approach to the attitude-behavior relationship, as well as improving the psychometric properties of the scale’s predecessor, CAHV-25. We note that our results should be interpreted according to the following limitations. The study presented the typical limitations of response trend. An attempt was made to resolve this situation with the above measures of sincerity and social desirability. Still, in the case of a complex and difficult topic, it would be interesting to work on strategies that could solve it from another perspective, because in our case 223 subjects were discarded, which could imply a bias in the results. Likewise, the design does not allow making inferences beyond relationships and associations, so replication in other populations, at different moments or continued over time, could differ from those presented herein. Finally, it would be appropriate to explore the behavior of the scale from other psychometric models, such as TRI or Rasch models. Conflict of Interest The authors of this article declare no conflict of interest. Cite this article as: Ruiz-Hernández, J. A., Pina, D., Puente-López, E., Luna-Maldonado, A., & Llor-Esteban, B. (2020). Attitudes towards school violence questionnaire, revised version: CAHV-28. The European Journal of Psychology Applied to Legal Context, 12(2), 61-68.https://doi.org/10.5093/ejpalc2020a8 Funding: This project was funded by the Applied Psychology Service of the University of Murcia. References Appendix Questionnaire CAHV-28 (Attitudes towards Violence Questionnaire - CAHV-28 - Cuestionario de Actitudes hacia la Violencia Escolar - CAHV-28) A continuación, encontrarás una serie de enunciados sobre lo que los chicos y chicas piensan, sienten o hacen en el centro escolar. Ten en cuenta que no hay enunciados buenos, ni malos, ni correctos o incorrectos, sólo nos interesa tu opinión sincera. Trata de responder indicando tu grado de acuerdo con el enunciado utilizando la siguiente escala: [Below, you will find a series of statements about what boys and girls think, feel or do in the school. Keep in mind that there are no good, bad, or correct or incorrect answers, we are only interested in your honest opinion. Try to respond by indicating your degree of agreement with the statement using the following scale]: 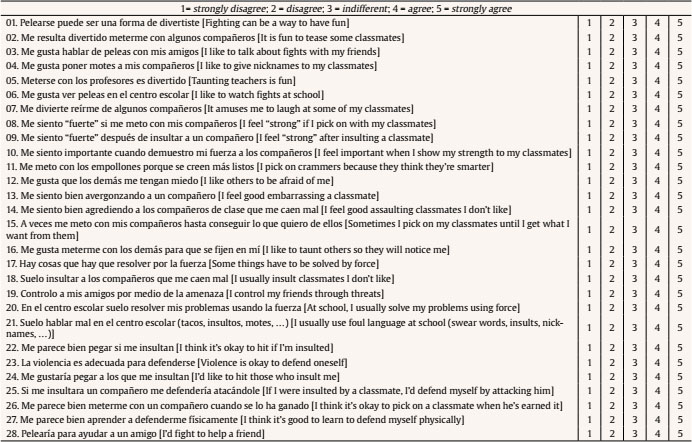 Note. * The authors of this study reserve the rights to use and distribute the questionnaire. If you are interested in your application, please contact them. **The translation of the questionare have been done using a reverse translation procedure. |
Cite this article as: Ruiz-Hernández, J. A., Pina, D., Puente-López, E., Luna-Maldonado, A., & Llor-Esteban, B. (2020). Attitudes towards School Violence Questionnaire, Revised Version: CAHV-28. The European Journal of Psychology Applied to Legal Context, 12(2), 61 - 68. https://doi.org/10.5093/ejpalc2020a8
David.pina@um.es Correspondence: David.pina@um.es (D. Pina)Copyright © 2026. Colegio Oficial de la Psicología de Madrid


 PDF
PDF e-PUB
e-PUB CrossRef
 JATS
JATS Print
Print Send
SendEMAIL ALERT
The European Journal of Psychology Applied to Legal Context is licensed under a Creative Commons Attribution-NonCommercial-NoDerivatives 4.0 International License


