
Development and Psychometric Analysis of the Sense of Community Descriptors Scale
[Desarrollo y análisis psicométrico de la escala de descriptores del sentido de comunidad (Sense of Community Descriptors Scale)]
Júlia Halamováa, Martin Kanovskýa, and Eva Naništováb
aComenius University in Bratislava, Bratislava, Slovakia; bPan-European University, Bratislava, Slovakia
https://doi.org/10.5093/pi2018a8
Received 12 July 2017, Accepted 15 December 2017
Abstract
The authors report the development and robust evaluation of the psychometric properties of the Sense of Community Descriptors Scale, which, as one of the few scales that measures the psychological sense of community regardless of context, can be utilized in all kinds of communities for assessing community intervention effectiveness. The Sense of Community Descriptors Scale uses a semi-projective method in the form of a semantic differential. Contrary to the majority of sense of community measures stemming from the theory of McMillan and Chavis, the Sense of Community Descriptors Scale is based on Peck’s theory. It measures the sense of community in a real and ideal community. The degree of differences between them is then used to determine the level of satisfaction. The reliability of the scale was high, and its convergent validity was supported by the correlation of the Perceived Sense of Community Scale and the Brief Sense of Community Scale. Factor analysis showed three dimensions (Acceptance, Dynamics, and Openness). The Sense of Community Descriptors Scale is a reliable and valid instrument for measuring the level of psychological sense of community beyond the specific context of such community and in various multilayer communities.
Resumen
Los autores reportan el desarrollo y evaluación de la escala de descriptores del sentido de comunidad (Sense of Community Descriptors Scale). Esta escala mide el sentido de comunidad independientemente del contexto, y puede utilizarse en todo tipo de comunidad para evaluar la efectividad de las intervenciones comunitarias. La escala de descriptores del sentido de comunidad utiliza un método semiproyectivo en forma de diferencial semántico. Al contrario que la mayoría de medidas del sentido de comunidad basadas en la teoría de McMillan y Chavis, esta escala se basa en la teoría de Peck. La escala mide el sentido de comunidad en una comunidad real y en una comunidad ideal. Las diferencias entre estas dos comunidades se emplean para determinar el nivel de satisfacción. La fiabilidad de la escala es elevada, y su validez convergente se apoya en la correlación con las escalas de Perceived Sense of Community Scale y la Brief Sense of Community Scale. El análisis factorial muestra tres dimensiones (Aceptación, Dinámica y Transparencia). Éste es un instrumento fiable y válido para medir el sentido de comunidad, más allá de su contexto específico.
Keywords
Community, Community psychology, Factor analysis, Psychological sense of community, Psychometric analysis.
Palabras clave
Comunidad, Psicología Comunitaria, Análisis factorial, Sentido de comunidad, Análisis psicométrico.
Funding: The authors appreciate the financial support from VEGA 1/0578/15. Correspondence: julia.halamova@gmail.com (J. Halamová).
Introduction
Sense of community is associated with a significant number of positive consequences for individuals and communities as well as society. Therefore, it has become a concept of increasing interest in recent decades. Some authors (Townley & Kloos, 2009) even consider it to be one of the most commonly investigated constructs in community psychology. For a deeper examination of the phenomenon, it is necessary to have sensitive and precise instruments for measuring sense of community within a community. Despite the relatively large number of instruments measuring the psychological sense of community nowadays, most draw on the theory of McMillan and Chavis (1986) or are not based on any theory at all. Furthermore, most are generated for a particular community context, which makes it difficult to examine various kinds of communities at once (e.g., multilayer communities), or to assess and compare community intervention effectiveness. Only a few instruments, such as the Perceived Sense of Community Scale (Bishop, Chertok, & Jason, 1997) and the Psychological Sense of Community Scale (Jason, Stevens, & Ram, 2015) are designed to be applied to any community. The Sense of Community Descriptors Scale - SCD (Sadovská & Naništová, 2000) combines both features; it is not only designed to be used in any community but also draws on Peck’s theory (1987). Furthermore, the SCD is based on a semi-projective method, while most of the existing sense of community instruments are self-rating scales and therefore susceptible to bias due to social desirability. Peck’s Communities and Sense of Community Several authors (e.g. Jason & Kobayashi, 1995; Sarason, 1974) point out that our postmodern society is being confronted with a breakdown in the sense of community. However, there are all sorts of initiatives; self-help groups, for example, in which people meet to re-establish that sense. Peck (1987, 1994) created a model to show groups how to enhance their sense of community. The model is used in a variety of groups all over the world. The underlying assumption in using the model is that the greater the sense of community, the better the climate for personal learning and effective cooperation, as well as for better performance (Peck, 1994). A community in Peck´ s model (Hampton, 2015, p. 1) is defined as: “...a group of two or more people who have been able to accept and transcend their differences, regardless of the diversity of their backgrounds... This enables them to communicate effectively and openly and to work together toward goals identified as being for their common good. The word community can refer to a specific group of people, or it can describe a quality of relationship based on certain values and principles.” Peck (1987, p. 59) does not specifically define sense of community; he proposes that it happens when a group of people becomes a community under specific conditions in which its members: “...have learned how to communicate honestly with each other, whose relationships go deeper than their masks of composure, and who have developed some significant commitment to 'rejoice together, mourn together', and to 'delight in each other, make others’ conditions our own'." As a result of this communication, there is a deep sense of connectedness, unity and belonging between people, which some of them describe as a sense of community (Halamová, 2014). According to Peck’s theory (1987, 1994), the community develops according to the following phases: pseudo-community, chaos, emptiness and community. The development of a group, according to Tuckman (1965), is characterized by the following stages: forming, storming, norming and performing. Upon close inspection, the first two phases of both theories are the same. The fundamental difference in the development of a community and a group, however, is the crucial third phase of emptiness and norming (Mirvis, 1997). For Tuckman in this third phase, the group organizes its structure, consolidates relations, and shapes its standards, statuses, and positions. In the community-building model, this stage corresponds to emptiness, which requires the active renunciation of one’s expectations, wishes, ambitions and goals, even leadership ambitions and a desire for collective organization. Thus, it creates space for genuine, deep communication, bringing people closer together and the sharing of vulnerability that creates an intense sense of community. This gradually increases one’s sense of security, and thus freedom of expression, which are essential elements for releasing a person’s creative potential. An important factor in the building of a community is that it is created with respect for and acceptance of differences, but not on the basis of agreed rules and shared elements, namely similarity. Therefore, in the fourth phase, there are significant differences between the performing groups and real communities. As Peck (1987, p. 233) notes: “ “ and “How strange that we should ordinarily feel compelled to hide our wounds when we are all wounded! Community requires the ability to expose our wounds and weaknesses to our fellow creatures. It also requires the ability to be affected by the wounds of others... But even more important is the love that arises among us when we share, both ways, our woundedness.” The group which reaches the stage of enhanced sense of community is characterized by the following qualities (Halamová, 2001; Peck, 1987, 1994; Halamová, 2014): inclusiveness and acceptance. It is, therefore, incompatible with the nature of community to have either an internal or an external enemy. Furthermore, competition does not coincide with the nature of the community, as competitiveness is always exclusive (see also Parker, 1998). Therefore, community is cooperating and generous. Another important characteristic of communities is the way in which people within the community cope with conflict: its openness and sincerity in addressing the conflicts and the directness in approaching the true cause of misunderstanding. In a community, there are misunderstandings and conflicts, but they are handled with tact and mutual respect. The community values individual differences. Each member has space to express their own unique point of view and to freely express their view of reality. A true community encourages the display of individuality and the expression of different points of view as “positive” as well as “negative”, which prevents deindividuation as well as groupthink (Wilson & Hanna, 1990). Community members bring together multiple perspectives. Therefore, community is self-critical, realistic, specific, and very useful in decision-making. Each community member, together with others, shares the responsibility for intended purposes. Freedom within the community enables the real implementation of the creative potential of individuals and improves a community’s decision-making ability. Community wisdom results from the atmosphere which allows freedom of expression, appreciation of diversity and the quantity of skills among a group of people and their effective cooperation together in a dynamic and light manner. Peck (1987, 1994) mentions the large healing potential of community. Apparently, this is because such a community satisfies all three elements of psychotherapy: empathy, congruence, and acceptance (Rogers, 1961). The community is a safe and calm place where it is possible to express one’s gifts but also to disclose one’s injuries and declare heroism; it is a place of deep mutual communication and maturation. The atmosphere of peace and love is almost palpable there. Many religious people even perceive it as a spiritual experience (Peck, 1987). Dimensions of the Psychological Sense of Community The results of the psychometric analyses of some scales concerning the psychological sense of community (PSOC) opened the question of the relevance of the four dimensions that make up the psychological sense of community (Chipuer & Pretty, 2009; Long & Perkins, 2003). There are different views regarding the number of dimensions of the sense of community. However, some authors (e.g. Prati, Cicognani, & Albanesi, 2017; McMillan & Chavis, 1986) generally list three or four factors. Others (e.g., Hughey, Speer & Peterson, 1999) prefer one unidimensional factor. Debates on this subject (Flaherty, Zwick, & Bouchet, 2014; McMillan, 2011; Novell & Boyd, 2010; Nowel & Boyd, 2011) indicate the need “... to move away from the McMillan and Chavis model, or at least to expand on it” (Flaherty el al., 2014, p. 961). On the other hand, some empirical studies have confirmed the consistency of the model (Chavis & Pretty, 1999; Long & Perkins, 2003), or referred to the new scales that firmly support it empirically (Peterson,Speer, & McMillan, 2008; Wombacher et al., 2010). We compared Peck’s concept (1987, 1994) with the theoretical model of McMillan and Chavis (1986) (for more details see Appendix 1). Most of the research examining the psychological sense of community has focused on the quantitative mapping of positive attributes of the sense of community, development, and testing of models and instruments that measure the sense of community while identifying moderating variables and mediators that contribute to strengthening the sense of community (centripetal force). The opposite approach was elaborated by Brodsky (1996) who defined typical attributes of a negative psychological sense of community (centrifugal force), which modulates the individual-community’s dynamic system (Distinctiveness, Abstention, Frustration, Alienage). Brodsky’s (1996) conceptualization of the psychological sense of community represents the sense of community as a bipolar construct. The research findings of Mannarini, Rochira, & Talo (2014) supported the conceptualization of a negative psychological sense of community, which indirectly supports the validity of McMillan and Chavis’ (1986) theory of sense of community. We believe that there is a certain overlap of positive and negative attributes of the psychological sense of community that can be examined by the semantic differential method. Projective capacity, the qualitative characteristics of objects, attributes and emotional components of the community can be easily defined on a scale of bipolar adjectives (Heise, 1970). Aim of the Study The main purpose of this study was to construct a new psychometrically sound measure stemming from Peck’s theory of the sense of community (1987), and to assess its psychometric properties. The reason for the development of the new measure was to broaden the variety of instruments measuring the sense of community and which assess sense of community regardless of the community type, and expand the range of different instrument types (e.g., semi-projective semantic differential versus the commonly used self-rating scales). MethodThe Sense of Community Descriptors Scale (SCD) This is a semi-projective method in the form of a semantic differential. Sadovská and Naništová (2000) developed a list of 22 bipolar adjectives according to the work of Peck (1987, 1994) that capture the connotative meanings of true community with a deep sense of community (see Appendix 2). The positive adjectives are located randomly to the left or right in the SCD. While selecting bipolar adjectives, the authors preferred the criterion of relevance to ensure that the SCD contained items which reflected the attributes of a mature community with a strong sense of community according to Peck’s concept (1987, 1994). This scale measures the extent to which a community or group is a genuine community, i.e., the degree to which it allows one to experience the psychological sense of community, regardless of the nature and context of the community. It measures the difference between the sense of community in a real and an ideal community and uses it as a criterion of community satisfaction. The smaller the difference, the greater the satisfaction, as well as the stronger the sense of community. The respondents were given a list of bipolar adjectives describing a mature, effectively functioning community (which was said to also have a strong sense of community), and an immature, poorly functioning community. They were instructed to make an assessment based on the seven-point scale between these two poles. Firstly, they assessed a real community (SCD - RC, in which the particular participant belonged); then they imagined this community as an ideal community (SCD - IC, how participants imagined their real community would look if it were an ideal community). The term ideal community was used in this study to describe the group that possessed the most desirable features in the respondent’s view. The Perceived Sense of Community Scale (PSCS) The PSCS (Bishop el al., 1997) was developed to measure the overall sense of community and its dimensions based on the expectations of the author and McMillan and Chavis’s theory (1986). The factor analysis of its thirty items that were selected by judges extracted three factors: mission, assessing the perception that one is actively engaged with others in the pursuit of a common purpose; reciprocal responsibility, referring to the perception that there are acknowledged members of an ongoing group who are responsible for each other, and disharmony, representing dissatisfaction with aspects of community experience (Bishop et al., 1997). Cronbach’s coefficient for the overall PSCS was α = 0.95 in the original study of Bishop el al. (1997). Alphas among the subscales were α = 0.93 for Mission, α = 0.96 for Reciprocal Responsibility, and α = 0.76 for Disharmony. Naništová and Halamová (2013) found for the Slovak translation of the PSCS a Cronbach coefficient in which α = 0.90 for overall score, α = 0.76 for Mission, α = 0.87 for Reciprocal Responsibility, and α = 0.57 for Disharmony. In the original study, Bishop et al. (1997) tested the validity of the scale and found that the overall PSCS score was significantly correlated with social support. The validity of the PSCS was supported by significant positive correlations with the Brief Sense of Community Scale and the level of social support (Jason, Stevens, & Ram, 2015). The Brief Sense of Community Scale (BSCS) The shortest scale measuring sense of community is the Brief Sense of Community Scale (BSCS; Peterson el al., 2008). It consists of eight items, two items representing each of the four sense of community components (Integration and Fulfilment of Needs, Membership, Mutual influence, and Shared Emotional Connection) according to the theory of McMillan and Chavis (1986). The Cronbach coefficient for the overall BSCS was α = 0.92 in the original study of Peterson el al. (2008). Alphas among the subscales were α = 0.86 for Need Fulfilment, α = 0.94 for Membership, α = 0.77 for Influence, and α = 0.87 for Emotional Connection. For our purposes, we replaced the word neighbourhood by the more general word community to be applicable in our context. Concerning reliability in the Slovak translation, Straárová and Halamová (2015) found a Cronbach coefficient of α = 0.90 for the overall score, α = 0.90 for Integration and Fulfilment of Needs, α = 0.93 for Membership, α = 0.54 for Mutual Influence, and α = 0.83 for Shared Emotional Connection. In the original study, Peterson et al. (2008) tested the validity of the scale and found that the overall BSCS score significantly correlated with community participation, empowerment, and mental health. The validity of the BSCS was further supported by significant positive correlations with the PSCS, and the level of social support (Jason, Stevens, & Ram, 2015). Sample The sample consisted of 903 participants from previous research studies conducted from 2000 to 2013 (there were no considerable social and economic changes between these years in Slovakia which could influence sense of community). The sample was comprised students of various disciplines from technical and liberal arts universities, and working adults from different communities (e.g. religious, hobby, work, etc.). They came from cities with more than 100,000 habitants (12.7%), cities with less than 100,000 habitants (56.7%), as well as rural areas (30.7%) in different parts of Slovakia. 624 were female, and 279 were male. The average age was 23.34 years (SD = 7.04); the minimum age was 18 years and the maximum age was 67 years. Data were obtained by convenience sampling. Questionnaires were distributed by the leaders of small groups or communities, and coordinators or teachers in the case of student groups, mostly on paper and in a few instances via e-mail. The questionnaire included demographic questions about each person, and the BSCS, PSCS and SCD. The authors declare that there are no conflicts of interest and that their treatment of individuals participating in the research complied with APA ethical principles. The research was carried out in accordance with the Code of Ethics of Comenius University. Procedure The Sense of Community Descriptors Scale was developed on the basis of Peck´s theory of community (1987, 1994). Items of the SCD were created primarily by consensus by Sadovská and Naništová (2000), psychologists with community experience who selected bipolar adjectives directly forming the underlying theory of Peck’s community on the criterion of relevance. According to Heise (1970), it is easier for participants to assess scales which are meaningfully allied to the measured construct and which deliver more sensitive assessments. As a result, we favoured the relevance criterion over evaluation, potential. and activity dimensions (Osgood, 1964). Data Analysis For statistical data analysis, we used the R program (version 3.1.3, R Core Team, 2015), and the “psych” (Revelle, 2015), “mirt” (Chalmers, 2012), and “lavaan” (Rosseel, 2012) packages. The analysis procedure was as follows: (1) descriptive analysis: standard distribution properties of numbers (means and standard deviations), as well as testing of the univariate normal distribution of items (D’Agostino skewness test, D’Agostino, 1970; the Anscombe-Glynn kurtosis test (Anscombe & Glynn, 1983); the robust Jarque-Bera test (Jarque & Berra), and multivariate normal distribution (Mardia test, Mardia, 1970), with respect to the ordinal nature of the data, we do not assume a normal distribution; (2) exploratory factor analysis, examining the dimensional structure with the first sample (N = 450), (3) confirmatory factor analysis, verifying the dimensional structure with the second sample (N = 453); (4) analysis of the overall reliability of the instrument and reliability of each dimension; (5) verification of convergent validity. ResultsDescriptive Analysis The descriptive item analyses for all items are presented in Table 1. The distributional properties of each item were examined by inspecting the skewness and kurtosis of the item’s distribution, as well as the pattern of response frequency. Given that the items are ordinal scales, the item distributions were expected to demonstrate non-normality. Consistent with this expectation, 20 of the 22 items in the RC, and 21 of the 22 items in the IC showed statistical evidence of being negatively skewed (p < 0.001). Moreover, 12 of the 22 items in the RC, and 20 of the 22 items in the IC showed statistical evidence of significant leptokurtic kurtosis (p < 0.01). In addition, results of the robust Jarque-Bera tests of normality indicated that each item except for the one that had a distribution that was very significantly different from normal. These distributional findings provide evidence for the non-normality of the items and suggest that normal-theory estimation procedures may not be appropriate for examining the underlying factor structure. This conclusion is strongly supported by testing multivariate normality: Mardia’s test (Mardia, 1970) showed that data are not multivariately normal either in the RC (g2p = 640, z. kurtosis = 52, p < 0.001), or the IC (g2p = 883, z. kurtosis = 142, p < 0.001). Also, an adjusted projection test for detecting multivariate outliers (Filzmoser, Maronna, & Werner, 2008) showed multivariate outlying values both in the RC (7 observations) and the IC (110 observations).
Table 1
Descriptive statistics of items (RC = real community; IC = ideal community) 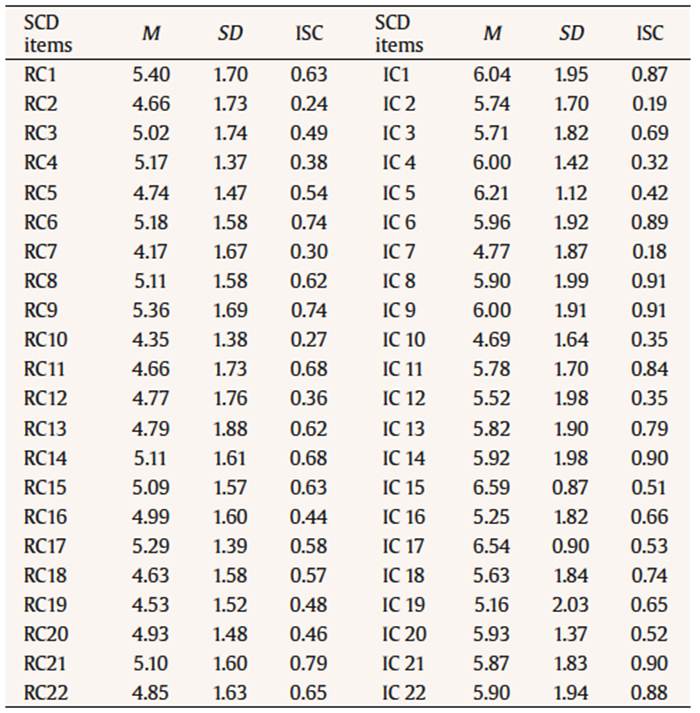
Exploratory Factor Analysis We tested the number of factors that provided the best fit to this instrument, with the first sample (N = 450). We performed a parallel analysis (Garrido, Abad, & Ponsoda, 2016) in R, package “psych” (Revelle, 2015), with the minres method and polychoric matrix. The results showed that 3 factors in the real matrix had eigenvalues higher than the eigenvalues in the simulated matrix, both for RC and IC. Next, we used exploratory IRT factor analysis, with Samejima’s graded response estimation performed in R, package “mirt” (Chalmers, 2012). We also used the MHRM algorithm (Cai, 2010). We compared a one-factor solution, a two-factor solution, and a three-factor solution. Since the factors were allowed to correlate, the Oblimin rotation was used. We examined the following global model fit indices: chi-square, the Tucker-Lewis Index (TLI), the Comparative-Fit Index (CFI) and the Root Mean Square Error of Approximation (RMSEA); all were computed in R, package “mirt” (Chalmers, 2012). We utilized the fit indices and cut-off values suggested by Hu and Bentler (1999). Thus, the RMSEA values less than 0.08 and the TLI and CFI values greater than 0.95 are considered acceptable for the model fit (all criteria had to be satisfied). Moreover, since the models are nested, we performed likelihood ratio tests. In terms of fit indices and likelihood-ratio tests, the one-factor solution (all items loaded on a unique common factor) had the poorest fit and the three-factor solution had the best fit (Table 2). The inspection of factor loadings (Table 4) showed that the items with the highest loadings are Acceptance (items 1, 6, 8, 9, 13, 14, 16, 19, 21, and 22); Dynamics (items 2, 4, 5, 7, 12, 15, 17, and 20); and Openness (items 3, 10, 11, and 18). The names of the factors were chosen on the basis of the item loading to the particular factor in order to capture the essence of the grouped items. Correlation between Acceptance and Dynamics was 0.39 for RC and 0.31 for IC, correlation between Acceptance and Openness was 0.64 for RC and 0.69 for IC, and correlation between Dynamics and Openness was 0.35 for RC and 0.29 for IC.
Table 2
RC and IC exploratory models’ indices of fit (RC = real community; IC = ideal community) 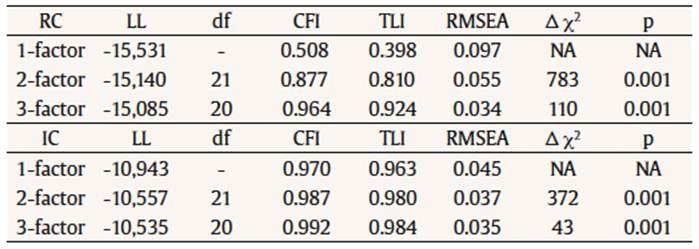
Table 3
RC and IC confirmatory models’ indices of fit (RC = real community; IC = ideal community) 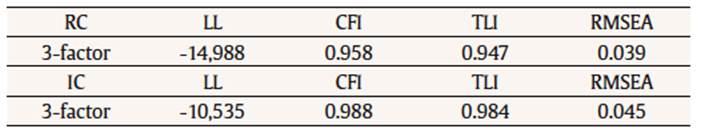
Table 4
Factor loadings of the 3-factor exploratory model for RC and IC (RC = real community; IC = ideal community) 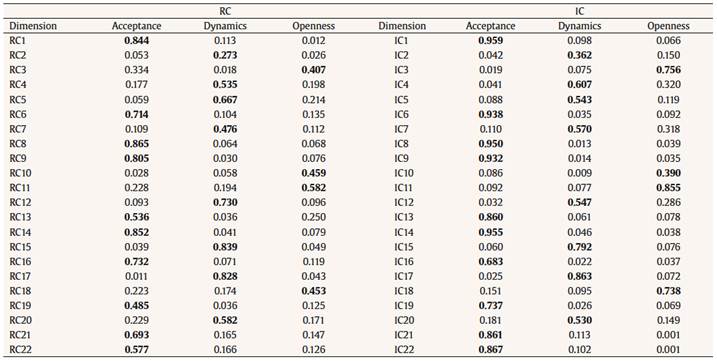
Confirmatory Factor Analysis Confirmatory factor analysis was performed in R, package “lavaan” (Rosseel, 2012). The classical (Pearson product-moment) correlation matrix without correction was not appropriate here, due to its extreme multivariate nonnormality and the large number of multivariate outliers. We fitted our confirmatory models with a robust weighted least squares estimator and polychoric correlation matrix (WLSMV), which outperforms the maximum likelihood estimator and the full weighted least squares estimator (Flora & Curran, 2004; Olsson, Foss, Troye, & Howell, 2000). We fitted three-factor models based on the results from the exploratory factor analysis for both RC and IC, and examined global model fit indices: chi-square, the Tucker-Lewis Index (TLI), the Comparative-Fit Index (CFI), and the Root Mean Square Error of Approximation (RMSEA). We utilized the fit indices and cut-off values suggested by Hu and Bentler (1999). Thus, RMSEA values less than 0.08 and TLI and CFI values greater than 0.95 are considered acceptable for the model fit (all criteria had to be satisfied). We can see that the three-factor models showed an excellent fit: their comparative indices of fit (CFI and TLI) are safely above the recommended 0.95 cut-off point, and all RMSEA values are below the recommended 0.08 cut-off point (Table 3). Therefore, we can conclude that the three-factor models (Table 5) have an excellent fit and verify the three-factor solution. Correlation between Acceptance and Dynamics was 0.37 for RC and 0.46 for IC, correlation between Acceptance and Openness was 0.87 for RC and 0.94 for IC, and correlation between Dynamics and Openness was 0.50 for RC and 0.45 for IC.
Table 5
Factor loadings and IRT parameters of the 3-factor confirmatory model for RC and IC (RC = real community; IC = ideal community) 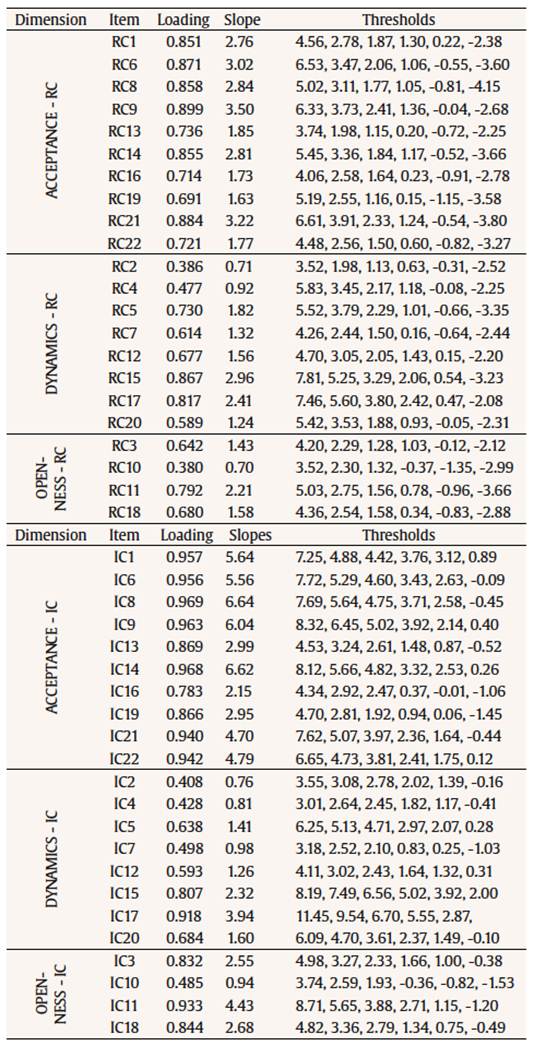
Reliability Analysis The overall Cronbach alpha value for the complete scales was an excellent 0.91 for the RC, and an excellent 0.94 for the IC, with an average interitem correlation (calculated from the polychoric correlation matrix) of 0.32 for the RC (range from 0.02 to 0.74), and 0.42 (range from 0.03 to 0.93) for the IC. Based on the criterion of 0.30 as an acceptable corrected item-total correlation, two items from the RC (RC-2, RC-10), and two items from the IC (IC-2, IC-7) were identified as possibly problematic, but their corrected item-total correlations within their respective subscales were above 0.30. Cronbach alpha estimates for the three subscales of the RC are 0.92 (Acceptance), 0.81 (Dynamics), 0.71 (Openness), and 0.98 (Acceptance), 0.78 (Dynamics), 0.80 (Openness) for the IC subscales. As far as test information reliability is concerned, test information for Acceptance in RC is 83.76 between - 6 and 6 values of latent ability. Out of this amount, 51.76 (62%) is between - 6 and 0, and 31.94 (38%) is between 0 and 6, which suggests that for this RC dimension, the test is more precise for lower levels of latent ability. This is valid also for Acceptance in IC: test information for Acceptance in IC is 75.81 between - 6 and 6 values of latent ability, 69.54 (92%) is between - 6 and 0, and 6.23 (8%) is between 0 and 6, therefore for this IC dimension, the test is far more precise for lower levels of latent ability. Test information for Dynamics in RC is 45.56 between - 6 and 6 values of latent ability, 29.18 (64%) is between - 6 and 0, and 15.27 (34%) is between 0 and 6, which again means that also for this RC dimension, the test is more precise for lower levels of latent ability. This is true for Dynamics in IC as well: test information is 36.99 between - 6 and 6 values of latent ability, 33.77 (91%) is between - 6 and 0, and only 2.67 (7%) is between 0 and 6, therefore the test is far more precise for lower levels of latent ability in this dimension. Test information for Openness in RC is 19.9 between - 6 and 6 values of latent ability, 11.33 (57%) is between - 6 and 0, and 8.32 (42%) is between 0 and 6, which means that for this RC dimension, the test is slightly more precise for lower levels of latent ability. Test information for Openness in IC is 32.77 between - 6 and 6 values of latent ability, 24.10 (74%) is between - 6 and 0, and 8.60 (26%) is between 0 and 6, therefore the test is more precise for lower levels of latent ability in this dimension. To conclude, we can see that the test is generally more precise for lower levels of latent ability. Convergent Validity Analysis To verify the validity of the Sense of Community Scale Descriptors, we decided to estimate its relationship to the Perceived Sense of Community Scale (PSCS; Bishop et al. 1997) and the Brief Sense of Community Scale (BSCS; Peterson et al., 2008) and their dimensions. The nonparametric Spearman correlation coefficients confirmed the expected positive significant relationships between the SCD scores for the real community and score of the PCSC, its dimensions and the total score of the BSCS, and its dimensions except for the Influence dimension (see Table 6).
Table 6
Nonparametric Spearman correlation coefficients between SCD RC, PSCS and BSCS 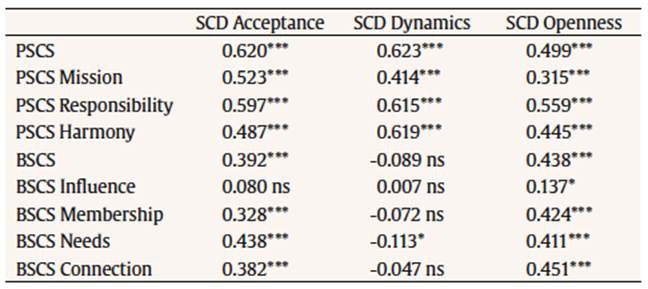
The difference between real and ideal situations has often been used in research to identify satisfaction, dissatisfaction or pathology, even in the context of the psychological sense of community (Glynn, 1981). In line with this assumption, we found strong negative correlations between the SCD RC scores and the difference between the real and ideal community. Respondents with high scores on the SCD scales had a significantly lower differential score between the perception of their own (real) group and the ideal group (see Table 7).
Table 7
Discussion
Nonparametric Spearman correlation coefficients of difference between real and ideal community of SCD with PSCS and BSCS 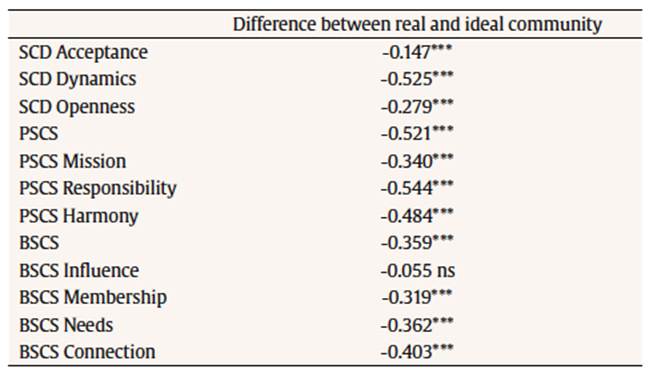
In the present study, we provided a psychometric analysis of a new measurement tool, the Sense of Community Descriptors Scale (SCD) which builds on the theory of Peck’s sense of community (1987). According to our results, the SCD seems to be a reliable and valid measure for sense of community. The overall Cronbach alpha value for the complete scales was an excellent 0.91 for the SCD RC and 0.94 for the SCD IC; for all of the sub-dimensions, the Cronbach alpha values ranged from 0.71 to 0.98. In exploratory factor analysis we analysed the internal structure of the SCD and tested the number of factors that provided the best fit to this instrument. We found a three-factor solution of the SCD for both the SCD - RC and SCD - IC. Also, the confirmatory factor analysis confirmed the three-factor structure of both the SCD - RC as well as SCD - IC, which is the number of dimensions reported by Bishop et al. (1997) and Jason et al. (2015) and more recently Prati et al. (2017). With respect to the marker items and their content definition, we named the factors Acceptance, Dynamics, and Openness. “Acceptance” maps the maturity of communities regarding the perception of individuality, uniqueness, meaningfulness, acceptance and respect for diversity, the provision of safety, the ability of self-reflection, and accountability. A mature community is described by its attributes of usefulness and creativity, uniqueness and specificity, safety, acceptance and respect, as well as the level of self-criticism and accountability. We can find some similarities of the Acceptance factor to the factors of Membership (McMillan & Chavis, 1986; Prati et al., 2017) and Responsibility (Bishop et al., 1997) “Dynamics” depicts the internal process of community in terms of the quality of relationships, common objectives, and self-transcendence. The internal dynamics of the community are expressed by attributes such as calm and dynamic, deep and spiritual, honest and generous, organized and cooperating. Dynamics can be loosely related to the factors of Influence and Needs Fulfilment (McMillan & Chavis, 1986), Opportunities (Prati et al., 2017) and Mission (Bishop et al.1997). “Openness” identifies a community’s atmosphere through inner freedom, mutual trust, and open communication. This open and sharing community atmosphere is expressed by adjectives such as liberating and easy, open and sharing. Openness resembles the factors of Emotional Connection (McMillan & Chavis, 1986; Prati et al., 2017) and Disharmony (Bishop et al.1997). A significant correlation (p < 0.001) of the scores of the SCD-RC with the PCSC and the BSCS confirms the convergent validity of the analysed instrument. A more detailed comparison of the correlation coefficients for the factors led to a number of interesting findings, especially regarding the Influence factor. There was no significant link between the Influence factor and scores of the SCD-RC Acceptance and Dynamics factors. These results could pinpoint the low validity of the Influence factor (Straárová & Halamová, 2015). This could be caused by the meaning of the items related to the influence of oneself and others in a different cultural context (influence is a synonym for manipulation in the Slovak language), or it could be due to different criteria when drawing up the SCD according to Peck’s concept. Consideration should also be given to McMillan’s expression (McMillan, 2011, p. 512) on the issue of instruments that measure the psychological sense of community that: “…measuring the facets of the PSOC in a 12-item scale or an 8-item scale is inadequate at best. Making assumptions about what the theory contains from such short truncated measures as the SCI or the BSCS is a distortion of the theory. These measures are meant to be a general measure of the PSOC as a whole. They have pieces of each element, but they do not represent the whole of any of the four elements.” The BSCS is a self-rating denotative instrument in which items are described in terms of participants´ feelings and thoughts about their own community. Therefore, the scale could be significantly influenced by social desirability. On the other hand, SCD is a semi-projective instrument in which guessing the “right” or desirable answer is not clear, as it captures the connotative meanings of sense of community in the form of opposing adjectives. Consequently, the SCD could be a more objective tool for assessing one’s own sense of community. In addition, the BSCS does not measure community satisfaction, whereas the SCD assesses the difference between real and ideal community, because one can have quite a high score in the BSCS, but still not be satisfied because your expectations of sense of community are even higher. Inspired by the discrepancy theory of Higgins (1987), we consider that a significant difference between the perception of the real and ideal community for members of the community cannot only lead to the absence of positive perceptions of their community, but also to the experience of negative emotional states, while triggering feelings of disappointment, lack of fulfilment, and frustration. On the other hand, a small difference between the perception of the real and ideal community may lead to the stagnation of community development. Although some degree of discrepancy is necessary as a dynamising and motivational factor for the development community, it is necessary to take into account the extent of the inconsistency and analyse individual items of the SCD and specify the particular attributes and areas in which this difference manifests it most significantly. The degree of discrepancy between the real and ideal community (or the degree of dissatisfaction with the current community) can secondarily affect the intensity and depth of experiencing a psychological sense of community (Glynn, 1981). These considerations are supported by the results of correlation analysis between the degree of the difference between real and ideal community factors and the SCD, PCSC and BSCS scales (p < 0.001). We have found that the difference between the ideal and the real sense of community is significantly related to the lower levels of the psychological sense of community in the SCD factors of Acceptance, Dynamics and Openness; in the PCSC dimensions of Mission, Responsibility and Harmony, and in the BSCS factors of Membership, Integration and Fulfilment of Needs, and Emotional Connection. However, we did not find any significant relationship with the factor of Influence. According to the previous findings, we question the validity of this factor in mapping the PSOC. We believe that its content is connected more to the classical group structure (emphasis on standards, policy, structure, and distribution of power), than to community dynamics. Achieving an intense sense of community presupposes the development of the stages through pseudo-community, chaos, and emptiness to the mature community (Hampton, 2000; Peck, 1987, 1994). The most dramatic is the third phase, where instead of continuing the process of structuring, standardization, influence and dominance, it leads to the removal of the external protective layers and subsequent reintegration of a group into a higher community level. Our research findings have several limitations. The first relates to the generalization of results. Despite our extensive research sample, there are no respondents from neighbourhoods. We can therefore conclude that our findings are more ecologically valid for relationship-based and interest-based communities, rather than spatial-based and neighbourhood-based communities. Also, the data were comprised of participants from various research studies conducted from 2000 to 2013; this is a possible drawback because different social and economic events could potentially affect the sense of community. ConclusionsThe benefits of this study are as follows. Firstly, it offers an alternative model for the psychological sense of community to the most frequently used McMillan and Chavis theory (1986), as the SCD is inspired by the work of Peck (1987, 1994). Secondly, it introduces the development of a new projective instrument for measuring PSOS, which operationalises PSOC as a bipolar construct on a scale consisting of bipolar adjectives. Thirdly, the scale allows an estimate of the expected level of the sense of community in an ideal community in addition to the measurement of the sense of community in the real community. The SCD makes it possible to map the level of community satisfaction (CS = community satisfaction) in the real community. Community satisfaction is expressed by the difference between the total scores of the ideal community (IC) and the community to which one belongs (RC). Fourthly, it recommends that the profiles of the real and ideal community for a specific individual be created and compared in order to see which items have the most different perceptions. The comparisons of profiles between a few individuals could be compiled in the form of a graphic representation of individual items. Finally, the SCD can be used for creating profiles of a real and ideal community in order to design a specific intervention according to the areas of the broadest discrepancies. The comparison of profiles between them could then be compiled in the form of a graphic representation of the average values of individual items. Although the SCD allows graphic comparisons of profiles of members among members and between communities, we did not work with them because the aim of this study was to test its psychometric properties. In conclusion, the psychometric analysis suggests that the three-factor scale of the SCD is a reliable and valid instrument for measuring the psychological sense of community on all behavioural, emotional and cognitive levels. Given its structure, the Sense of Community Descriptors Scale may be one of the few scales that measure the psychological sense of community regardless of community context, which allows it to be used in many types of communities. Referencias |
Funding: The authors appreciate the financial support from VEGA 1/0578/15. Correspondence: julia.halamova@gmail.com (J. Halamová).
Copyright © 2026. Colegio Oficial de la Psicología de Madrid


 PDF
PDF e-PUB
e-PUB CrossRef
 JATS
JATS Print
Print Send
Send