
Wording Effect in the Measurement of Attitudes towards Dating Violence
[El efecto de la redacci├│n de los ├ştems en la medici├│n de las actitudes hacia la violencia en el noviazgo]
Yolanda Pastor1, Elena Pascual2, Juan J. Muñoz1, and Soraya Martínez Bravo2
1University Rey Juan Carlos, Madrid, Spain; 2Freelance researcher, Madrid, Spain
https://doi.org/10.5093/pi2019a15
Received 14 November 2018, Accepted 10 July 2019
Abstract
Positive and negative-worded items affect respondents’ answering style in attitude surveys and have psychometric implications. This research was conducted to assess the wording effect on the validation of the Spanish adaptation of the Intimate Partner Violence Attitude Scale-Revised (IPVAS-R). Five competing models were tested with confirmatory factor analyses in two samples of young people between 15 and 25 years old (sample A, n = 402, Mage = 17.5, SDage = 2.21, 60.4% girls; sample B, n = 451, Mage = 19.55, SDage = 3.11, 57.6% girls). An outstanding method effect related to the writing of items in a positive (acceptance) versus negative (rejection) sense affecting the original three-factor structure of the IPVAS-R was supported by this research. The wording effect produced inconsistent factorial loadings and flawed internal consistency. Most of the relationships with other criterion measures, after controlling for the method effect, were moderate, in line with previous studies. Our results imply that the wording effect should be considered both in the building and the validation of instruments on attitudes towards dating violence.
Resumen
La redacción de los ítems en sentido directo e inverso afecta al estilo de respuesta de los encuestados en las escalas de actitud y tienen implicaciones psicométricas. Esta investigación se llevó a cabo para evaluar el efecto de la redacción en sentido directo o inverso en la validación de la adaptación española de la Escala de Actitud hacia la Violencia en la Pareja-revisada (IPVAS-R). Se probaron cinco modelos competitivos con análisis factorial confirmatorio en dos muestras de jóvenes entre 15 y 25 años de edad (muestra A, n = 402, Medad = 17.5, DTedad = 2.21, 60.4% chicas; muestra B, n = 451, Medad = 19.55, DTedad = 3.11, 57.6% chicas). Un notable efecto del método relacionado con la redacción de los ítems en un sentido positivo (aceptación) frente a negativo (rechazo) que afectaba a la estructura original de tres factores del IPVAS-R fue avalado por esta investigación. El efecto de la redacción produjo cargas factoriales incongruentes y una consistencia interna defectuosa. La mayoría de las relaciones con otras medidas criterio, tras controlar el efecto del método, fueron moderadas, en línea con estudios anteriores. Nuestros resultados implican que el efecto de la redacción debe ser considerado tanto en la construcción como en la validación de los instrumentos que miden actitudes hacia la violencia en el noviazgo.
Keywords
Attitudes, Dating violence, Wording effectPalabras clave
Actitudes, Violencia en el noviazgo, Efecto de la redacci├│n de los ├ştemsCite this article as: Pastor, Y., Pascual, E., Muñoz, J. J., & Bravo, S. M. (2020). Wording Effect in the Measurement of Attitudes towards Dating Violence. Psychosocial Intervention, 29(1), 19 - 28. https://doi.org/10.5093/pi2019a15
yolanda.pastor@urjc.es Correspondence: yolanda.pastor@urjc.es (Y. Pastor).Dating violence is considered as a type of intimate partner violence (Centers for Disease Control and Prevention, 2019) affecting adolescents and young people in relationships with different degree of formality (Vagi et al., 2013). Whereas the most classical definitions restricted the term to physical violence (Sugarman & Hotaling, 1989), the most widely accepted definitions today considered any act of psychological, sexual, or physical abuse as part of the violence in the courtship (Anderson & Danis, 2007; Centers for Disease Control and Prevention, 2019; Chen, Foshee, & McNaughton Reyes, 2016). In addition, some scholars restrict the term to current relationships (Anderson & Danis, 2007), while others extend it to appointments (Lavoie, Robitaille, & Hebert, 2000) or even terminated relationships (Centers for Disease Control and Prevention, 2019). In this paper we adopt a broad view of this term, considering that any behaviour that damages the physical, psychological, or sexual integrity of a current or former partner in adolescence or youth is part of it. Lack of consensus of an operational definition of dating violence has made it difficult to provide data of the extent of the problem. Systematic reviews on the prevalence of dating violence revealed the extraordinary variability in the data provided by the studies, ranging from 0.4 to 95% (Jennings et al., 2017; Rubio-Garay, López-González, Carrasco, & Amor, 2017; Wincentak, Connolly, & Card, 2017). The enormous diversity in prevalence data is due to the type of violence considered, the gender of the respondents, the questionnaire used, the biases of the interviewee in the self-reports, the age range studied, or even if it deals with violence suffered or perpetrated. In a meta-analytical review study no differences were found by gender in the degree of victimization of physical violence, girls showing higher rates of violence perpetration (Wincentak et al., 2017). Despite this, previous research revealed that boys were involved in more severe forms of physical aggression and produced greater damage (Muñoz-Rivas, Graña, O’Leary, & González, 2007). Regarding sexual violence, a previous review indicated that girls showed higher rates of victimization and lower rates of perpetration than boys (Wincentak et al., 2016). It should be noted that psychological violence was shown in the studies as the most frequent form of aggression reported and also the form of violence exercised in greater proportion by girls (Cascardi & Avery-Leaf, 2015; Ybarra, Espelage, Langhinrichsen-Rohling, Korchmaros, & Boyd, 2016). Studies also emphasized that violence in the couple was bidirectional at this stage (Borges & Dell’Aglio, 2017; Muñoz-Rivas, Graña et al., 2007; Rubio-Garay et al., 2017). Adolescent dating violence is a relevant social problem due both to its prevalence and its consequences on the physical and psychological health of people who suffer it (Chen et al., 2016; Garthe, Sullivan, & Behrhorst, 2018; McNaughton Reyes, Foshee, Chen, Gottfredson, & Ennett, 2018), an also because it constitutes a learning model for future relationships in adult life (Werkerle & Wolfe, 1999). Among the most studied risk factors in the literature (for a review, see Duval, Lanning, & Patterson, 2018; Muñoz-Rivas, González-Lozano, Fernández-González, & Fernández-Ramos, 2015; O’Keefe, 2005; Rubio-Garay, Carrasco, Amor, & López-González, 2015; Vagi et al., 2013), the presence of attitudes justifying dating violence stands out. The belief that it is acceptable to use violence in courtship is one of the most consistent and strongest factors associated to perpetrating violence in dating relationships (O’Keefe, 2005). Nevertheless, meta-analytical review studies have not focused on assessing the weight of these attitudes as predictors of courtship violence (for a review of meta-analytic studies see Gracia, Puente, Ubillos, & Páez, 2019). On the contrary, the study of attitudes is an internationally prolific field of study and an emerging line of research in Spain. For this reason, there are still few validated Spanish instruments for its evaluation. The Spanish version of the Acceptance Dating Violence scale has been recently validated, showing adequate psychometric properties (Fernández-González, Calvete, & Orue, 2017). This instrument evaluates the justification of both physical and sexual violence in a relationship; however, it leaves out the acceptance of psychological abuse, which is precisely the most frequent among adolescents and young people. In this respect, one of the emerging instruments to measure attitudes towards dating violence is the so-called Intimate Partner Violence Attitude Scale (IPVAS; Smith, Thompson, Tomaka, & Buchanan, 2005). This instrument is designed to fill a gap in literature on the evaluation of such attitudes. It stands apart from others as it evaluates attitudes in general by differentiating the type of violence with special attention to psychological and physical violence, without taking into consideration the gender of the perpetrator (for example, the scales developed by Price et al., 1999 differentiate between type of violence and gender of the perpetrator). The IPVAS was created by Smith et al. (2005) and validated in a sample of 333 American-Mexican university students. The original scale was made up of 23 items grouped in 3 subscales: abuse, control, and violence. Their internal consistency ranged from .69 to .81. In addition, the three subscales were positively and significantly correlated, with values ranging from .32 to .44. This instrument was later reviewed by Fincham, Cui, Braithwaite, and Pasley (2008) with a sample of 859 university students. Based on the initial scale, three items were a priori removed because of their psychometric properties and wording. The work was carried out in two studies, the first using principal component analysis (PCA), where the three-factor model found by Smith et al. (2005) was exactly replicated. Items showing values lower than .40 were removed, with a remaining scale made up by 17 reagents. The internal consistency in this case varied from .71 to .91. The study also analysed the concurrent and predictive validity in relation to other constructs. It was found that social desirability and satisfaction in relationships were negatively correlated with the different subscales of the IPVAS-R. In addition, the belief that disagreement in relationships was destructive correlated positively with the different scales and negatively when the disagreement was considered constructive. As for predictive validity, young people were evaluated 14 weeks later and showed differences based on whether they were still in the same relationship or had broken up. Those who had broken up showed less tolerant attitudes in the Control subscale (Fincham et al., 2008). In the second study, the factor structure was evaluated with confirmatory factor analysis (CFA) and it was found that the three-factor model (with 17 items) adjusted to data the best. In this case, internal consistency and temporary stability of the measure were assessed at two points in time (abuse: α = .81 and α = .92; control: α = .66 and α = .83; violence: α = .71 and α = .68; test-retest: abuse, r = .53; control, r = .39; and violence, r = .58). At the same time, they evaluated convergent, discriminant, and predictive validity with other measures. The IPVAS-R subscales were neither correlated with the marital satisfaction of the parents nor with pro-divorce attitudes (except for the control subscale). The subscales showed significant correlations with conflict management in the relationship, demand pattern, and psychological aggression. In addition, the abuse and violence subscales correlated with the use of physical aggression and every subscale of the Conflict Tactics Scale (CTS; Fincham et al., 2008). The IPVAS-R has also been validated with a sample of 280 Turkish college students (Toplu Demirta, Hatipolu-Sümer, & Fincham, 2017). A confirmatory factor analysis was performed to check that the depicted dimensions were the same as those in Fincham et al. (2008), and later calculated Cronbach alpha for the whole instrument (α = .72) and for all the subscales: abuse (seven items, α = .65), violence (four items, α = .72), and control (six items, α = .62). The results showed good construct validity after repeating the CFA with another sample (n = 205). To assess the converging validity, IPVAS-R subscales were correlated with those of the ASI (Ambivalent Sexism Inventory) and with the subscale of physical aggression of the CTS-R (Conflict Tactics Scale-Revised), obtaining positive and moderately significant scores (Toplu Demirta et al., 2017). Current studies on the assessment of attitudes have shown that the use of a positive and a negative question wording systematically affected survey answers, in such a way that respondents were more likely to disagree to negative attitude questions than to agree to equivalent positive ones. The cognitive processes underlying question answering could be the cause for this respondent asymmetry (Kamoen, 2012). In relation to this phenomenon, Tourangeau and Rasinski (1988) described a four-stage process of respondents of an attitude scale. First, respondents determined what attitude the sentence was about. Second, they recovered relevant beliefs and feelings related to this attitude. Third, they enforced these beliefs and feelings in depicting the appropriate judgment. At the end of the process, they used this judgement to choose the appropriate answer. In all this process, prior items generate a framework to interpret the following questions. Kamoen’s (2012) research showed that wording effects affected when respondents translated their own opinion into the answering options. In this moment, they assigned a relative meaning depending on the polarity of the item. In addition, a recent study has pointed out that the combination of positive and reversed items on the same scale produced a flawed reliability and validity was affected by secondary sources of variance (Suárez-Álvarez et al., 2018). These psychometric implications have been widely reported in the literature (e.g., for a review, Tomás, Galiana, Hontangas, Oliver, & Sancho, 2013). While the wording effect has been apply to the study of self-esteem validity (e.g. DiStefano & Motl, 2009; Tomás et al., 2013) or other psychological constructs (e.g., Gu, Wen, & Fan, 2015), it has not been reported in dating violence attitudes assessment. Figure 1 Five competing CFA models tested. 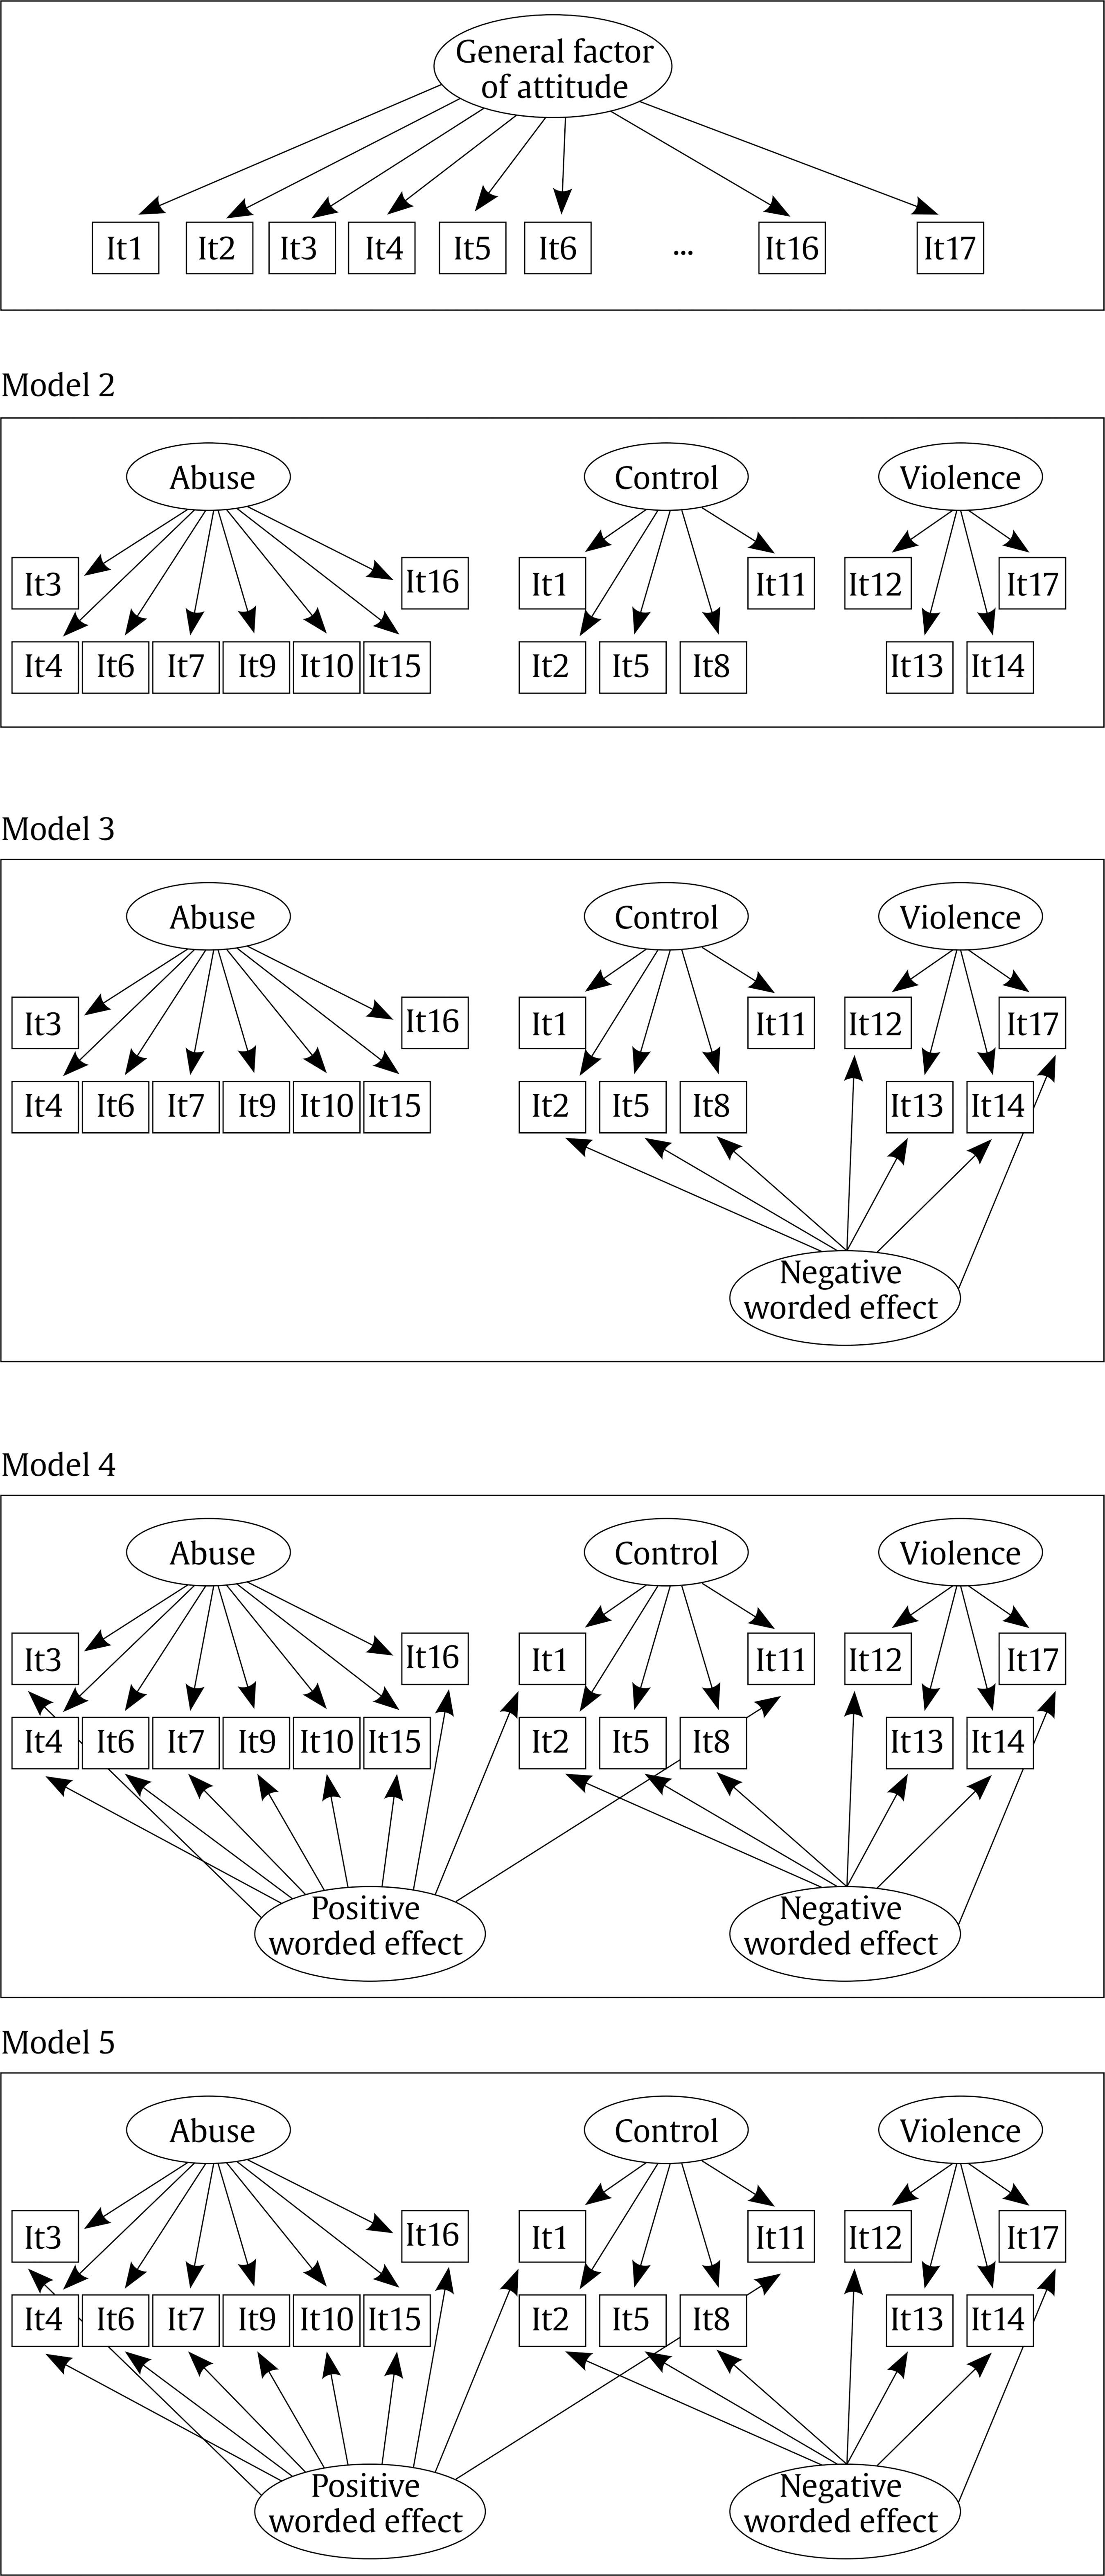 Note. For simplicity, all residuals were assumed, but are not shown; relationships between dimensions were parameters to estimate in all models, except in model 1. This research starts from the hypothesis IPVAS-R validity and reliability could be especially susceptible of a wording effect, due to the combination of positive and reversed items in the control subscale, only positive on the abuse subscale, and only reversed on the violence subscale. The first objective of this study was to examine the appropriate factor structure of the Spanish adaptation of the IPVAS-R (Fincham et al., 2008). With this objective, a series of five competitive models were tested (see Figure 1), including a one-dimension structure derived from the possible non-distinction of respondents between different types of dating violence attitudes (model 1); the original three-factor structure of this instrument, which involved respondents distinction between abuse, control, and violence (model 2); the original three-factor structure with one additional factor of only negative items as a wording effect estimation (model 3); the three-factor structure with one additional factor of only positive items (model 4); and a five-factor structure composed by the original subscales of abuse, control, and violence and two method factors, one for positive items and another for negative items (model 5). The second purpose of this study was to assess the reliability and convergent validity of the IPVAS-R. Participants Two samples of young people enrolled in public and private high schools and universities in the southern region of the province of Madrid recruited in the same period of time were used in this study. Both samples were selected from middle class educational centres. The participants came from 3 different secondary schools (1 public, 1 private, and 1 subsidized centre) and 1 public university, from 14 different university degrees, most of them in Education (19%) and Psychology (37%). The samples were composed by 402 students (sample A) between 15 and 25 years old (Mage = 17.5, SDage = 2.21, 60.4% girls) and 451 students (sample B) of the same age range (Mage = 19.55, SDage = 3.11, 57.6% girls). Approximately, 52% of respondents were college students in both samples. The combination of questionnaires that each sample answered (see Variables and Instruments section) and the researcher in charge if its collection were different. A total of 62.6% of surveyed participants currently have or have had a relationship. Of these, 36% were currently in a relationship and the average duration was 24.35 months (SD = 22.66) and 53.3% had previously had a relationship of an average duration of 19.49 months (SD = 18.15). Variables and Instruments A Spanish adaptation was made of the Intimate Partner Violence Attitude Scale-Revised (IPVAS-R; Fincham et al., 2008). We adopted the revised version of Fincham et al. (2008) because they performed a detailed study of its validity (factorial, convergent, and discriminant validities) and the reliability of the questionnaire with greater scientific guarantees than in the original study (Smith et al., 2005). The scale was made up of 17 items with a 5-point Likert scale (from 1 = totally disagree to 5 = totally agree), the highest scores indicating greater attitudes towards violence. The scale had seven reverse items (2, 5, 8, 12, 13, 14, and 17) and three subscales: abuse, violence, and control, with eight, four, and five items respectively (see Appendix). The translating and questionnaire adaption processes were carried out following the iterative process recommended by different authors (see, e.g., Bullinger, Anderson, Cella, & Aaronson, 1993). This consisted in a translation of the original instrument into Spanish and its subsequent back translation to English carried out by two independent bilingual translators. The members of the research team compared the different versions, assessing their comprehension, semantic, idiomatic, and conceptual equivalence, suggesting the appropriate modifications to ensure equivalence with the original instrument. To guarantee comprehension, the questionnaire was administered to a small sample of eight fifteen-year-old adolescents, who in turn were interviewed about the difficulties encountered in answering. No difficulties in understanding the items were reported and redundancy in the content of some of the items was informed. In addition, the Spanish adaptation (Muñoz-Rivas, Rodríguez, Gómez, O’Leary, & González, 2007) of the short version of the Conflict Tactics Scale (CTS-R) was provided (Strauss, 1979). This instrument evaluates how to resolve discrepancies in a relationship. This abbreviated test has 18 bidirectional items between aggressor and victim in a 5-point Likert scale (from 1 = never to 5 = very often). The factorial analysis carried out in this test resulted in four factors: reasoning/argumentation, verbal/psychological aggression, medium physical aggression, and severe physical aggression (Muñoz-Rivas, Rodríguez et al., 2007), all of them evaluated in their dual perspective of experimented (suffered) violence and exercised (perpetrated) violence. Internal consistency of the subscales in the Spanish population ranged from .30 to .81, with the argumentation subscale presenting the lowest values (.30-.31), followed by psychological aggression (.62-.64). The reliability of different subscales in our data shows values between .68 and .89, with moderate-high reliability, except for the argumentation subscale, which shows values of .29 and .21 for exercised and suffered violence respectively. This subscale, which represents the weakest form of aggression seen on the scale, showed a reliability just as low as its adaptation to the Spanish population (Muñoz-Rivas, Rodríguez et al., 2007). Therefore, these two subscales (suffered and exercised argumentation) were deleted in the subsequent analysis. The Spanish adaptation of IPVAS-R and CTS-R were administered to both samples (A and B). It should be noted that only subjects that currently have or have had a relationship responded to the CTS-R. In sample A the following tools were additionally supplied: the short version (Reynolds, 1982) of the Marlowe-Crowne Social Desirability Scale (Ferrando & Chico, 2000), which includes 13 true-false items, showed an adequate validity and reliability in a previous study (Reynolds, 1982) and an internal consistency of .63 in our sample; the Spanish adaptation (Mestre, Frías, & Samper, 2004) of the Interpersonal Reactivity Index (IRI; Davis, 1983), a measure of empathy that includes 28 items distributed in four subscales with a 5-point Likert scale, whose factor structure and reliability was endorsed with a Spanish sample (Mestre et al., 2004), a measure that is also used as a global empathy measure as in our study (α = .74 in our data); the Argentinian adaptation and validation (Rodríguez, Mesurado, Oñate, Guerra, & Menghi, 2017) of the Prosocial Conduct Scale (PSA; Caprara, Steca, Zelli, & Capanna, 2005) (Regner & Vignale, 2008), which includes 16 items with a 5-point Likert scale, whose global scale internal consistency in our study was .87; the Physical and Verbal Aggression Scale (AFV; Caprara & Pastorelli, 1993; adapted to Spanish and validated by Del Barrio, Moreno, & López, 2001), which includes 20 items whose answer format provides three alternatives (1 = never, 2 = sometimes, 3 = often), according to the frequency of behaviour, divided into physical aggression (α = .73) and verbal aggression (α = .72) subscales; and lastly, the Relationship Satisfaction Scale (Hendrick, 1988; adapted into Spanish and validated by De la Rubia, 2008), which includes 7 items with 5 response options, that shows a high internal consistency of .83 for this study. In Sample B, the Sexist Detection Scale in Teenagers (Recio, Cuadrado, & Ramos, 2007) was also supplied. This scale is made up of 26 items with a 6-point Likert scale, the highest scores representing a greater degree of sexism. It is made up of two subscales, hostile sexism and benevolent sexism. The validity of this instrument has been demonstrated with Spanish population and an analysis of the item-total correlation showed an adequate reliability (Recio et al., 2007). In our study, the internal consistency of the subscales was .94 and .87 for hostile and benevolent sexism respectively. Procedure The procedure for information collection was positively evaluated by the Ethics Committee of the URJC before the research began. With respect to the high school and college students, written consent was requested from the director/s of the relevant educational centers informing them of the nature of the research to participate in our study. Once this consent was obtained, the center sent minors’ parents an informed consent form to be signed by parents and students. The consent forms included data on researchers, the nature of research, and their rights according to the Organic Law 15/1999 on personal data protection. Once the forms were signed, a researcher went to the education center to hand out the questionnaires during class hours. In the case of adult university students, the researchers informed different URJC degrees during class hours of the possibility of participating in the research. The students interested in participating had to provide their e-mail address and were later provided with a Google Docs link to complete the questionnaires online. They did not have access to the instruments unless they completed the previous informed consent form through the above mentioned app. The participants in the study were volunteers and did not receive any compensation for taking part (or not). Data Analysis Confirmatory factor analysis (CFA) was used to analyse the best factorial structure to the Spanish version of IPVAS-R in the two samples studied. Due to non-normal distribution of data, the five models in Figure 1 were estimated with weighted least squares method (WLS) for LISREL 8.80, using polychoric correlations and asymptotic covariance matrix as input for the data analysis. The indices used for the test of goodness of fit of models were: chi-square, comparative fit index (CFI), non-normed fit index (NNFI), and the root mean square error of approximation (RMSEA) with associated confidence intervals (CI). Following the recommendations of Hu and Bentler (1999), a CFI and a NNFI equal or higher than .90 and a RMSEA lower than .08, would indicate a good fit between the hypothesized model and the data. A value lower than 4 or 5 in the chi-square/df ratio was also considered as a sign of good fit (Marsh, Balla, & McDonald, 1988). The standardized root mean squared residual (SRMR) was not considered since it is not recommended with CFA with non-normal data (Finney & DiStefano, 2006). Moreover, the Akaike information criterion (AIC) was also used to select the best fitting model. A smaller AIC value suggests a better model fit (Burnham & Anderson, 1998). Statistical significance of the estimated parameters and interpretability of model parameter estimates were also considered. In order to assess the best factor structure and the role that the effect of the method might present, the percentage of explained common variance (ECV) of the different factors within each model was calculated, following the recommendations by Rodriguez, Reise, and Haviland (2016). After obtaining evidence of the CFA, reliability was calculated for all the models using coefficient H and McDonalds’s omega (McNeish, 2018). The first coefficient takes into account factorial scores and tries to estimate the optimal reliability when the factorial solutions show some low and/or negative factor saturations; the second coefficient takes into account the error variance of the items and offers better estimates than Cronbach alpha (McNeish, 2018). Concurrent validity with other measures was also calculated. The Spearman correlation was used to study the association with other measures, considering the factorial scores obtained for the subscales of the IPVAS-R with the best fitted solution. In order to study the convergent validity of the IPVAS-R, it was calculated with the following variables in sample A: empathy, prosocial conduct, frequency of physical aggression behaviours in general, frequency of verbal aggression behaviours in general, conflict resolution strategies in couples evaluated with the CTS-R (severe physical aggression, medium physical aggression, and psychological aggression) both perpetrated and suffered in the relationship, and satisfaction with the relationship. The correlation of IPVAS subscales with social desirability was also calculated in sample A. In sample B, the subscales obtained were correlated with the following variables: conflict resolution strategies in couples evaluated with the CTS-R (severe physical aggression, medium physical aggression, and psychological aggression) and benevolent and hostile sexism. Table 1 Fit Indices for the Five CFA Competing Models in Both Samples 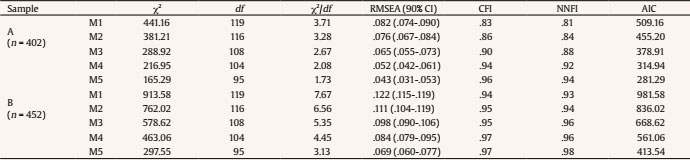 Note. RMSEA = root mean square error of approximation; CI = confidence interval; CFI = comparative fit index; NNFI = non-normed fit index; and AIC = Akaike’s information criterion. It should be noted that there is no a totally discriminating measurement that is not correlated with dating violence and/or its attitudes. However, some measurements are expected to have a closer relationship than others and this will allow us to evaluate the degree of validity of the different subscales. The statistical pack used for the analysis (except the CFA) was SPSS 22.0. IPVAS-R Factor Structure Goodness of fit indices of the different models tested with the CFA are displayed in Table 1 for the two samples. Judging the fit indices as a whole, model 1 (i.e., one generic attitude factor) showed considerably worse fit to the data than all other competing models in both samples (e.g., in sample A, CFI and NNFI were lower than .90 and RMSEA adopted a value above .08; in sample B, RMSEA adopted a value well above .08). In the same way, model 2 (the original three-factor structure) did not show an acceptable fit in both samples although quite better than model 1 (e.g., in sample A, CFI and NNFI adopted values lower than .90; in sample B, RMSEA adopted a value well above .08). Of the three models (models 3, 4, and 5) that tested the wording effect, model 5 (i.e., three factors for subscales, one factor for positive items, and one factor for negative items) showed the best fit to the data. All indices showed an acceptable fit to the data in both samples except for chi-square that should be affected by sample size, model size, and distribution of variables (Hu & Bentler, 1999); all this could influence the high values adopted in our data. However, it should be noted that chi-square/df ratio adopted values lower than 4 for model 5 in both samples. The AIC also indicated a better fit of model 5. This would indicate a significant wording effect on this measurement instrument as a result of the interaction of the items in a positive and negative sense. We then examined the saturations of competing models to assess their quality and interpretability. All models presented non-significant factor loadings, with model 1 having the highest percentage (52.8% in both samples) and model 3 having the least (4.16% in both samples). Likewise, while in sample A all models obtained negative factorial loadings, with model 3 and 5 having the lowest percentage (4.16 and 5.88 % respectively), in sample B only model 2 and 5 obtained negative saturations (5.88 and 17.64 % respectively). Considering the set of factor loadings obtained with the different models and especially those obtained by model 5, our research reveals that the wording effect could be affecting negatively the construct validity of this measurement instrument. After examining the percentage of explained variance of the different models, it was found that in sample A the model with the lowest variance explained was model 1 (11.90%) and the one that explained the highest percentage was model 5 (56.87%). However, it should be noted that models 3 and 4 explain a similar percentage (55.28 and 44.70% respectively). In sample B, it was observed that the model with the least variance explained was model 2 (30.21%) and the model with the greatest variance explained was model 4 (72.79%). It should also be noted that models 3 and 5 explained very similar percentages (72.48 and 63.63% respectively). Considering the percentage of explained common variance (ECV) of the different factors within model 5 (see Table 2), it was observed that in both samples the factor with the highest value was the effect of positive items (around 50%). The effect of the factor of negative items presented a value of 21.39% in sample A and 12.82% in sample B. Considering the effect of the method as a whole, it explains a higher percentage of the ECV than the theoretical factors of the original model (abuse, control, and violence). Table 2 Percentage of Explained Common Variance (ECV) of Factors 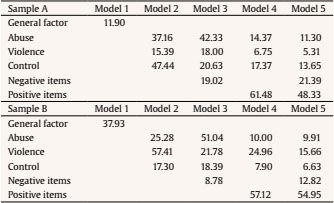 Reliability Table 3 shows the reliability indices (H and McDonalds’ omega) for the different models obtained. Considering both reliability indices, model 3 was the one with the best reliability in all factors in both samples. This suggest that the original subscales (abuse, control, and violence), after controlling the wording effect with model 3 (negative item factor), improved their reliability in both samples. Table 3 Reliability Coefficients (H and McDonalds’s omega) of the Subscales of the Different Models in Both Samples 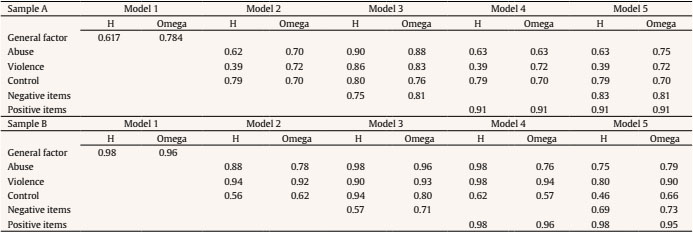 Convergent Validity For the first sample (A), evidence for the convergent validity of the IPVAS was gathered through Spearman’s coefficient between subscales (abuse, control, and violence) and other constructs theoretically related. According to the Table 4, the abuse scale was positive and significantly correlated with social desirability (ρ = .144, p < .01) and medium physical aggression exerted (ρ = .167, p < .01), and negatively related with satisfaction in the relationship (ρ = -.146, p < .05). The control scale was not correlated with any subscale. Finally, the violence scale was significantly correlated with all variables considered in the expected direction except with psychological aggression (exerted and suffered), showing higher correlations with physical aggression exerted and suffered in the relationship, severe physical aggression exerted (ρ = .246, p < .01) and suffered (ρ = .244, p < .01) and medium physical aggression exerted (ρ = .135, p < .05) and suffered (ρ = .191, p < .05). For the second sample (B), the abuse scale was significantly correlated with hostile sexism (ρ = .156, p < .01) and psychological aggression exerted (ρ = -.156, p < .01). This last relationship in the opposite direction to the expected one can be an effect of the presence of some factorial saturations in negative sense in this scale, produced by the interaction between positive and negative items in the factorial solution offered. This could constitute an additional negative impact of the method effect on this scale. The control scale showed significant correlations with all variables except with severe physical aggression suffered, presenting higher correlations with psychological aggression exerted (ρ = .189, p < .05), medium physical aggression exerted (ρ = .253, p < .01) and suffered (ρ = .215, p < .01), hostile sexism (ρ = .275, p < .01), and benevolent sexism (ρ = .216, p < .01); finally, the violence scale was significantly correlated with all variables except with psychological aggression suffered, showing higher correlations with severe physical aggression exerted (ρ = .265, p < .01), medium physical aggression exerted (ρ = .335, p < .05) and suffered (ρ = .284, p < .01), hostile sexism (ρ = .367, p < .01), and benevolent sexism (ρ = .252, p < .01). Table 4 Spearman Correlation Matrix between the Subscales of IPVAS-R (obtained with model 5) and Other Variables for Both Samples 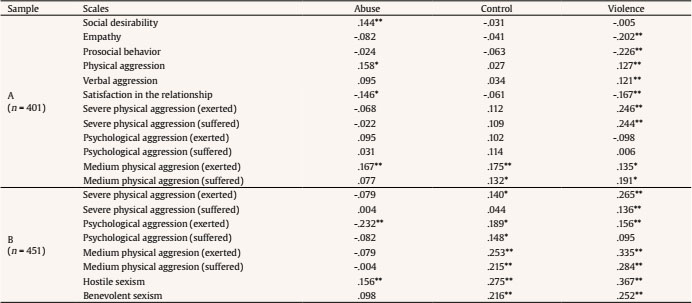 *p < .05, **p < .01 This study tests the psychometric properties of a Spanish adaptation of the Intimate Partner Violence Attitude Scale (Revised) by Fincham et al. (2008). It is assumed that the combination of positive and negative-worded items in an attitude assessment scale could affect respondents’ way of answering (Kamoen, 2012) and present psychometric implications (Suárez-Álvarez et al., 2018). To prove this hypothesis, five competing models were analyzed: one only attitudinal dimension (model 1), the original three-factor structure of this instrument (abuse, control, and violence) (model 2) and three different models to assess the wording effect (models 3, 4, and 5). The results obtained showed that the original structure of three attitudinal factors (abuse, control, and violence) was affected by a method effect. The method effect produced by positive- and negative-worded items on a scale has been widely reported in the literature (e.g., DiStefano & Motl, 2009; Gu et al., 2015; Suárez-Álvarez et al., 2018; Tomás et al., 2013). Moreover, the quality of factorial solutions obtained for this instrument in our study was low, showing cases some non-significant factorial loadings in all cases and some negative in most tested models. In addition, the percentage of explained common variance showed a greater contribution to the method effect factors. The latter would indicate that the degree of acceptance or rejection of dating violence in the wording of attitude items weighs more heavily on the factor structure than its theoretical content. Overall, the results would indicate that the formulation of the items in a positive or negative sense influences a subject’s answers, possibly reducing the validity and reliability of this scale. These findings contradict the previous validation studies that have been done with this instrument, although it is supported by moderate to weak reliability results found in them (Fincham et al., 2008; Toplu Demirta et al., 2017). The reasons for these contradictory results should be considered. One of the reasons could be that the Spanish adaptation of this instrument was not carried out with quality. However, the exhaustive back-translation process adopted makes us doubt this explanation. The second possible and plausible reason could be that the sample of previous studies was made of college students, whereas in our case it included participants from 15 years old and over. However, during the administration of this instrument the researchers were present and the adolescents did not indicate difficulties in the understanding of items, in the same way as in the pilot administration of the instrument that was carried out. Another difference to consider was that the Spanish sample differed considerably from the Turkish and American samples. In this regard, it should be noted that the procedure for sample collection in the American research included the use of incentives for participating in the study. This practice is forbidden by the ethic committee of our university. This could have caused differences in the motivation to answer the questionnaires between the Spanish and the American samples, but it did not help explain differences with the Turkish study. The fourth and most important reason, from our point of view, refers to the differences in the data analysis strategy, along with the non-consideration of the method effect in previous research. Regarding these differences, it should be noted that the exploratory factor analysis carried out in the study 1 by Fincham et al. (2008) used principal component analysis. This technique has been discouraged by experts to validate a measurement instrument because it tends to overestimate latent dimensions (Izquierdo, Olea, & Abad, 2014). Another considerable difference is that the data do not conform to the normal curve in out study and for this reason we have used methods for the CFA appropriated to this casuistry, while in previous studies either data conform to normality or it has not been considered in the analysis strategy, given that no information appears in this regard. Finally, the main difference was that previous studies had not considered the wording effect. Not considering the method effect may give rise to flawed psychometric properties. The characteristics of this instrument with a scale with only positive-worded items (abuse), another scale with only negative-worded items (violence), and another with mixed-worded items (control), makes us suspect a marked wording effect. This research supports such an effect. The special combination of items in a positive and negative sense on this scale would lead to an overestimation of its construct validity and may also be creating a confusing frame of reference for respondents. The convergent validity obtained in our study, after controlling for the wording effect with our factorial solution, showed trends and values similar to those of previous studies (Fincham et al., 2008; Toplu Demirta et al., 2017). This may indicate that the scale might be considered appropriate for assessing attitudes towards dating violence. However, it requires a thorough revision to correct the method effect. Given that acceptance versus justification of dating violence was the reported attitude in most studies (e.g., Fernández-González et al.,2017; O’Keefe, 2005), it would be advisable to rewrite the entire instrument with positive-worded items. Previous studies conducted with self-esteem questionnaires have shown that the formulation of all the items in a positive sense makes the method effect disappear in this measure (Tomás et al., 2013). Likewise, we wish to encourage the revision of the instruments on attitudes towards dating violence, taking into account the wording effect. Attitudes assessment has shown to be sensitive to it (Kamoen, 2012). Although literature recommends the use of inverse items to avoid acquiescence in the answers by subjects using Likert-type answer scales, a recent study shows that this practice is a threat to the reliability and the validity of the measurement (Suárez-Álvarez et al., 2018). According to this last study, this may occur because the understanding of the items and their answers depends on the reading and linguistic understanding skills of the interviewed (Suárez-Álvarez et al., 2018). According to Kamoen’s (2012) research, this is due to the cognitive processes underlying question answering. Our study presented some limitations to consider. The non-use of a representative sample and the self-selection bias due to the use of volunteer participants makes it difficult to generalize the results. Some differences found in the results with the two samples suggest the need to study the factorial invariance of this instrument, which is in turn a limitation of this study. The internal consistency of the social desirability measure, as well as of the subscales of dating violence attitudes (below .70 in some cases), suggests taking the results and conclusions that these measures involve with caution. The different composition of the sample with respect to original studies also suggests age differences, which could recommend an analysis of its factorial invariance based on age. Other random factors due to the set of questionnaires used or the interviewer could be affecting the results found and constitute another limitation. To sum up, our study confirms the starting hypothesis on the influence of the wording effect on the Spanish adaptation of the IPVAS-R. As a conclusion, we would like to highlight the importance of considering the wording effect both in the construction and in the validation of dating violence attitudes’ instruments. Conflict of Interest The authors of this article declare no conflict of interest. Cite this article as: Pastor, Y., Pascual, E., Muñoz, J. J., & Martínez-Bravo, S. (2020). Wording effect in the measurement of attitudes towards dating violence. Psychosocial Intervention, 29, 19-28. https://doi.org/10.5093/pi2019a15 |
Cite this article as: Pastor, Y., Pascual, E., Muñoz, J. J., & Bravo, S. M. (2020). Wording Effect in the Measurement of Attitudes towards Dating Violence. Psychosocial Intervention, 29(1), 19 - 28. https://doi.org/10.5093/pi2019a15
yolanda.pastor@urjc.es Correspondence: yolanda.pastor@urjc.es (Y. Pastor).Copyright © 2026. Colegio Oficial de la Psicología de Madrid


 PDF
PDF e-PUB
e-PUB CrossRef
 JATS
JATS Print
Print Send
Send