
The Bidirectional Relationships between Social Pressure in Digital Contexts, Depression, and Social Support over Time
Hazal Dilan Erdem1, Juan Herrero1, and Alberto Urueña2
1Universidad de Oviedo, Spain; 2Universidad Politécnica de Madrid, Spain
https://doi.org/10.5093/pi2025a15
Received 24 May 2025, Accepted 1 July 2025
Abstract
Objective: As societies become increasingly digitalized, users engage in digital communication flows and participate actively and responsively while managing the demands of constant connectivity. This overwhelming volume of communication can lead to social pressure, which has been associated with compulsive digital behavior and may negatively affect psychological and social adjustment. This study aimed at investigating the longitudinal and bidirectional relationships between social pressure in digital contexts, depressive symptoms, and social support, focusing on how social pressure may affect psychological and social adjustment over time. Method: Previous research on social pressure has mostly relied on cross-sectional or, at best, two-panel cross-lagged designs. In this study, random intercept cross-lagged panel models (RI-CLPMs) were used and a three-wave longitudinal design to examine bidirectional relationships between social pressure, depressive symptoms, and social support in a sample of 1,878 participants that were representative of the Spanish internet population. Results: Our results indicated that increases in social pressure were associated with elevated depressive symptoms and diminished social support over time. Conversely, increases in depressive symptoms and decreases in social support were not associated with changes in social pressure over time. Conclusions: While social pressure in digital contexts had adverse effects on the psychological and social adjustment of users over time (i.e., high depressive symptoms and low social support), it remained unresponsive to variations in users' adjustment over time. These findings underscore the importance of considering the contextual nature of social pressure in digital environments to better inform policy interventions aimed at improving users' digital well-being.
Keywords
Social pressure, Depressive symptoms, Social support, Longitudinal panel design, Nationally representative sample
Cite this article as: Erdem, H. D., Herrero, J., & Urueña, A. (2025). The Bidirectional Relationships between Social Pressure in Digital Contexts, Depression, and Social Support over Time. Psychosocial Intervention, 34(3), 189 - 200. https://doi.org/10.5093/pi2025a15
Correspondence: UO296263@uniovi.es (H. D. Erdem)
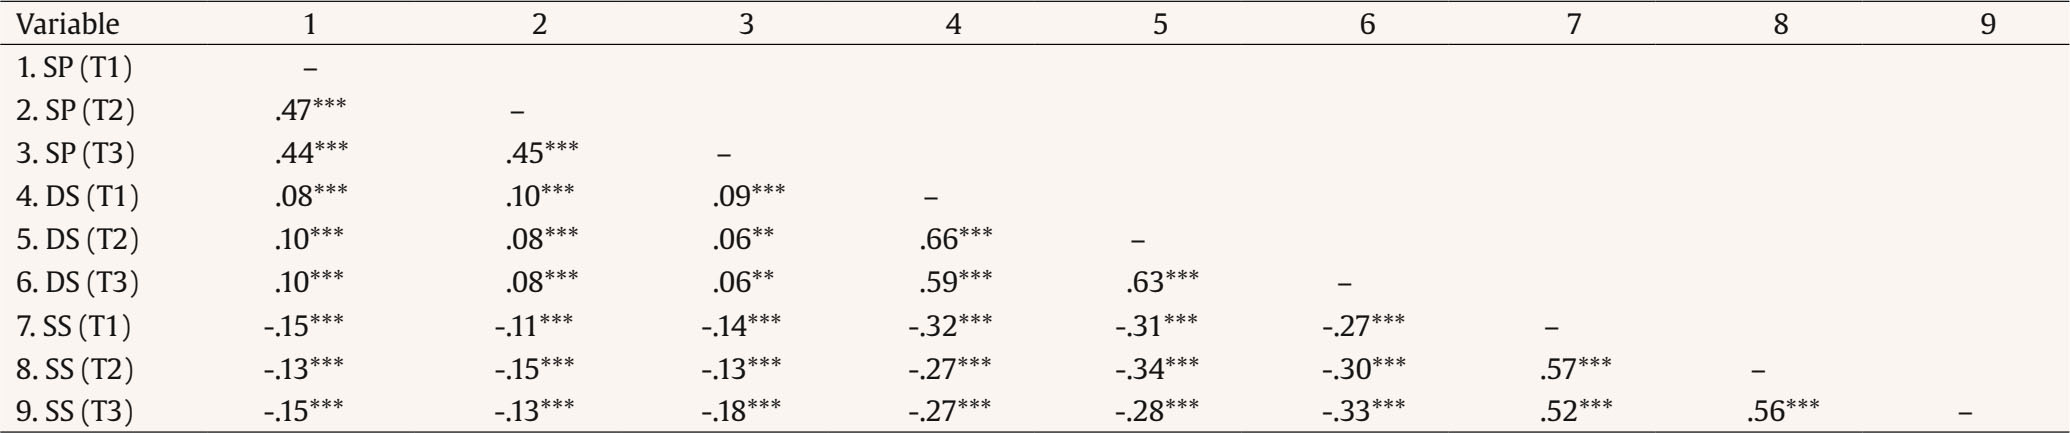
In contemporary, highly digitized societies, users actively and responsively participate in the communication flows that have become ubiquitous in their social digital lives (Halfmann & Rieger, 2019; Herrero et al., 2023; Ling, 2016; Nick et al., 2022; Taylor & Bazarova, 2021). In the context of many users and an overwhelming volume of communication, social pressure can become a significant burden for the individual (Halfmann, 2021). Social pressure in digital contexts is defined as the guilt and distress stemming from the belief that others expect one to always be accessible through digital media (Khetawat & Steele, 2023; Reinecke & Eden, 2017). Users may feel distressed about not meeting the expectations of constant availability from their communication partners, especially when the availability norm is salient, as with pervasive online social engagement (Bayer et al., 2016). These expectations constrain the freedom to refrain from connectivity, as people may experience perceived pressure to check, act, and respond (Vanden Abeele et al., 2018). Some users may experience high levels of pressure to remain connected and socially responsive, affecting their ability to disconnect at will (Büchi, 2024; Dadischeck, 2021; Dennis, 2021; Geber et al., 2023; Johannes et al., 2020; Steele et al., 2020). Social pressure in digital contexts has been particularly examined within the broader scope of digital stress studies. Digital stress is an umbrella concept that encompasses the stress caused by digital communication and reflects the detrimental psychological elements surrounding it, such as connection overload, availability stress (or social pressure), approval anxiety, fear of missing out, and online vigilance (Hall et al., 2021). Stress can be defined as an unfavorable person-environment relationship (Lazarus, 1993) and is perceived when the situational demands tax or exceed the resources of the individual. In the context of pervasive digital interactions, the need of autonomous functioning may conflict with the pressure to conform to social expectations in digital behavior (Halfmann & Rieger, 2019), particularly those stemming from users’ close social ties (Stevic, 2024). In this regard, empirical studies have found that the expectation to respond to one’s online contacts predicts lower psychological well-being (Hall, 2017) and greater dissatisfaction in friendships (Hall & Baym, 2012). Social pressure-related outcomes such as preoccupation with social interactions, content production, and peer monitoring (Stevic, 2024) have been shown to influence active social engagement (Yang, 2022) and social media use (Herrero et al., 2023). While social pressure is experienced and reported by individuals, it is also highly dependent on the digital social context in which they participate (Büchi, 2024; Herrero et al., 2022). In digital social contexts, social pressure reflects the norm or perceived societal expectations to function digitally and to be able to manage the everyday challenges of digital media. As a contextual variable, it concerns the practical relevance of digital overabundance to one’s everyday life (Büchi et al., 2019). The capacity of social pressure to enhance digital practices (Büchi et al., 2019; Herrero et al., 2021; Stevic, 2024) has prompted researchers to argue that it may also be associated with adverse outcomes, such as digital overuse or even technological addiction (Büchi et al., 2019; Halfmann, 2021; Herrero et al., 2021). Moreover, social pressure has been linked to negative effects on users’ psychological and social adjustment (Halfmann & Rieger, 2019; Hall et al., 2021; Nick et al., 2022; Reinecke et al., 2017; Steele et al., 2020). Social Pressure and Depressive Symptoms Social pressure has been conceptualized in digital interactions as a distressing experience arising from users’ aversive sentiments about disappointing their communication partners (Bayer et al., 2016). This theoretical framework highlights the potential psychological distress exhibited by users under conditions of heightened social pressure. There is compelling indirect evidence suggesting that social pressure may act as a predisposing factor for increased depression over time (Heffer et al., 2019; Herrero et al., 2023; Stevic, 2024). These findings lead to the formulation of our first hypothesis: an increase in social pressure will precipitate an increase in depressive symptoms over time (H1). Less research has examined social pressure as an outcome variable. While some users may engage in digital social interaction (high social pressure) to alleviate their depression (Busch & McCarthy, 2021), other users may adopt a contrasting approach by avoiding digital social exchange (low social pressure) (Yuan et al., 2021). Recent findings, however, suggest that psychological distress (i.e., depressive symptoms) may increase media use and social pressure. Jarman et al. (2023) found that social media use, which is related to increased social pressure, was positively affected by psychological distress with a one-year lag (i.e., higher levels of psychological distress predicted higher levels of social media use after one year). One possible explanation is that depressive symptomatology is predictive of feedback seeking and social comparison over time (Nesi & Prinstein, 2015), two outcomes that are also associated with increased media use and higher social pressure (Yang, 2021). Thus, we propose our second hypothesis: depressive symptomatology will increase social pressure over time (H2). Social Support and Social Pressure “Social pressure” is a term used to describe the social interactions that occur within digital contexts. Some authors have drawn attention to the contextual nature of social pressure (e.g., Büchi, 2024; Herrero et al., 2023), and it seems reasonable to posit that digital social contexts characterized by social pressure may not be perceived as supportive by individuals. Accordingly, digital social pressure is expected to have a negative impact on perceived social support over time, particularly when that support is provided by close ties (Stevic, 2024), as also indicated by empirical research (Hall, 2017; Qiu et al., 2024; C. C. Yang et al., 2021). Thus, we propose our third hypothesis: social pressure will result in a reduction in social support over time (H3). Conversely, users with limited social support may seek to augment their social connections through social media use, potentially leading to engagement in highly demanding digital social contexts. Conceptual frameworks, such as the Compensatory Internet Use Theory, posit that individuals lacking social support often turn to digital overuse to escape distress (Kardefelt-Winther, 2014). The empirical literature has found that low levels of social support are associated with increased digital engagement (Zhao et al., 2024). This engagement is also driven by the pursuit of reassurance in affective and close relationships and is typically linked to elevated degrees of social pressure (Herrero, Torres, et al., 2019). From this perspective, low social support may be empirically associated with heightened social pressure in digital contexts. Accordingly, we propose our fourth hypothesis: low social support will increase social pressure over time (H4). The Present Study The existing literature on social pressure in digital contexts and psychological and social adjustment has discussed the negative role of social pressure in poor mental health (e.g., depression) and low social connectedness (e.g. social support) (Khetawat & Steele, 2023; Valkenburg, 2022; Valkenburg et al., 2022). Social pressure in digital contexts has been identified as a contributing factor to these outcomes through its impact on digital overuse (Gui & Büchi, 2019; Khetawat & Steele, 2023; Nick et al., 2022) and smartphone addiction (Herrero et al., 2023), which are strongly associated with poor psychological and social adjustment (see the following reviews: Augner et al., 2023; Bottaro & Faraci, 2022; Busch & McCarthy, 2021; Elhai et al., 2017; Hancock et al., 2022). Most research on social digital pressure and psychological and social adjustment originates from the field of digital stress studies. Within this domain, significant attention has focused on the psychological and social ramifications of social pressure in the context of addictive or problematic internet use. Moreover, the predominant focus of this research has been on adolescent and young adult populations, with comparatively limited scholarly attention directed toward adults. Methodological approaches employed thus far have primarily consisted of cross-sectional designs or, at most, two-panel cross-lagged studies. There is a paucity of longitudinal panel research designs, with only a few exceptions. This limitation has impeded the advancement of this specific field of inquiry. Longitudinal panel studies offer distinct advantages over cross-sectional studies, particularly when an appropriate methodological approach is employed. They allow for testing the presence and magnitude of effects that changes in one variable have on changes in another over time. This approach is especially well suited for the analysis of bidirectional effects of social pressure in digital contexts, depression, and social support. As highlighted in recent literature on the cross-lagged panel model (CLPM), at least two types of influences must be considered when accounting for relationships across time. First, a positive relationship between social pressure, social support, and depressive symptoms may indicate that individuals with higher scores on social pressure exhibited lower scores on social support and higher scores on depressive symptoms than their counterparts over time (between-subjects variation). Second, it may also indicate that individuals with increased social pressure also exhibited decreased social support and increased depressive symptoms over time (within-subjects variation). In the absence of decomposition of between-subjects and within-subjects variation, these relationships will remain indistinguishable in CLPM (Hamaker, 2023; Hamaker et al., 2015; Lucas, 2023). To account for this methodological limitation, the present study employed the Random Intercept Cross-lagged Panel Model (RI-CLPM) for a comprehensive examination of both between- and within-subject associations among the variables under investigation. RI-CLPM decomposes between- and within-subject associations, thereby allowing for more precise inferences regarding the two distinct types of covariation. Further, this methodology enables the interpretation of within-subjects cross-lagged estimates for each individual as the effect of the variation of an x variable at t-1 in the variation on a y variable at t, while accounting for the effect of y at t-1 on y at t. In other words, while there may be an inertia in y to maintain constant levels over time (i.e., a carry-over effect), changes in x are related to changes in y over time (i.e., a spill-over effect), despite the observed inertia of y across time (Usami, 2021). This feature renders RI-CLPM a more appropriate analytical approach for examining the effects of variables over time, as compared to traditional CLPM (Hamaker, 2023). We included digital overuse in our RI-CLPMs as a control variable to account for its statistical association with social pressure in digital contexts, social support, and depressive symptoms over time. The association between social pressure in digital contexts and increased digital overuse has been identified as a potential predictor of poor psychological and social adjustment, including elevated rates of depressive symptoms and reduced social support (Herrero et al., 2022). To account for the specific effect of social pressure on psychosocial well-being, however, it was necessary to control for the confounding effect of digital overuse. Participants We used data from three longitudinal panels from the Cybersecurity and Confidence in Spanish Households national survey (CCSHNS) conducted by the National Observatory of Telecommunications and Information Society of the Spanish Ministry of Industry (see Herrero et al., 2021; Herrero, Urueña, et al., 2019; Urueña et al., 2019, for a detailed description). Data were collected in 2021 and the first semester of 2022. Participants belonged to a representative sample of Spanish population of internet users aged 15 and over. A total of 2,837 participants responded to the study variables at T1, of whom 1,878 provided self-reported data at all time points (T1 to T3). Procedure The primary sampling units were households, and the secondary sampling units were individuals within households. First, a representative Spanish sample of households was selected based on autonomous communities, size of locality, social class, and number of persons in the household. Second, internet users over the age of 14 within households were identified and selected. The survey was conducted every six months. These six months were considered adequate to observe changes in the variables over time (Dormann & Griffith, 2015), as supported by previous research (Auerbach et al., 2011; Trepte et al., 2014; Yu et al., 2024). Variables and Scales Social Pressure We used the 3-item Social Digital Pressure Scale (Gui & Buchi, 2019) that measures the following three indicators: 1) social pressure to respond quickly to communication (in my everyday life people expect that I reply quickly to messages), 2) social expectations of digital skills (in my everyday life people expect that I am capable of using various internet applications), and 3) expectations of online social presence (in my everyday life people expect me to be active on social networking sites). High scores on the SDP scale have been found to be significantly associated with higher levels of digital overuse, more frequent use of social and communication applications, certain personality traits (openness and extraversion), higher levels of depression, and lower levels of social support (Büchi et al., 2019; Gui & Büchi, 2019; Herrero et al., 2023; Herrero et al., 2021; Herrero, Urueña, et al., 2019). Responses ranged from 1 completely disagree to 5 completely agree. Items were averaged for each three waves. Social pressure was measured at T1, T2, and T3. Descritive statistics were: T1 (M = 3.42, SD = 0.80), T2 (M = 3.44, SD = 0.81), and T3 (M = 3.44, SD = 0.77). The scale showed a good internal consistency, with Cronbach’s alpha greater than .78 at all three time points. Depressive Symptomatology A 7-item version of the Center for Epidemiologic Studies Depression (CESD; Herrero & Gracia, 2007; Juarros-Basterretxea et al., 2021) was used in our study. The CESD is a validated self-report scale that is designed to measure depressive symptoms in the general population. Items referred to experiences over the past week (e.g., “I felt that I could not shake off the blues even with the help of my family or friends”). Category responses ranged from 1 = rarely/never to 4 = all or most of the time. Depressive symptomatology was measured at T1 (M = 1.84, SD = 0.65), T2 (M = 1.85, SD = 0.63), and T3 (M = 1.83, SD = 0.63). Cronbach’s alpha was greater than .80 at all three time points, indicating adequate internal consistency. Social Support We used the Strong-Tie Support Scale (Lin et al., 1981) to measure social support from intimate and confidant relationships, using three items on a five-point scale from 1 never to 5 most of the time. The three items refer to 1 (close companion), 2 (family), and 3 (friends). The scale represents the extent to which respondents felt their support needs were met by their close companions, and is a highly recommended measure of social support for large surveys (Herrero et al., 2011). Social support was measured at T1 (M = 3.70, SD = 0.86), T2 (M = 3.72, SD = 0.88), and T3 (M = 3.62, SD = 0.63). The scale showed adequate internal consistency (Cronbach’s α ≥ .69 at all three time points). Sociodemographics Sex (male 46%, female 54%), age (five age groups from 1 = 15 to 24 years to 5 = more than 55 years (M = 3.39, SD = 1.05), educational background (from 1 = elementary to 3 = university studies) (M = 2.51, SD = 0.52). Sociodemographics were measured at T1. Control Variable Digital Overuse Eight items from the Smartphone Addiction Symptoms Scale (SAPS; Bian & Leung, 2015) were used in this study. These selected items are the most conceptually equivalent to Young’s screening instrument for internet addiction (Bian & Leung, 2015; Young, 1998). For each item, responses were rated on a five-point scale from 1 = not true to 5 = extremely true. Responses of 4 (true) or 5 (extremely true) were dichotomized to 1; all other response categories were coded as 0. The items were summed (M = 1.63, SD = 0.94) (Cronbach’s α = .85). Digital overuse was measured at T1. Table 1 Summary of the Fit of RI-CLPMs (N = 1,878) 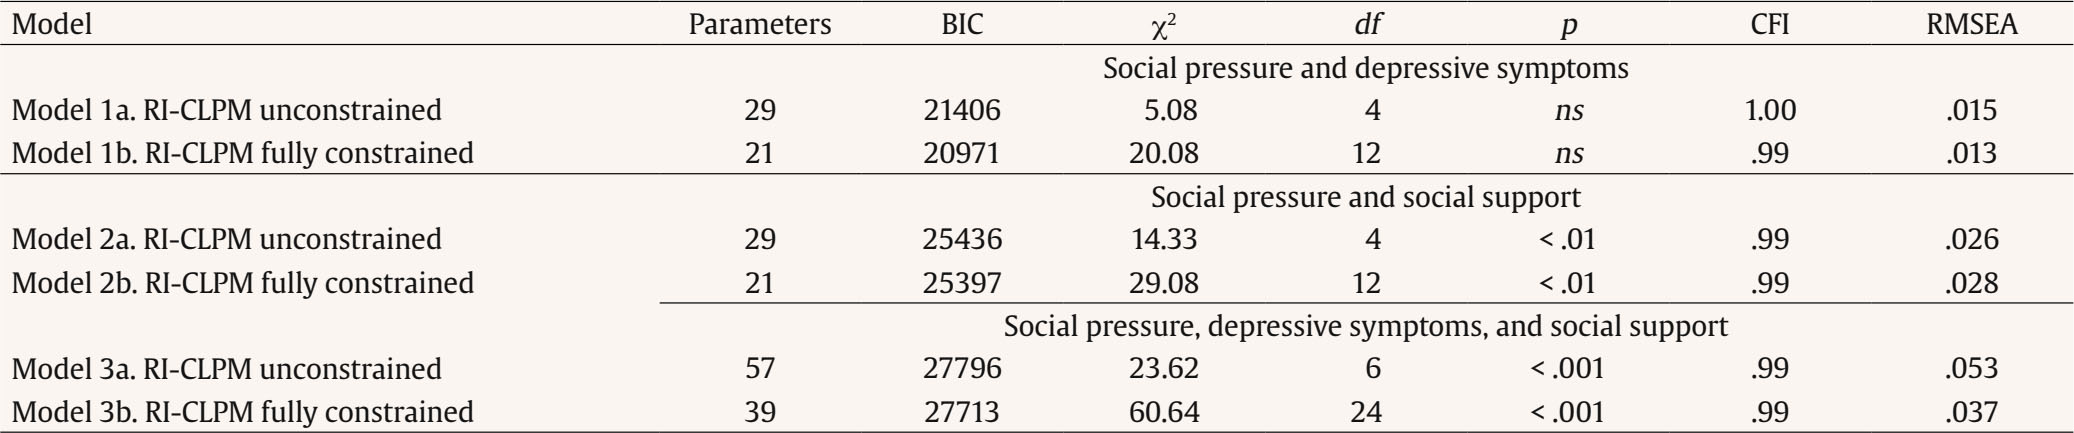 Analytical Strategy RI-CLPMs were estimated to examine the relationships among variables over time. The RI-CLPM is an extension of the CLPM that accounts for stable, between-unit differences in the data. The RI-CLPM decomposes a participant’s x score at time t into three components: the group mean of x at a given time (e.g., T1); the stable, time-invariant, trait-like deviation from the group mean, represented by the latent random intercept; and the deviation of each participant at a given time (Usami, 2023). Within-subjects autoregressive coefficients of an x variable from t-1 to t are interpreted as the change in that variable at t due to the change at t-1. On the other hand, within-subjects cross-lagged coefficients of a variable x at t-1 on a variable y at t are interpreted as the change in y at t due to the change in x at t-1. Thus, in the RI-CLPM, autoregressive effects are interpreted as purely within-unit effects and carryover, while cross-lagged effects are interpreted as within-unit effects or spillover from one domain to another. A series of RI-CLPMs were estimated. First, RI-CLPMs were estimated for social pressure and depressive symptoms (Model 1), social pressure and social support (Model 2), and social pressure, depressive symptoms and social support (Model 3). In these initial models, autoregression and cross-lagged paths were freely estimated (Unconstrained Models 1a, 2a, and 3a). Second, in these models, autoregressive and cross-lagged paths were fully constrained to be equal over time (Fully Constrained Models 1b, 2b, and 3b). All models incorporated digital overuse as a control variable. The chi-square value and associated probability for degrees of freedom, in conjunction with the CFI (comparative fit index) and RMSEA (root rean square error of approximation) indices, were employed to evaluate the model fit. Models with a non-significant chi-square value were considered to have an excellent fit, while models with a CFI value exceeding .95 and an RMSEA value below .05 were also considered to indicate an adequate fit to the data. Additionally, we conducted a comparative analysis of the unconstrained and fully constrained versions of each model, employing a range of model comparison strategies documented in the literature. The most plausible model was selected based on the Bayesian information criterion (BIC) and the likelihood ratio test (LRT). BIC introduces a penalty for the number of parameters in a model, thereby enabling the selection between over-parameterized and less-parameterized models. Models with a lower BIC were preferred over models with a higher BIC. The LRT enables the statistical evaluation of whether the elevated chi-square value of a less parameterized model (fully constrained) is not statistically significant in comparison to a more parameterized nested model (unconstrained). In the event of a non-significant LRT, the fully constrained and unconstrained models are statistically equivalent. Consequently, the fully constrained nested model, which has fewer estimated parameters, is preferred. The statistical significance of path coefficients was evaluated with the bias-corrected bootstrap at 95% confidence intervals. We used full information maximum likelihood estimates and 5,000 bootstrap samples to calculate bias-corrected standard errors. All models were estimated with Mplus 8.7 (Muthén & Muthén, 2017) software. Attrition Analyses The results of the attrition analysis indicated that participants who remained in the study exhibited notable differences from those who withdrew from the study, particularly in the primary variables investigated: social pressure, social support, and depressive symptoms. The multivariate analysis of variance (MANOVA) revealed significant baseline differences (T1) in social pressure, depressive symptoms, and social support between participants who remained in the study and those who dropped out (Wilks’ λ = .99, F = 8.09, p < .001, partial η2 = .008). The results of the univariate analyses of variance (ANOVA) indicated that dropouts self-reported higher levels of depressive symptoms (Mnon-dropouts = 1.81, Mdropouts = 1.91; F = 6.96, p < .010) and lower levels of social support (Mnon-dropouts = 3.60, Mdropouts = 3.45; F = 14.91, p < .001) at T1. There was no significant difference between the levels of social pressure exhibited by dropouts and non-dropouts at T1 (F = 1.73, ns). Dropouts scored higher on digital overuse than non-dropouts at T1 (Mnon-dropouts = 1.47, Mdropouts = 1.95; F = 29.34, p < .001). As for the sociodemographic and response bias variables, dropouts appeared to be younger than non-dropouts (Mnon-dropouts = 3.19, Mdropouts = 3.16; F = 10.18, p < .001), quite similar across sex (χ2 = 2.95, ns) and education levels (F = 2.38, ns). The study revealed that individuals who dropped out reported poorer psychological and social adjustment (i.e., higher depressive symptoms and lower social support), higher digital overuse, and were younger compared to those who remained in the study. Estimation of RI-CLPMs Table 1 presents a summary of the fit indices for the estimated RI-CLPMs. A general inspection of Table 1 suggests that all estimated models demonstrated an adequate fit, based on the CFI and RMSEA indices. The CFIs were in the upper end (≥ .99), and the RMSEAs were ≤ .050, except for one model (RI-CLPM unconstrained for social pressure, depressive symptoms, and social support), which slightly exceeded the recommended threshold. All these models demonstrated an adequate reproduction of the variance-covariance matrix of the data. The models that incorporated the sociodemographic variables of personality and response bias as covariates yielded coefficients that were highly analogous to those of the models that did not include these covariates. For the sake of brevity, the results of the models excluding these covariates are presented. Social Pressure and Depressive Symptoms According to the results in Table 1, the unconstrained RI-CLPM of social pressure and depressive symptoms (Model 1a) provided an excellent fit to the data (χ2 = 5.08, df = 4, p < .05, CFI = 1.00, RMSEA = .015). However, the fully constrained model (Model 1b) was statistically equivalent according to the LRT results (χ2 = 15.00, df = 8, p > .05), while estimating fewer parameters and having a lower BIC. Therefore, the fully constrained Model 1b was retained for further analysis. Social Pressure and Social Support According to the results in Table 1, the unconstrained RI-CLPM of social pressure and social support (Model 2a) provided a good fit to the data (χ2 = 14.33, df = 4, p = .006, CFI = .99, RMSEA = .026). This model was over-parameterized (with 29 free parameters and low degrees of freedom) and was statistically equivalent to the fully constrained model (Model 2b), according to the LRT results (χ2 = 14.75, df = 8, p > .05). The fully constrained Model 2b also demonstrated a good fit to the data, involved fewer estimated parameters, and had a lower BIC; it was therefore selected for further examination. Social Pressure, Depressive Symptoms, and Social Support Although the unconstrained RI-CLPM (Model 3a) demonstrated a satisfactory fit to the data (χ2 = 23.62, df = 6, p = .006, CFI = .99, RMSEA = 0.053), the fully constrained RI-CLPM (Model 3b) was found to be statistically equivalent based on the likelihood ratio test (LRT) results (χ2 = 37.02, df = 18, p > .05). Additionally, Model 3b estimated fewer parameters and had a lower Bayesian Information Criterion (BIC). This fully constrained model was retained for further analysis. The presentation of results for these models is simplified due to the imposition of constraints on both the autoregressive and cross-lagged paths, which were required to be equal in each model. In Models 1b, 2b, and 3b, the covariate digital overuse significantly affected social pressure (.20 ≥ βs ≤ .27), depressive symptoms (.14 ≥ βs ≤ .20), and social support (-.19 ≥ βs ≤ -.14), across the three-time measurements. After statistically controlling for digital overuse, these coefficients represent the relationships among the study variables while accounting for baseline levels of self-reported digital overuse (i.e., smartphone addiction) at T1. Table 2 presents the unstandardized parameter estimates with bias-corrected bootstrapped 95% confidence intervals under maximum likelihood estimation. To facilitate the interpretation of the results, the standardized coefficients are presented in Figure 1 and discussed in the text. The results from Model 3b are presented first. Table 2 Unstandardized Parameter Estimates and Bias-Corrected Bootstrapped 95% Confidence Intervals for Between- and Within-Subjects Effects in Final Models 1b and 2b (N = 1,878) 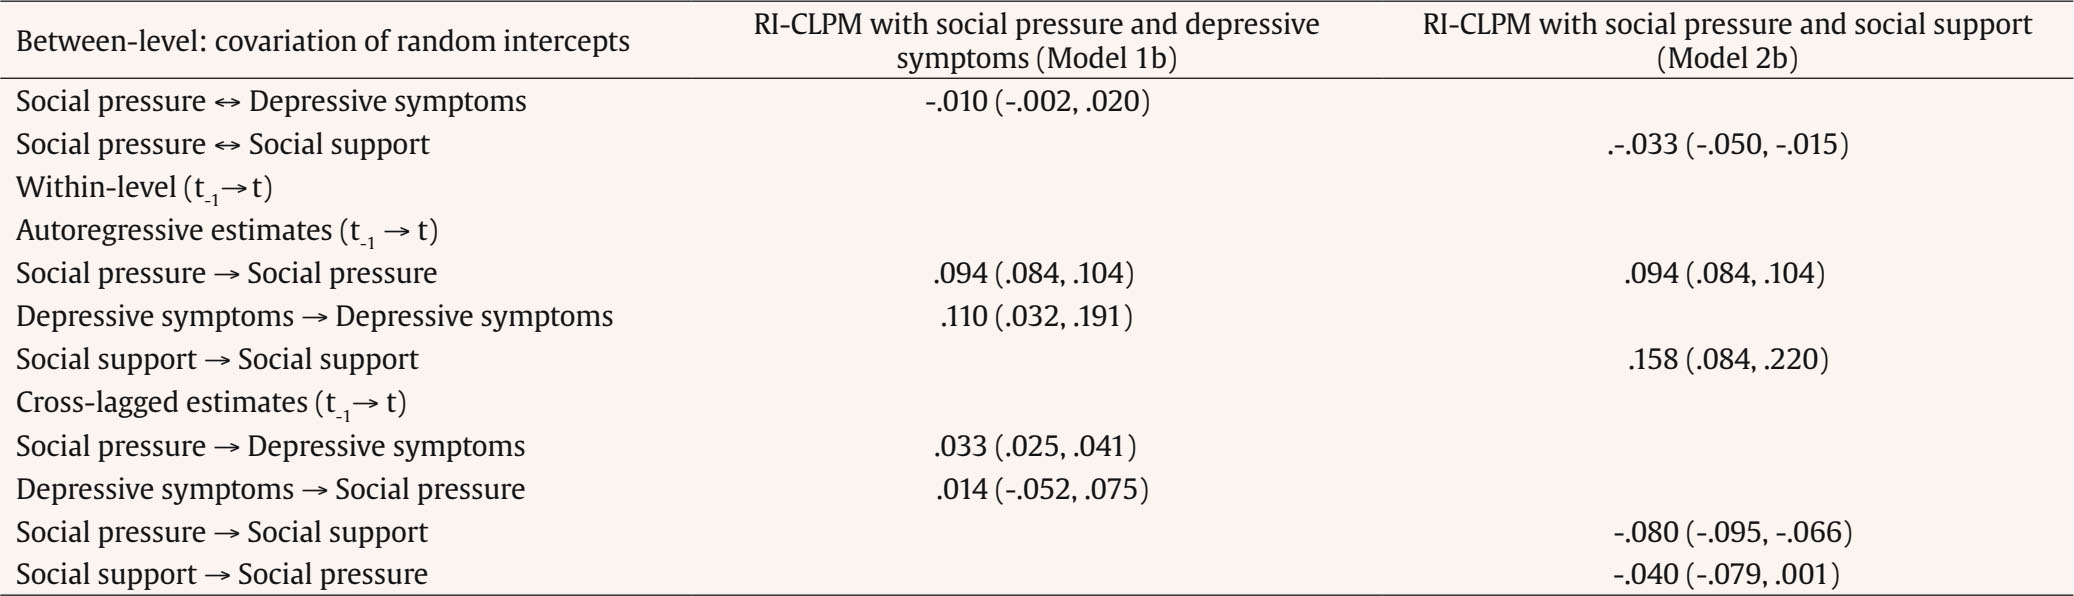 Note. The (↔) represents correlation or bidirectional relationships, while the (→) indicates unidirectional prediction from t-1 to t. Model 3b. In this model, a non-significant association between the latent trait-like factors of social pressure and depressive symptoms (-.001, 95% bias-corrected CI [-.008, .025], r = -.04, ns), a negative significant association between social pressure and social support (-.036, 95% bias-corrected CI [-.060, -.012], r = -.13, p < .01), and depressive symptoms and social support (-.117, 95% bias-corrected CI [-.137, -.097], r = -.45, p < .001) were found. Participants who scored higher on social pressure also tended to score similarly on the depression scale but lower on social support compared to their counterparts. Participants with higher depressive symptoms also scored lower on social support than their counterparts. This between-subject covariation was removed from the total covariation among the study variables, which enabled the estimation and analysis of the within-subjects effects. The carry-over effects of social pressure (from t-1 to t) (.075, 95% bias-corrected CI [.001, .150], β = .07, p < .05), depressive symptoms (.272, 95% bias-corrected CI [.184, .360], β = .27, p < .001), and social support (.078, 95% bias-corrected CI [.001, .160], β = .09, p < .05) were positive and significant. The cross-lagged paths of social pressure-depressive symptoms from t-1 to t were positive and statistically significant (.047, 95% bias-corrected CI [.016, .078] β = .07, p < .01), indicating a spill-over effect of social pressure on depressive symptoms over time. The cross-lagged paths of social pressure-social support were non-significant (-.003, 95% bias-corrected CI [-.067, .050], β = -.01, ns). Social pressure increased depressive symptoms over time but did not affect social support over time. The cross-lagged paths of depressive symptoms-social pressure from t-1 to t were positive and statistically significant (.093, 95% bias-corrected CI [.077, .108], β = .07, p < .05), whereas the paths of social support-social pressure from t-1 to t were not statistically significant (.020, 95% bias-corrected CI [-.021, .104], β = .02, ns). Depressive symptoms increased social pressure over time but social support did not affect social pressure over time. The cross-lagged paths of social support-depressive symptoms from t-1 to t were positive and statistically significant (.041, 95% bias-corrected CI [.029, .053], β = .06, p < .01), suggesting a spill-over effect of social support on depressive symptoms over time. The cross-lagged paths of depressive symptoms-social support were negative and statistically significant (-.085, 95% bias-corrected CI [-.103, -.067], β = -.07, p < .01). Social support increased depressive symptoms over time, while depressive symptoms decreased social support over time. The findings of Model 3b indicated that social support increased depressive symptoms over time, while depressive symptoms decreased social support over time. These results were conceptually inconsistent with the extensive literature on social support and depression across the lifespan over the past five decades (Geoffrey et al., 2024; Magalhães, 2024; Rueger, 2016; Werner-Seidler et al., 2017). Furthermore, an examination of the zero-order correlation matrix among the study variables (see Appendix) revealed an unexpected positive relationship between social support and depressive symptomatology over time, as reflected by Model 3b. Correlations of social support at t-1 with depressive symptomatology at t were found to be consistently negative and highly significant (rs = -.27, ps < .001). The family of Models 1, 2, and 3 were not statistically comparable through LRT, since they were not nested models, and Model 3b was found to be highly inconsistent with the available theory. This model included the estimation of three latent factors and a large number of autoregressive and cross-lagged within-subjects relationships, which may have exerted a detrimental effect on parameter estimation. The limited number of time points available might have adversely affected the parameter estimates, potentially due to the relatively low number of within-cluster observations (i.e., three time measurements per participant). As recently observed by Murayama and Gfrörer (2024), when the data set is limited and does not contain much information (e.g., a few time measurements), complex RI-CLPMs may not be the optimal choice due to inherent limitations such as parameter estimate instability and biased standard errors. Models 1b and 2b, which were considerably simpler, provided a clearer picture of the relationships between the study variables. Table 2 presents the unstandardized estimates and the bootstrapped bias-corrected 95% confidence intervals, and Figure 1 presents the standardized regression coefficients. Figure 1 Standardized Parameter Estimates for the RI-CLPM Models 1b and 2b (N = 1,878). 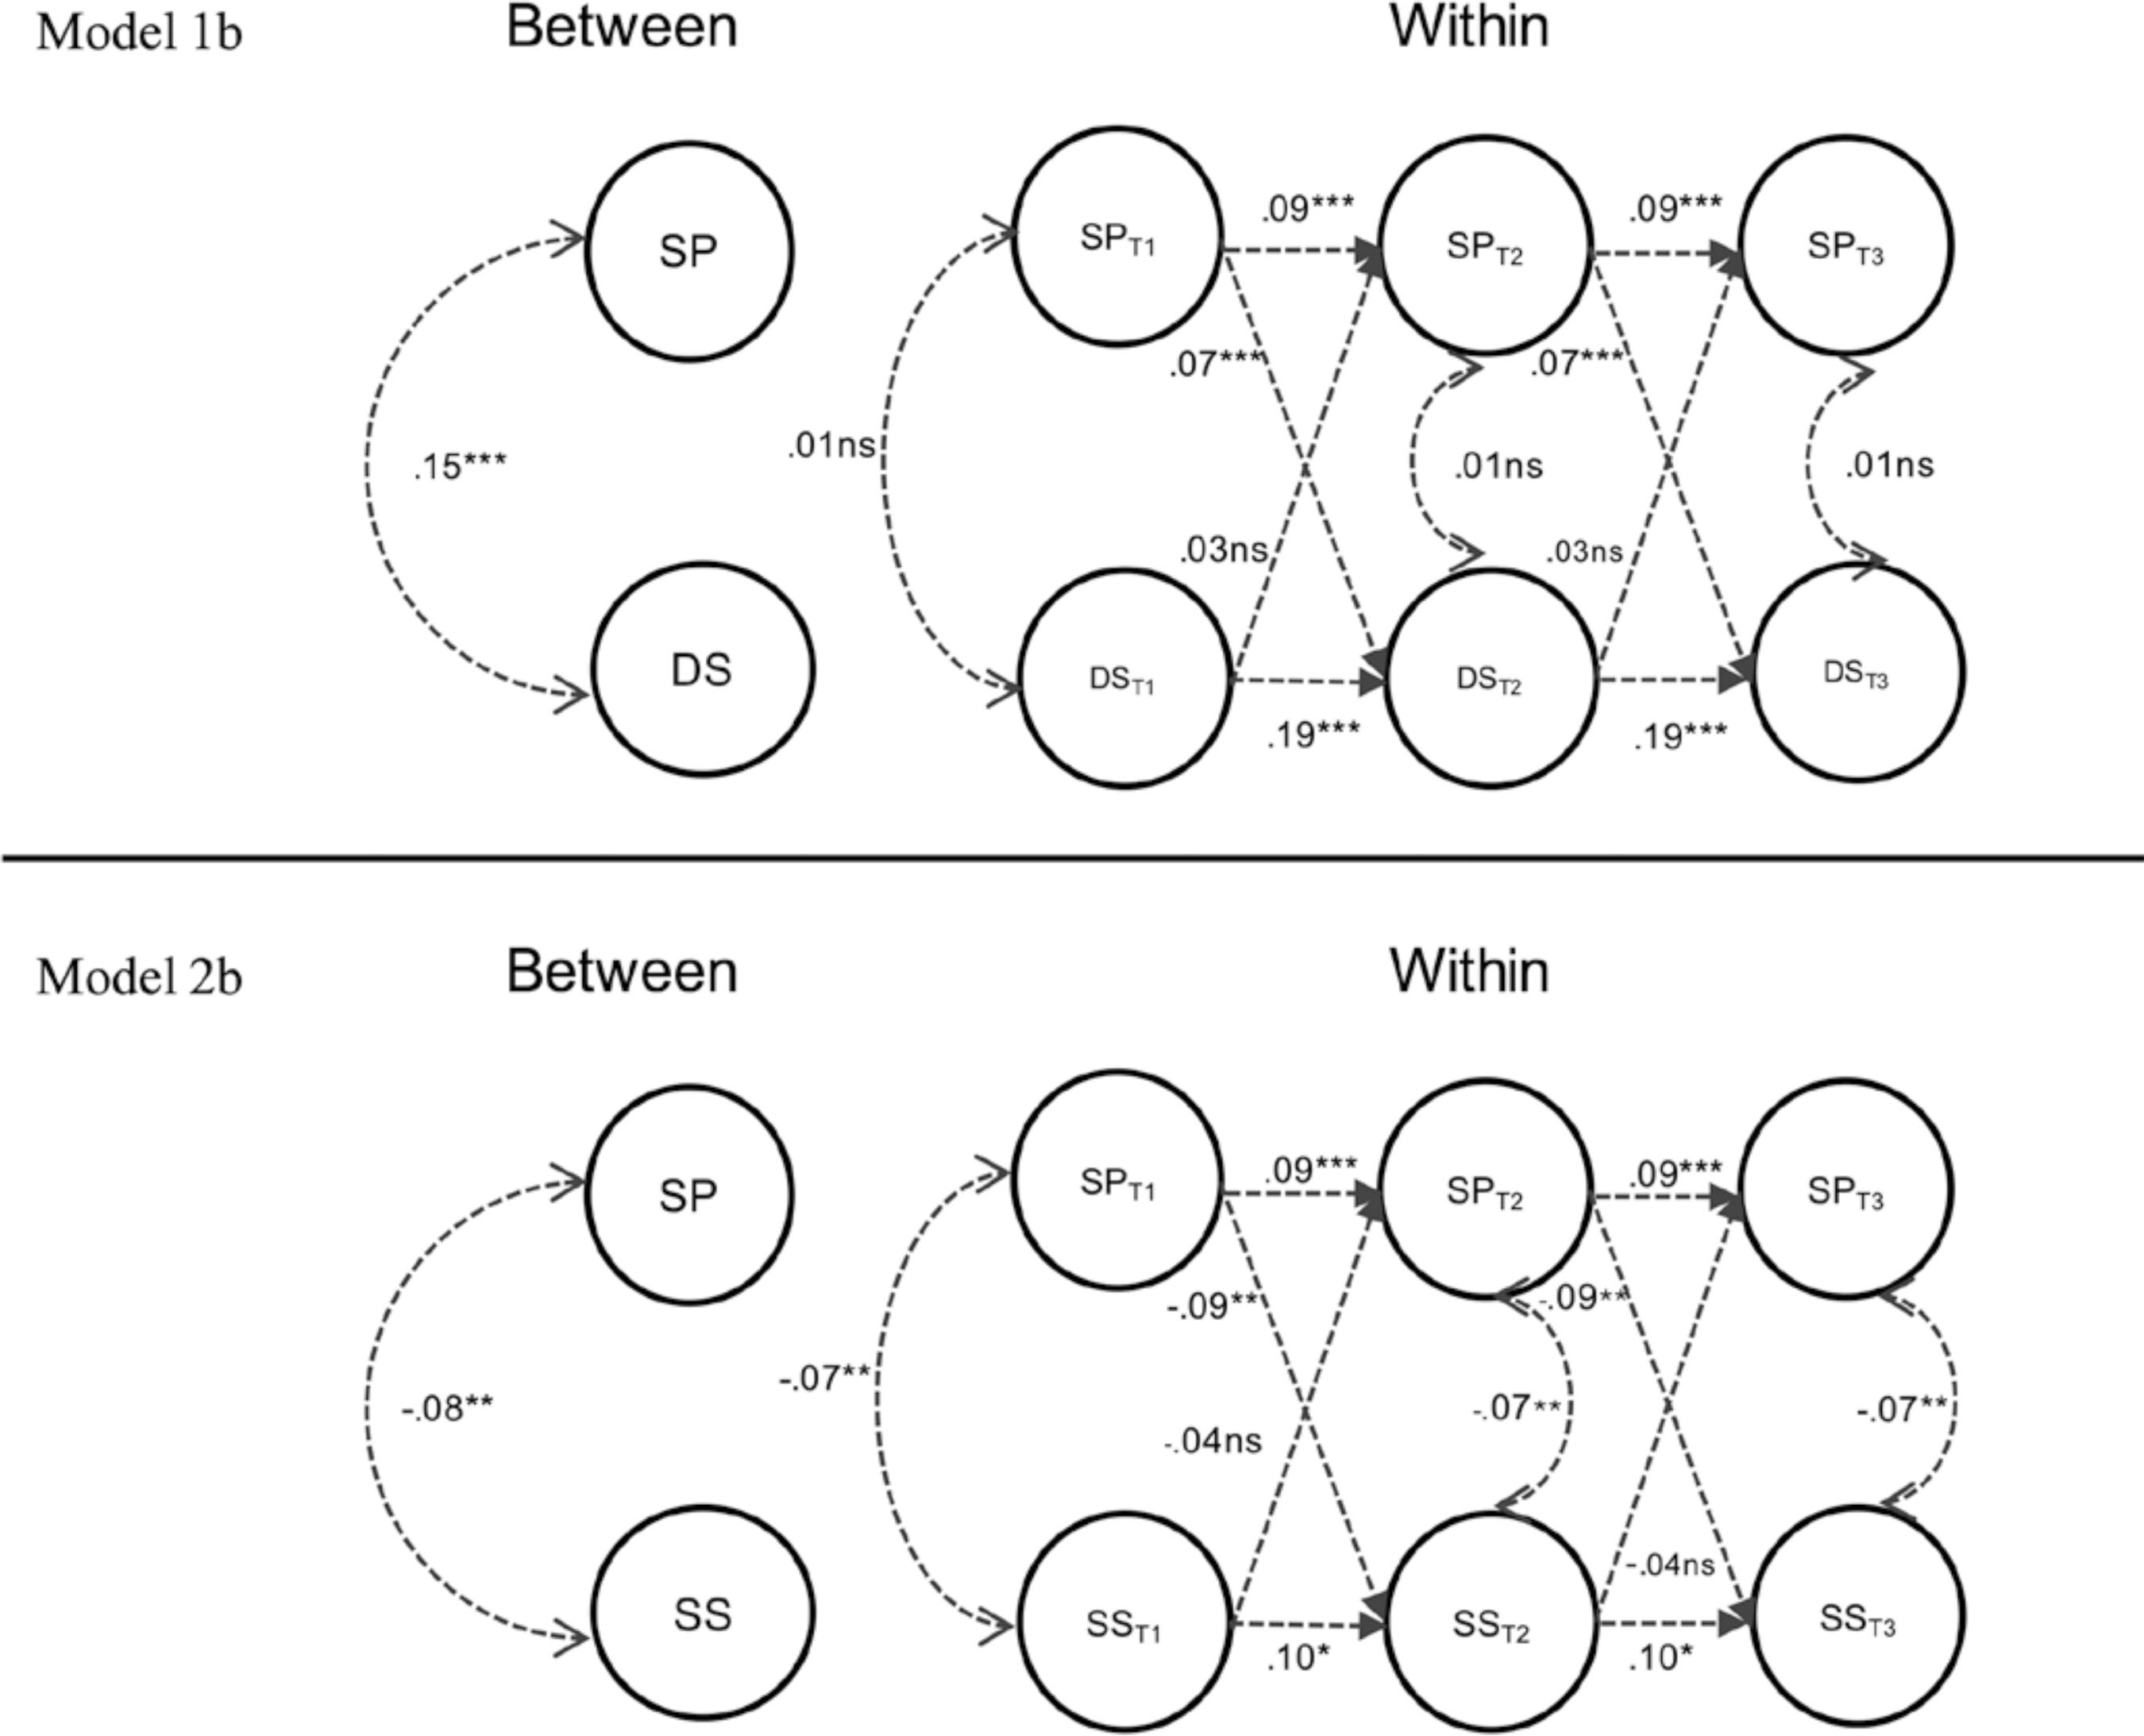 Note. SP = social pressure; DS = depressive symptoms; SS = social support. *p < .05, **p < .01, ***p < .001, ns = non-significant. Model 1b. The RI-CLPM of the Relationship between Social Pressure and Depressive Symptoms. The model estimated a statistically significant between-subjects association between the latent trait-like factors of social pressure and depressive symptoms (r = .15, p < .01). Participants who scored higher on the social pressure scored higher on the depressive symptoms scale than their counterparts. Within-subjects lagged paths of social pressure from t-1 to t were estimated after statistically removing the between-subjects association between social pressure and depressive symptoms. These paths were positive and statistically significant (β = .09, p < .001), indicating a carry-over effect of social pressure over time. The magnitude of this path coefficient was identical to that observed in Model 2b. The carry-over effect of depressive symptoms was positive and significant (β = .19, p < .001). Higher-than-expected levels of social pressure and depressive symptoms at t-1 were followed by higher-than-expected levels of social pressure and depressive symptoms at t, respectively. The cross-lagged effects of social pressure at t-1 on depressive symptoms at t were positive and statistically significant (β = .07, p < .001). In contrast, the cross-lagged effects of depressive symptoms at t-1 on social pressure at t were positive and non-significant (β = .03, ns). Increases in social pressure at t-1 were significantly associated with increases in depressive symptoms at t. However, increases in depressive symptoms at t-1 did not result in corresponding changes in social pressure levels at t. Finally, within-subject correlations of social pressure and depressive symptoms showed that both measures were not significantly correlated within waves (rs = .01, ns). Therefore, after the consideration of within-subjects autoregressive and cross-lagged effects of social pressure and depressive symptoms over time, the covariation within each wave of social pressure and depressive symptoms was found to be nearly zero. Therefore, although the within-wave association was estimated to be zero, their cross-lagged associations were statistically significant. These findings underscore the value of longitudinal data in capturing temporal dynamics between variables that may not be evident in cross-sectional analyses. There appeared to be a temporal relationship between social pressure and depressive symptoms, with social pressure affecting depressive symptoms over time. However, depressive symptoms did not affect social pressure over time. Model 2b. The RI-CLPM of the Relationship between Social Pressure and Social Support. The results indicated a statistically significant negative association between the trait-like latent factors for social pressure and social support (r = -.08, p < .01). Participants scoring higher on social pressure scored lower on social support compared to their counterparts. The within-subjects paths of social pressure from t-1 to t were positive and statistically significant (β = .09, p < .001), indicating a carry-over effect of social pressure over time. Similarly, the carry-over effect for social support was positive and significant (β = .10, p < .001). Higher-than-expected levels of social pressure and social support at t-1 were followed by higher-than-expected levels of social pressure and social support at t, respectively. The cross-lagged effect of social pressure at t-1 on social support at t (β = -.09, p < .001) was statistically significant, whereas the cross-lagged effect of social support at t-1 on social pressure at t was not statistically significant (β = -.04, ns), though it approached marginal significance at the 90% confidence level. Increases in social pressure at t-1 were significantly associated with decreases in social support at t. However, increases in social support at t-1 did not result in corresponding changes in social pressure levels at t. Finally, within-subject correlations of social pressure and social support showed that both measures were negative and significantly correlated within waves (rs = -.07, p < .01). After statistically controlling for the within-subjects autoregressive and cross-lagged effects of social pressure and social support over time, a significant negative covariation was found within each wave between social pressure and social support. There appeared to be a temporal relationship between social pressure and social support, with social pressure affecting social support over time. However, social support did not affect social pressure over time. The RI-CLPMs 1b and 2b estimated the distinct pathways through which social pressure at T1 might influence depressive symptoms and social support at T3. Presented below are the unstandardized parameter estimates and bias-corrected 95% confidence intervals. Regarding the total indirect effect of social pressure at T1 on depressive symptoms at T3 (.009, 95% bias-corrected CI [.005, .013]), it was observed that increases in social pressure at T1 were associated with increases in depressive symptoms at T3. This effect was primarily attributable to the incremental impact of social pressure on depressive symptoms throughout the study (Social pressuret1 → Depressive symptomst2 → Depressive symptomst3: .006, 95% bias-corrected CI [.003, .010]), while its effect through the increase in social pressure was smaller (Social pressuret1 → Social pressuret1 → Depressive symptomst3: .003, 95% bias-corrected CI [.002, .004]). This suggests that an increase in social pressure resulted in an increase in depressive symptoms over time, mainly because of its impact on the carry-over effect of depressive symptoms. The total indirect effect of social pressure at T1 on social support at T3 was negative and statistically significant (-.017, 95% bias-corrected CI [-.024, -.010]). The decremental effect of social pressure on social support over time was primarily attributable to its capacity to diminish social support: Social pressuret1 → Social pressuret2 → Social Supportt3 (-.006, 95% bias-corrected CI [-.008, -.004]); Social pressuret1 → Social Supportt2 → Social Supportt3 (-.011, 95% bias-corrected CI [-.017, -.004]). This suggests that an increase in social pressure resulted in a reduction of social support, mainly because of its impact on the carry-over effect of social support over time. In recent years, there has been growing interest among researchers in analyzing the impact of new social and communication technologies on users’ psychological and social adjustment (Elhai et al., 2017; Huang, 2010; Kaur et al., 2021; Kim et al., 2009; Munzel et al., 2018; Orben & Przybylski, 2019; Schemer et al., 2021; Vahedi & Saiphoo, 2018). Within this research context, the concept of social pressure emerges as an explanatory mechanism linking users’ social responsiveness, pervasive digital communication contexts, and psychological well-being (Gui & Büchi, 2019; Hall et al., 2021; Herrero et al., 2023; Khetawat & Steele, 2023; Nick et al., 2022; Steele et al., 2020; Stevic, 2024; Xie et al., 2023). To date, this research has been limited by methodological constraints, including frequent reliance on convenience samples and the absence of longitudinal research designs. Using a three-wave longitudinal panel design with data from 1,878 users representative of the Spanish population, we examined bidirectional relationships between social pressure, depressive symptoms, and social support over time. Our analytical strategy, utilizing RI-CLPM, permitted the decomposition of both between-subjects and within-subjects variation in these relationships, thereby enabling the identification of unique associations over time among social pressure, depressive symptoms, and social support (Hamaker, 2023; Torres et al., 2024; Usami, 2021). Our results offered mixed empirical support for our hypotheses: higher levels of social pressure were predictive of both higher levels of depressive symptoms (H1) and lower levels of social support (H3) over time, as hypothesized. Regarding the first type of cross-lagged influence, our results showed that participants with higher social pressure exhibited higher levels of depressive symptoms than their counterparts (between-subjects effect). This was evidenced by the statistically significant association between the latent trait-like factors of social pressure and depressive symptoms. Regarding the second type of influence, at the within-level, the RI-CLPM results revealed that participants with greater-than-expected levels of social pressure at t-1 exhibited greater-than-expected levels of depressive symptoms at t (spill-over effect) (H1). Additionally, a greater-than-expected levels of social pressure and depressive symptoms at t-1 were predictive of greater-than-expected levels of social pressure and depressive symptoms at t (carry-over effects). That is, after accounting for between-subjects variability and the carry-over effects of social pressure and depressive symptoms over time, the results showed that individuals increasing their social pressure at t-1 experienced an increase in depressive symptoms at t. These findings provide empirical support for the hypothesis that social pressure stemming from digital interactions is associated with psychological distress (Bayer et al., 2016). This association may be attributed to the belief that others expect constant accessibility through digital media (Khetawat & Steele, 2023; Reinecke & Eden, 2017), which engenders perceived pressure to check, act, and respond (Vanden Abeele et al., 2018). According to Lazarus’ (1993) theory of stress, such situational demands can exceed an individual’s resources, thereby increasing the prevalence of depressive symptoms (Hall, 2017). However, an increase in depressive symptoms was not statistically related to an increase in social pressure over time (H2), as hypothesized. The fact that the relationship between social pressure and depressive symptoms over time was predominantly unidirectional (social pressure affected depressive symptoms, but not vice versa) helps to elucidate some inconsistent findings in the literature regarding the association between social pressure and poor mental health (Büchi et al., 2019; Halfmann & Rieger, 2019; Herrero et al., 2022; Nick et al., 2022; Xie et al., 2023). Most of these studies employed a cross-sectional design, which precluded the examination of bidirectional relationships between the two constructs. As a result, the unidirectional nature of the relationship between social pressure and depressive symptoms has remained largely obscured from scrutiny. In Model 1b, the within-subject correlations between social pressure and depressive symptoms indicated that the two measures were not significantly correlated within waves (rs = .01, ns) once the between-subjects covariation and the within-subjects autoregressive and cross-lagged effects were taken into account. These findings may contribute to a more comprehensive understanding of the existing inconsistencies in the empirical research on social pressure and depressive symptomatology. Furthermore, the results underscore the importance of longitudinal studies for elucidating the complex interplay between these two variables. Our findings indicated that increased social pressure diminished social support over time (H3). This finding aligns with the conceptualization that high social pressure in digital contexts is not perceived as supportive by individuals and is consistent with empirical literature suggesting that this may particularly affect support from close ties (Qiu et al., 2024; Stevic, 2024; C. C. Yang et al., 2021). In this regard, the conflict between perceived highly demanding expectations from close ties and users’ need for autonomous functioning has a deleterious effect on these close relationships (Stevic, 2024). Model 2b detected a significant association between the latent trait-like factors: participants with higher social support self-reported lower levels of social pressure than their counterparts. However, fluctuations in social support did not result in corresponding changes in social pressure over time (H4), and any changes that did occur were marginal at the 90% confidence interval. Findings from Model 2b contribute to the empirical research which has revealed that overuse of social and communication apps is significantly associated with increases in social pressure in digital contexts over time (Herrero et al., 2023). These findings also align with prior research showing the detrimental effect of excessive smartphone use on users’ social connectedness (Büchi et al., 2019; Busch & McCarthy, 2021; Dula & Güler, 2022; Gui & Büchi, 2019; Herrero et al., 2023; Kushlev et al., 2019; Lapierre & Zhao, 2022; Li & Chan, 2024; Zhang et al., 2024). The unidirectional effect of social pressure on depressive symptoms and social support was further analyzed through the examination of indirect effects. This strategy allowed for a more detailed investigation of the potential pathways through which social pressure might influence depressive symptoms and social support. The results showed that social pressure had a deleterious impact on participants’ depressive symptoms one year later. Specifically, high social pressure at the outset of the study had a significant impact on depressive symptoms one year later, largely due to its influence on depressive symptoms in the middle of the study, which exhibited a notable carry-over effect on subsequent depressive symptoms. Therefore, our findings suggest that elevated social pressure may facilitate the transition to experiencing depressive symptoms, which is presumed to have its own trajectory independent of subsequent social pressure fluctuations (i.e., carry-over effect of depressive symptoms). The influence of social pressure on directing participants toward a declining social support trajectory over time (reflecting the carry-over effect of social support observed in our study) was also noted. From a longitudinal perspective, the results indicate that social pressure in digital contexts has the adverse effect of placing users in a state of inertia, wherein high depressive symptoms and low social support persist beyond the influence of subsequent social pressure. The findings of our study did not support hypotheses H2 and H4, which proposed a relationship between variations in depressive symptoms and social support, and cross-lagged variations in social pressure over time. This absence of cross-lagged changes in social pressure due to variations in depressive symptoms and social support suggests that better psychological and social adjustment, achieved through reductions in depressive symptoms or increases in social support over time, did not result in changes in subsequent levels of social pressure. While social pressure had a deleterious effect on users’ psychological (i.e., depressive symptoms) and social (i.e., social support) adjustment, improvements in these areas did not result in a concomitant reduction in social pressure. A review of the literature reveals a paucity of studies examining social pressure in digital contexts as an outcome variable. Consequently, there is a dearth of knowledge regarding the potential influence of psychological and social adjustment on the emergence of social pressure. As social pressure has been identified as a contextual variable (see Büchi, 2024; Herrero et al., 2023), our findings suggest that contextual factors (specifically, social pressure) increased depressive symptoms and reduced social support over time; however, individual variables did not affect these contextual factors. The operationalization of social pressure aimed to reflect how participants described their digital social contexts (Gui & Büchi, 2021); however, these self-reported social pressure scores may have been subject to bias. For example, individuals with higher levels of depressive symptoms may perceive their social contexts more negatively than those with lower levels of depressive symptoms, even though their actual social pressure levels are the same (Reinecke et al., 2019). Additionally, individuals who are highly motivated to seek social connectedness (i.e., those with low social support) may perceive their social digital connections as more demanding, potentially resulting in upward biased self-reported levels of social pressure. The assumption that social pressure is largely shaped by the social digital context does not preclude the possibility that these social digital contexts may, in principle, be influenced by variables at the individual level, such as depressive symptoms or social support. As participants improve their depressive symptoms or fulfill their social support needs, they may significantly alter their social (digital) environments. This could involve a shift from digitally demanding social contexts to those that are less time-consuming or demanding. Although such an effect might have been detected in our models (depressive symptoms and/or social support affecting social pressure over time), our results further suggest that social pressure in digital contexts is resistant to changes in depressive symptoms and social support. Considering the available data, our study cannot provide evidence-based arguments for why social pressure remained largely unaffected by the study variables over time. Our results indicated that users who improved their psychological and social adjustment were unable to change their social pressure levels over time. However, previous social pressure levels increased subsequent social pressure levels. Identifying new factors that may account for this carry-over effect of social pressure over time represents a significant research challenge with important implications for users’ psychological and social adjustment. One potential research avenue to explain this phenomenon could be linked to the accelerated proliferation of social and communication apps, which have become integral elements of contemporary social interaction and have shaped how citizens engage with one another. As this technology is typically designed to engage users by capitalizing on their social connectedness (Herrero et al., 2025; Zuboff, 2022), it generates social pressure to maintain user engagement, regardless of users’ psychosocial adjustment (i.e., low depressive symptoms and high social support). Furthermore, the majority of research on psychosocial well-being and social digital pressure has been conducted within the field of digital stress studies (Hall et al., 2021; Khetawat & Steele, 2023; Nick et al., 2022; Reinecke et al., 2017; Steele et al., 2020). These studies have concentrated on the negative psychological effects of digital communication, which can manifest as anxiety, fear, and stress, among other symptoms. However, this approach has resulted in a limited understanding of the social pressure associated with excessive digital usage, which is often perceived as a pathology within the user. Meanwhile, the impact of system-level influences on everyday digital practice is often overlooked (Büchi, 2024). It can be argued that the digital industry’s corporate objectives, aimed at engaging users through addictive design in internet services and applications, and the resulting increase in digital overuse (and likely social pressure on users) could contribute to the carry-over effect of social pressure over time. It is important to acknowledge that digital interactions can lead to negative outcomes that are not merely attributable to individuals with a predisposition for excessive digital media use. Rather, these outcomes are contingent upon a complex constellation of potentially interrelated factors. This perspective recognizes the profound mediatization of our world, where digital devices have become integral components of culture (Miller, 2014). In this context, the user’s psychosocial resilience may seem less important. Therefore, intervention efforts should focus on restoring users’ agency, for example, through the regulation of industry practices. Strengths and Limitations The present study offers several strengths and potential limitations. Among its strengths is the longitudinal design, which enables a deeper examination of the relationships between study variables over time. Another strength is the implementation of RI-CLPM to analyze both between-subjects and within-subjects associations. Furthermore, the fact that the data originate from a nationally representative sample of Spanish internet users enhances the generalizability of the findings. The existing empirical research on the effects of social pressure on depressive symptoms and social support has been conducted mainly through cross-sectional designs. Cross-sectional designs are useful for exploring the plausibility of theoretical models by tentatively examining the relationships among variables. However, they do not allow for the elucidation of the relationships between variables over time, which has traditionally been regarded as a disadvantage. Our study addresses this limitation by employing a longitudinal panel design with three temporal measurements, each separated by a six-month interval. Additionally, self-reported data from participants, representative of the national population of Spanish internet users, were analyzed using a series of RI-CLPMs. This statistical technique is particularly well-suited for studying relationships between variables over time. To this end, it distinguishes between-subject and within-subject variability, eliminating the former to accurately estimate autoregressive and cross-lagged within-subject coefficients. This capability makes RI-CLPM superior to traditional CLPM, which does not allow for the decomposition of variance into between- and within-subject components. When considered collectively, these strengths provide a robust basis for this study’s findings, which can serve as a valuable source of guidance for future empirical research in this field. Notwithstanding these strengths, the study could have benefited from the inclusion of additional time measurement points. RI-CLPM decomposes between- and within-subjects variance by estimating trait-like latent factors. The minimum number of indicators required for latent factor estimation is three; therefore, the study would be enhanced by including additional indicators (i.e., more time measurements) for such latent factors (Murayama & Gfrörer, 2024). RI-CLPM considers the multilevel structure of the data, specifically the nesting of time measurements within individuals. Increasing the number of data points within each cluster or individual (i.e., time measurements) would also allow for a more precise estimation of within-subject effects. Moreover, our study analyzed participants from the general population aged 15 years and above. Consequently, the findings do not extend to individuals below the age of 15, who are at an elevated risk of excessive smartphone use (Dula & Güler, 2022; Olson et al., 2022), and potentially a heightened risk of social pressure as recent research has demonstrated (Gui & Büchi, 2019; Heffer et al., 2019; Steele et al., 2020). Further research involving participants younger than 15 years old may yield insights that differ from those of the current study. Conclusion The present research has highlighted the different ways in which social pressure in digital contexts can affect the depressive symptoms and social support of users: social pressure increases depressive symptoms and decreases social support over time. In addition, social pressure shows a strong inertia to remain constant over time (and even to increase its levels), which undoubtedly fuels a cycle of increasing depressive symptoms and decreasing social support. If, as some research has suggested (Gui & Büchi, 2019; Herrero et al., 2023), social pressure in digital contexts is exacerbated by the overuse of social and communication apps, the constant expansion of these apps in users’ digital social lives could be accompanied by a deterioration in users’ mental health and psychosocial adjustment. Our findings indicate that individuals who improved either their depressive symptoms or social support levels (i.e., those who experienced a reduction in depressive symptoms or an increase in social support) did not exhibit a substantial decline in their social pressure levels over time. Given that social pressure appears to be uninfluenced by an individual’s psychosocial adjustment and exhibits notable carry-over tendencies or inertia, future research should concentrate on potential external sources of social pressure, likely rooted in social, economic, and cultural factors beyond the individual. Conflict of Interest The authors of this article declare no conflict of interest. Cite this article as: Erdem, H. D., Herrero, J., & Urueña, A. (2025). The bidirectional relationships between social pressure in digital contexts, depression, and social support over time. Psychosocial Intervention, 34(3), 189-200. https://doi.org/10.5093/pi2025a15 Funding This research was supported by the Ministry of Social Rights, Consumption, and Agenda 2030; the General Directorate of Gambling Regulation (SUBV23/00003); La Caixa Conecta 2023 Research Grants (CX23-00034); the Spanish Research Agency (AEI, PID2024-161573NB-I00); and the Severo Ochoa Program of the Principality of Asturias (Spain) (AYUD0029T01). The data and code used to generate the estimated models are available from the authors upon request. |
Cite this article as: Erdem, H. D., Herrero, J., & Urueña, A. (2025). The Bidirectional Relationships between Social Pressure in Digital Contexts, Depression, and Social Support over Time. Psychosocial Intervention, 34(3), 189 - 200. https://doi.org/10.5093/pi2025a15
Correspondence: UO296263@uniovi.es (H. D. Erdem)
Copyright © 2026. Colegio Oficial de la Psicología de Madrid


 PDF
PDF e-PUB
e-PUB CrossRef
 JATS
JATS Print
Print Send
Send