The role of the estrous cycle in activity-based anorexia: A comparative study of sexual differences in rats
[El papel del ciclo menstrual en la anorexia por actividad: estudio comparativo de las diferencias sexuales en ratas]
Iris Lorena Gómez1 , Héctor Martínez Sánchez2
1Univ. Guadalajara, México ,2Univ. Guadalajara, Inst. Neurociencias, México
https://doi.org/10.5093/cl2013a12
Abstract
The present study evaluates the effects of the estrous cycle on activity-based anorexia by identifying the successive phases of the estrous cycle of female rats before, during, and after exposure to the experimental conditions. Activity-based anorexia is established when rats are exposed to a restricted-feeding schedule (1 hour) while having free access to a running wheel (23 hours). Under these conditions rats quickly lose bodyweight, reduce food consumption, and gradually increase their levels of activity on the running wheel. Recent data show that food restriction and the increase of activity interrupt the estrous cycle and that hormonal factors affect the activity level and food consumption of female rats during some phases of the estrous cycle. Results showed increased activity and greater weight loss in females compared to males though during feeding time there were no differences in food and water consumption. Males and females recovered their initial bodyweight after the procedure. Females showed anticipatory activity before eating and their estrous cycles were disturbed during the experimental phase.
Resumen
El presente estudio evalúa los efectos del ciclo menstrual de ratas hembra sobre la anorexia por actividad identificando las fases sucesivas del ciclo menstrual, anterior, durante y posterior a las condiciones del procedimiento experimental. El procedimiento de anorexia por actividad se establece exponiendo a las ratas a una restricción de alimento (1 hora) y al acceso a una rueda de actividad durante las 23 horas restantes. Como resultado de esta manipulación las ratas rápidamente pierden peso corporal, reducen su consumo de alimento y gradualmente aumentan el nivel de actividad en la rueda de actividad. Datos recientes demuestran que la restricción de comida y el incremento de la actividad interrumpen el ciclo menstrual y que los factores hormonales afectan al nivel de actividad y al consumo de alimento de las ratas hembra durante algunas de las fases de dicho ciclo. Los resultados mostraron que la actividad aumentó y las hembras perdieron mayor peso corporal en comparación con las ratas macho. Sin embargo no se encontraron diferencias en el consumo de comida ni de agua. Ambos grupos recuperaron su peso inicial después del procedimiento, las hembras mostraron actividad anticipatoria antes de comer y el ciclo menstrual se alteró durante la fase experimental.
Palabras clave
activity-based anorexia#estrous cycle#body weight#feeding patterns#rats
Routtenberg and Kuznesof (1967) introduced the term self-starvation when they observed a group of rats that were allowed free access to an activity wheel but were offered food for only 1 hour. Activity, measured by the number of turns on the wheel, increased in a short time as food consumption decreased, resulting in a significant loss of bodyweight. After a short period in this procedure the animals died. The interpretation by the authors was that the animals died because the amount calories consumed did not compensate the energy required for the activity on the wheel. These experimental manipulations suggest that the activity was especially important since only the rats with access to it died. Routtenberg (1968) argued that there are two components involved in the self-starvation shown by these experimental subjects. The first consists in adaptation to the activity wheel, which produced stress caused by the novelty; the second involves adapting to the feeding program, which causes stress due to the restricted amount of food made available. The animal model of activity-based anorexia is typically characterized by a sudden loss of bodyweight, a decrease in food intake, and an excessive increase in activity. Basically, the procedure involves exposing rats to a restricted food schedule while allowing them free access to an activity wheel. The result is an excessive increase in activity (running wheel), even though food intake is limited (Epling, Pierce, & Stefan, 1983; Epling & Pierce, 1988; Guti├ęrrez & Pell├│n, 2002; Par├ę, 1975; P├ęrez-Padilla, Magalh├úes, & Pell├│n, 2010; Pierce & Epling, 1986). Because the incidence of anorexia as an eating disorder has been diagnosed mainly in women (Logue, 2004), studies have focused on exploring the differences between males and females under the model of activity-based anorexia as a way to gain a better understanding of this eating disorder. Among the most important differences that have been reported between males and females we find: a) different rates of weight loss; b) different levels of activity; and c) male rats increase their activity as weight decreases, whereas bodyweight loss is slower in females and the level of activity is variable (Boakes & Dwyer, 1997; Boakes, Mills, & Single, 1999; Doerries, Stanley, & Aravich, 1991; Lambert & Kimsley, 1993; Par├ę, Vicent, Isom, & Reeves, 1978; Tokuyama, Saito, & Okuda, 1982).
A major indicator that has shown that female rats are more vulnerable when exposed to such an anorexia procedure is that compared to males they typically display a greater amount of activity on the wheel (Lambert & Kimsley, 1993; Tokuyama, et al. 1982). In contrast, when access to the wheel is allowed with no restrictions on food intake, male rats gain bodyweight, while food consumption by female rats decreases further (Rolls & Rowe, 1979). Boakes et al., (1999) reported that males showed greater activity compared to females when weight loss was more pronounced (85-80%), though females developed more activity when weight loss was not as marked (approximately 90%). Thus, they concluded that the relationship between activity and food deprivation is distinct for males and females. According to Par├ę et al. (1978), female rats lost bodyweight faster than males because they are more vulnerable to the procedure of activity-based anorexia. One limitation of the above explanation however is that the authors did not report the age or initial bodyweight of the rats. In contrast, in a comparative study of male and female rats, Doerries et al. (1991) found that the former lost bodyweight faster than the latter.
Boakes et al. (1999) attempted to determine whether there are differences in the amount of activity between male and female rats of different ages. For this purpose, two groups of young rats (52 days-old males and females) and a group of older females (136 days) were exposed to the traditional anorexia-producing procedure. Their work confirmed the results of previous experiments, as they found that young rats achieved the criteria for activity-based anorexia before the older ones showed a higher level of activity, and experienced evident bodyweight loss in the first 5 days. Although the males and females were in the same age groups at the beginning of the experiment, the females had only 70% of the bodyweight of the males. While these authors reported no difference in weight loss between males and females of the same age, the level of activity in females showed a higher number of turns on the wheel. These findings demonstrate the importance of the initial age and bodyweight of subjects in developing the model of activity-based anorexia.
The phases of the estrous cycle in female rats play an important role in the variation of some behaviors and organic conditions. Female rats show changes across the estrous cycle associated with sexual receptivity, hormone secretion, activity level, and food and water intake, among others. Millenson (1967) identified a pattern of activity characteristic of female rats when exposed to wheel activity during the phases of the estrous cycle, as they showed a marked increase in activity every 4 days during the ovulation phase. Eckel,
Houpt, and Geary (2000) found that female rats show a decrease in bodyweight and food and water consumption, accompanied by an increase in activity during the estrous cycle. However, their subjects were not exposed to food deprivation and were allowed free access to the activity wheel. Dixon, Ackert, and Eckel (2003) also examined the development and recovery of activity-based anorexia in female rats. They assumed that individual variability in weight loss is due to differences in energy balance as a result of food restriction. This balance shows fluctuations during the ovarian cycle characterized by decreased food consumption and increased activity. Their results confirmed this assumption based on the comparison of an experimental group that was exposed to the activity wheel with a control group. In their study, a complete ovarian cycle was included to record baseline measures when both groups had free access to food. The baseline data showed that both groups decreased food consumption in the estrus period, but that the group with access to the wheel increased activity during that phase. Having established the traditional procedure to develop activity-based anorexia followed by a recovery period, they found that in both groups restricting food decreased intake and bodyweight, but these phenomena were more pronounced in the subjects that had access to the activity wheel. Female rats in the experimental phase increased activity during the estrus period compared to baseline. This evidence suggests that the estrous cycle is involved in activity and food intake in female rats.
In order to explore whether there are sex differences in establishing the model of activity-based anorexia when the role that female's hormonal cycle may play is taken into account, we conducted a study in which male and female rats were exposed to a food restriction condition for 23 hours with food available for only 1 hour. During this 23-hour period, both groups had free access to an activity wheel. Water was made available throughout the experiment. A control group divided into males and females was exposed to the same procedure but no access to the activity wheel was allowed. Our hypothesis was that the estrous cycle of female rats would interfere with the establishment of the activity-based anorexia model.
Method
Subjects
Thirty-two (16 male and 16 female) experimentally naïve Wistar rats at 60 days of age were obtained from the animal facility at the Institute of Neurosciences. Initial bodyweights averaged 181 g (range 173-203 g) for females and 240 g (range 214-259 g) for males. Females and males were assigned to one of two groups: experimental or control ( n = 8 per group). Room temperature was maintained at an average of 22.5 °C on a 12:12 light:dark cycle (0800-2000). All animal care methods were submitted to and approved by the Ethical Committee of the Institute of Neurosciences at the University of Guadalajara.
Apparatus
The experimental subjects were housed in transparent 21 cm x 45 cm x 24 cm acrylic cages. When food was made available it was placed in the center of the metal grid ceiling of the cage, and a water bottle was placed on the left side of the metal grill housing. An activity wheel (Lafayette Instrument) was attached to the right side of the cage; access was controlled manually by researchers. The running wheel was equipped with a counter to allow the automatic computerized recording of the number of turns. Data was stored every 30 minutes. A PC programmed with Lafayette Instrument-Wheel Activity Monitor Software recorded the turns of the wheel. The floor of the cages was covered with sawdust. Purina 5001 Rodent Chow was used as food. Food and water consumption of water and bodyweight were recorded twice daily (14:00 and 15:00 p.m.). A World Precision
Instrument electronic microscope was used to analyze the samples of vaginal smears.
Procedure
At the beginning of the experiment, each subject was placed in a comfortable single cage for five days, where food and water were freely available but there was no access to a running wheel. Bodyweight and food and water consumption were recorded daily during that period to serve as baseline data. For each subject, 100% of bodyweight was obtained from the averaged weight of the last 48 hours of the baseline period. After that, subjects were housed individually in the experimental cages. Access to food was allowed for 1 hour/day (14:00-15:00). Vaginal smears were taken from the females each day before feeding time. The running wheel was available during the 23 hours of food restriction. Water was freely available to all control and experimental subjects throughout the experiment.
After 23 hours of food restriction, the bodyweight and water consumption of all subjects were recorded, the vaginal smears were taken, the feeder (50 g) and water bottle (100 ml) were made freely available for 1 hour, and access to the running wheel was manually impeded. After 60 min, the food was removed from the cage, the amount of food and water consumed were recorded, subjects were reweighted, and the water bottle was refilled to 100 ml. After that, subjects returned to 23 hours of free access to the running wheel without access to food. The experimental phase lasted 7 consecutive days. After this phase, a recovery phase of 5 successive days began, where food and water were available but the rats did not have access to the running wheel. If the bodyweight of any rat decreased below 75% during the experimental phase, the procedure was suspended for that subject and was moved directly into the recovery phase. To summarize, the experimental design consisted of 5 days of baseline, 7 days of access to the running wheel with food restriction, and 5 days of recovery, after which the experiment ended.
Results
Data were analyzed with a two-way ANOVA (sex x session) using the Statistical May package. The post-hoc analysis was done with a Newman-Keuls test and performed with the same software. The minimum level of statistical significance was set at p < .05. The following data were plotted: percentage of bodyweight, average food consumed, and total water consumption.
Experimental Group
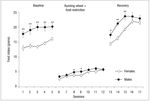
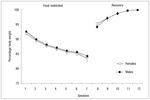
Figure 1 shows the percentage of bodyweight lost by males and females in the experimental group during the sessions of the experimental and recovery phases. The bodyweight of all animals decreased progressively during the experimental sessions. Though males and females began with equal bodyweights, weight loss was more pronounced in females. By the second session, the between-groups differences had reached the level of statistical significance ( p< .01).
Fig. 1. Mean percentage bodyweight loss (┬▒ SEM ) of females (open circles) and males (filled circles) of the experimental groups on the basis of their bodyweight during food restriction and running wheel and recovery phase; the asterisk indicates significant difference between groups ( p < .05); double asterisk indicates significant difference between groups (p < .01).
Statistical analysis showed a principal effect of Group: F (1, 13) = 12.81, p< .05, Session F (6, 78) = 270.18, p < .001 and Group x Session interaction: F(6, 78) = 6.07, p < .001. Both females and males initiated weight recovery on the first day of free access to food with no significant differences between groups. However, the ANOVA showed a main effect of Session: F (4, 56) = 126.23, p < .001 and Group x Session interaction: F(4, 56) = 5.46, p < .001. Both groups had regained the weight recorded at the onset of the experiment by the end of the recovery phase (see Fig. 1).
The data for the average amount of food consumed during baseline, the experimental phase, and the recovery phase by the two groups are shown in Figure 2. Differences in the amount of food consumed during baseline were obtained with males consuming more food than females. This produced an effect of Group: F(1, 13) = 21, p= .001 and Session: F(4, 52) = 5.19, p = .05. Except for two sessions (8 and 9), where there was a statistically significant difference ( p < .05) with females consuming less food, in the experimental phase there were no significant differences in food consumption. The ANOVA showed a principal effect of Sessions 13, 14, and 15: F(6, 78) = 3.31, p < .001. Differences from baseline food consumption reappeared as food intake was lower for females during the recovery phase. Statistics showed an effect of Group: F (1, 14) = 11.03, p< .01, Session: F (4, 56) = 46.62, p < .001, and Group x Session interaction: F (4, 56) = 3.46, p < .001 (see Fig. 2).
Fig. 2. Mean (┬▒ SEM ) of food consumed by females (open circles) and males (filled circles) of the experimental groups during baseline, food restriction, and running wheel and recovery phase; the asterisk indicates a significant difference between groups ( p < .05); double asterisk indicates a significant difference between groups ( p< .01).
During baseline, water consumption was also higher for the group of males compared to females, showing a principal effect of Group: F (1, 13) = 17.39, p < .01. The ANOVA revealed a principal effect of Sessions: F (6, 78) = 12.42, p < .001 (Fig. 3). When access to food was allowed, water consumption increased by only two milliliters during the sessions, a finding very similar to the amount of water consumed by both groups in each session. The ANOVA showed a main effect of Sessions: F (6, 78) = 12.42, p < .001, with no significant between-group differences.
Fig. 3. Mean daily (┬▒ SEM ) of water consumed by females (open circles) and males (filled circles) of the experimental groups for the baseline, 1-h period of food access of experimental phase and recovery phase; the asterisk indicates a significant difference between groups ( p < .05); double asterisk indicates a significant difference between groups ( p < .01); ++ indicates water consumed during 23 hours and + indicates water consumed during 1 hour.
At the beginning of the phase of activity and food restriction water consumption was higher in females than males in sessions 6, 7, and 8, with a maximum difference of 20 ml in session 6. Though this difference was not significant, water intake by females did decrease during the sessions and in the last session females consumed less water than males. During the activity phase males exhibited more variable water consumption with a higher consumption peak in session 7, followed by a decrease in the next 2 sessions and, finally, a slight increase in the final session. There were no significant differences between groups, except in sessions 6 and 7. However, there was an effect of Session: F (6, 78) = 18.95, p < .001 and Session x Group interaction: F (6, 78) = 10.37, p < .001. Both groups consumed less water in the experimental phase than in baseline and, while water consumption increased during the sessions, no significant differences between groups were found. However, there was a principal effect of Session: F(4, 56) = 7.62, p< .001 (Fig. 3).
The activity plotted in Figure 4 represents the average number of turns on the wheel by the rats in each 23-hour session. There was a gradual increase of activity from one session to the next in both groups. From the first day of exposure to the activity wheel females showed double the activity of males throughout the experimental phase, as they recorded approximately 8000 turns at the wheel in the last session while the males completed only around 3500 at the end of this phase. The statistical analysis showed a principal effect of Group: F (1, 13) = 11.08, p < .01, with a significant between-group difference as of session 4, Session: F (6, 78) = 30.03, p < .001 and Group x Session interaction: F(6, 78) = 4.26, p < .001 were found to be significant (Fig. 4).
Fig. 4. Mean wheel turns per hour (┬▒ SEM ) for females (open circles) and males (filled circles) of the experimental groups during each daily session; the asterisk indicates a statistically significant difference between groups ( p < .05); double asterisk indicates a statistically significant difference between groups ( p< .01).
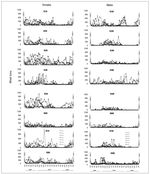
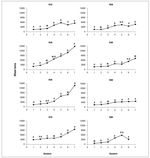
Figure 5 represents the number of turns on the wheel per 30-minute cycles over the 7 sessions of the experimental phase.
Fig. 5. Individual distribution of the number of wheel turns of the females (H) and males (M) of the experimental groups in consecutive periods of 30 minutes for each of the seven sessions of the experimental phase; the shaded bars represent the time of eating.
From day 1 all subjects began to show activity, though this was more immediately evident in females (Fig. 5, left side), with males showing greater activity as the hours passed (Fig. 5, right side). Although all subjects showed activity throughout the day, a higher amount of activity was observed during the dark cycle followed by a period of less activity at the beginning of the light cycle. Activity was more evident in females before the time of access to food, but all subjects showed increased activity in the final sessions. All rats increased the number of turns on the wheel as the sessions progressed, showing the highest levels from day 4 of access to the running wheel (Fig. 5).
Estrous cycle
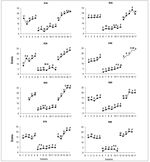
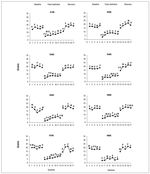
Figure 6 shows the plots of food intake through the 3 phases of the experiment for individual females. The letters indicate the phases of the estrous cycle in each session. With very few exceptions (e.g., R1H and R7H), the duration of the phases of the estrous cycle remained normal at baseline. All females extended the duration of the diestrus stage during the experimental phase when exposed to the running wheel with food restriction. R1H and R7H had already shown this extension of the diestrus period during baseline; therefore, it continued into the experimental phase. The estrous cycle did not appear to affect food intake in any of the 8 females over the three phases of the experiment (Fig. 6).
Fig. 6. Individual graphs of food consumed by females of the experimental group during baseline, experimental phase and recovery phase; the letters above the dots indicate the phase of the estrous cycle: P (proestrus), E (estro), M (metestrus), D (diestrus).
The same can be said with respect to drinking water. All females showed a gradual decrease in water consumption during the 23 hours of exposure to wheel activity with food restriction. However, with the exception of R7H, extending the period of diestrus always coincided with a decrease of different levels in the rest of the females. The bodyweight of the females also showed changes, which may be attributable to the development of the estrous cycle. Regardless of the estrous cycle all females showed a progressive decrease in bodyweight in the presence of wheel activity and food restriction. Recovery was also normal for all females. Finally, the running wheel activity showed no particular effects across sessions. As in the previous measures, activity on the wheel showed a normal course with an extension of the diestrus period. Though this occurred at different times for each female, it did not disturb the gradual increase in the number of turns on the wheel through the sessions (see Fig. 7).
Fig. 7. Individual graphs of activity in the wheel of the females in the experimental group during the baseline, experimental phase and recovery phase; the letters above the dots indicate the phase of the estrous cycle: P (proestrus), E (estro), M (metestrus), D (diestrus).
Control group
Percentages of the bodyweight of the control group (males and females) in the experimental and recovery phases are shown in Figure 8. From the first day of food restriction the bodyweight of males and females decreased in a similar fashion, showing a gradual reduction over sessions. There were no significant differences between the groups and none of the subjects decreased its bodyweight below 80%. When the food restriction phase concluded, all rats gained weight from day 1 of free access to food and had returned to their initial weight by the last day of the recovery phase (Fig. 8).
Fig. 8. Mean percentage bodyweight loss (┬▒ SEM ) of females (open circles) and males (filled circles) of the control groups on the basis of their bodyweight during food restriction and recovery phase.
Figure 9 shows the food consumed by the male and female in the control group during the 3 phases of the experiment. The amount of food ingested was higher in males during baseline, revealing an effect of Group: F(1, 14) = 135.5, p < .001. In the experimental phase, statistically significant differences ( p < .05) were found for sessions 11 and 12 on the last two days of restriction, with males consuming more food than females. Initially, both groups consumed less than 5 grams in the first session of the restriction phase, but gradually increased food intake during subsequent sessions. In the final session of the restriction phase males reached twice the initial consumption, while females had a lower consumption. Statistical analysis thus showed an effect of Group: F (1, 14) = 18.23, p< .001 and Session: F (2, 84) = 37.89, p < .001. Both groups increased food intake from the first session of the recovery phase when free access to food was permitted, but females consumed less food than males, a difference that was significant in all sessions, reflecting an effect of Group: F(1, 14) = 29.90,p< .001, Session: F (2, 56) = 36.99, p < .001 and Group x Session interaction: F(2, 56) = 3.37, p< .001 (Fig. 9).
Fig. 9. Mean (┬▒ SEM ) of food consumed by females (open circles) and males (filled circles) of the control groups during baseline, food restrictionand recovery phase; the asterisk indicates a significant difference between groups ( p < .05); double asterisk indicates a significant difference between groups ( p< .01).
Water consumption by males and females during the 3 phases is shown in Figure10. Statistical analysis showed a principal effect of Group: F (1, 14) = 36.69, p < .01 during baseline and water consumption was higher for males compared to females. Water consumption during the time of access to food increased across the sessions for both groups and the amount of water consumed was very similar (bottom of the middle section of Fig. 10). There were no significant differences between groups and the ANOVA only showed a principal effect of Session: F(1, 14) = 5.44, p< .05.
Fig. 10. Mean daily (┬▒ SEM ) of water consumed by females (open circles) and males (filled circles) of the control groups for the baseline, 1-h period of food access of experimental phase and recovery phase; the asterisk indicates a significant difference between groups ( p < .05); double asterisk indicates a significant difference between groups ( p < .01); ++ indicates water consumed during 23 hours and + indicates water consumed during 1 hour.
The water consumption data show that on the first day of food restriction males and females consumed similar amounts. However, on the second day of restraint females decreased their intake while males consumed a similar amount to that of day 1. From the session 8 of the restriction phase males decreased their consumption; however, in sessions 11 and 12 intake increased though it never reached the initial level of consumption in this phase. Except for session 3 of the restriction phase, females decreased their water intake. The last 4 sessions showed a constant consumption by females. There were significant differences between groups for sessions 7, 11, and 12, with an effect of Sessions: F(1, 14) = 5.15, p < .05 and Session x Group interaction: F(6, 84) = 14.03, p < .001. From the first session of the recovery phase both males and females recovered and sustained the water consumption they had demonstrated during baseline. However, as at baseline, there were significant differences between Groups: F (1, 14) = 14.79, p < .01 (left side Fig. 10).
Estrous cycle of the control group
During food restriction, and in contrast to the experimental group, only 4 females in the control group showed an extension of diestrus. There were no significant changes in the cycle, although in some rats the diestrus phase also lasted 2 days. In the recovery phase, only 3 females showed a 2-day extension of the diestrus period, but this did not affect the recovery curve of food consumption.
Water consumption was not affected by the estrous cycle. Figure 11 shows the phases of the estrous cycle of the females in the control group during the 3 phases of the experiment. No significant changes in the estrous cycle were seen, although in 2 subjects (R4HC and RH8C) this phase lasted for 2 days.
Fig. 11. Individual graphs of activity in the wheel of the females in the control group during the baseline, experimental phase and recovery phase; the letters above the dots indicate the phase of the estrous cycle: P (proestrus), E (estro), M (metestrus), D (diestrus).
Discussion
In the traditional animal model of activity-based anorexia rats are placed under a restricted feeding schedule. They are allowed free access to an activity wheel for 23 hours, but have only 1 hour of access to food. During this hour access to the wheel is impeded. Most studies using the activity-based anorexia model have been conducted with male rats; thus, the aim of this study was to conduct a comparison between males and females to examine differences between groups when exposed to the activity-based anorexia procedure. In particular, our interest was to evaluate the role of the female hormonal cycle in establishing the paradigm of activity-based anorexia. The findings are analyzed according to the 3 phases of the study: baseline, food restriction + running wheel, and recovery.
Baseline
The males in the control and experimental groups consumed more water and food than females during the initial period of free access. This difference may be explained by the fact that while all subjects were of the same age at the outset of the experiment, the average bodyweight of males was higher than that of females. The amount of water consumed is not usually a datum recorded in the studies of anorexia-based activity; however, in our work water consumption throughout the experiment was registered. Results showed that males drank more water during baseline than females.
Experimental phase
All subjects reduced their bodyweight from day 1 of food restriction. Over the course of the sessions, the males and females in the experimental group showed a greater decrease in bodyweight compared to controls. In contrast to the study by Doerries et al. (1991) in which males lost bodyweight more rapidly than females, in our experiment the females decreased their bodyweight more quickly and also lost more bodyweight than the males in the experimental group. These differences between the two studies may be due to the age of the rats and their initial bodyweight, since those in our study were 20 days older and had higher bodyweights than in Doerries et al.'s work (1991). The vulnerability to the weight loss among female rats in our study concords with the results in Par├ę et al. (1978), though they did not report the initial bodyweight and age of their subjects. The control subjects did not reach the percentage of weight loss of the rats exposed to the wheel, and no differences in bodyweight decreases between the males and females in this group were found. Once the subjects were exposed to food restriction with access to the activity wheel, food intake decreased because access to food was limited to 1 hour. While control subjects consumed more food than the rats in the experimental group, all groups showed a tendency to increase consumption over the course of the sessions, though the amount consumed by rats with access to the activity wheel was consistently lower.
These data confirm the results of the experiment by Routtenberg and Kuznesof (1967), who were the first to report a difference in food intake between subjects exposed to the activity wheel and those in a control group. Food consumption by males and females in the experimental group was similar, as only 2 sessions showed differences, with males consuming more food. Dorries et al. (1991) reported higher food consumption in females, which could explain why the males in their experiment decreased their bodyweight more quickly. The significant differences in food intake during baseline in the control group disappeared at the beginning of the period of food restriction, with consumption being higher for males in the last sessions of this phase.
In our study, differences in activity levels became significant from session 4 of the experimental phase, though from the onset of exposure to the wheel females showed higher activity levels than males. As expected, all subjects showed a tendency to increase their activity on the wheel as the sessions progressed, though males did so to a lesser extent. Our results agree with those of Doerries et al. (1991) in terms of the generation of high activity by females. Par├ę et al. (1978) also noted increased activity in females, but only in the first 4 sessions, after which males reached the same level. Similar variability in the two groups was an effect that did not appear in our study. Lambert and Kinsley (1993) reported increased activity in females over a period of habituation, but they failed to report data on activity when the subjects were exposed to the procedure. Greater initial activity on the wheel by females has also been reported; however, as the sessions progressed and males decreased their bodyweight, they increased their activity significantly and finally displayed greater activity than females (Boakes et al. 1999).
At the beginning of the period of food restriction water consumption by males was almost the same as in the baseline during the 23 hours of restriction, but decreased rapidly as the sessions advanced. In contrast, water consumption by females showed a reduction of approximately 50% from the session 1 and in the final 3 sessions they drank less than males. This decrease in water consumption occurred even when water was always available and was more evident in males and females when activity showed further increases (Boakes & Juraskova, 2001). This reduction in water consumption under conditions of free access while food is restricted has been called self-deprivation (Verplanck & Hayes, 1953). Intuitively, it would be expected that when the food is restricted, resulting in a dramatic loss in bodyweight and a gradual increase in activity on the wheel, water consumption would increase markedly as a compensatory effect during the experimental phase. Self-deprivation of water was thus unexpected and it is surprising that records of water consumption have not been reported in previous studies of the ABA model. Water consumption during the time of access to food (1 hour) was similar for all groups.
Recovery phase
After exposure to the experimental procedure, the recovery of subjects is another aspect that is rarely taken into account in experiments conducted under the ABA model. In our work, however, bodyweight and food and water consumption were measured after the procedure, when subjects were again allowed free access to food but were barred from using the activity wheel. There were no differences between males and females with respect to recovery, as bodyweight was recovered quickly in all subjects in both the experimental and control groups, with all rats regaining their initial weight on the last day of this phase. Food consumption increased in all subjects because of the free access to food and the absence of the wheel, though males showed higher consumption rates in this phase than the females in the experimental and control groups, as occurred at baseline. This rapid recovery demonstrates that the effects of the ABA model are reversible once baseline conditions are restored (Dixon et al., 2003). An important aspect that favored the recovery of bodyweight and consumption patterns was likely the suspension of the experimental phase before the animals reached percentages below 75% of bodyweight loss. In our study, we established 7 sessions as the length of the experimental phase and all subjects in the experimental group showed a clear tendency to manifest the effects of the ABA model. The recovery of water consumption proceeded equally in males and females. The self-deprivation phenomenon also occurred in the control group though to a lesser extent, providing evidence that the decrease in water consumption may depend more on food restriction than exposure to the activity wheel. It has been shown that daily food consumption in female rats decreased significantly with the introduction of the wheel and increased significantly when it was the subsequently withdrawn. Hence, when a rat is deprived of a recurrent behavior that occupies a large portion of its total daily activity, an increase in some other behavior will occur (Premack & Premack, 1963).
Unlike comparisons made in previous studies, the results of this work seem consistent with the phenomenon of anorexia in humans, with females showing greater vulnerability to both the increase in activity and the loss of bodyweight. Moreover, as in humans, the rats' hormonal cycle is affected by exposure to the procedure, but in the opposite direction to what we assumed; that is, the hormonal cycle does not seem to influence the development of the model. Though Eckel et al. (2000) reported an increase in activity and decreased food consumption in the stage of estrus in rats with access to an activity wheel without food restriction, the present study did not find a direct relationship between this phase and increased activity or decreased food intake.
There are still many questions to be resolved in relation to the ABA model. Every study conducted using this animal model has reported reduced food intake in the experimental phase compared to subjects exposed to the same restricted feeding schedule without access to an activity wheel; however, it has not yet been possible to explain the causes that lie behind this phenomenon. Activity on the wheel seems to have important implications for the difference in the amount of food consumed by subjects (Boakes, 1997), as this occurs even when access to the wheel is limited for various periods or restricted to only one hour or a few hours each day. Indeed, extended exposure (e.g., 23 hours) to the wheel seems unnecessary for subjects to consume less food, since quick access is sufficient for them to reduce their consumption (Cano, Guti├ęrrez, & Pell├│n, 2006).
There are other variables, the effects of which might be useful in evaluating the development of activity-based anorexia (e.g., Lett, Grant, Smith, & Koh, 2001). For example, Spatz and Jones (1971) observed that isolated subjects displayed a lower level of activity compared to those not exposed to isolation. Boakes and Dwyer (1997), meanwhile, found that socially-deprived rats showed a greater decrease in bodyweight compared to those housed in a group. In this regard, experiments have also been proposed that would manipulate different food flavors to study the preference of subjects to a certain kinds of food when they are exposed to the model of activity-based anorexia and order to determine whether this may reduce the phenomenon (Erlanson-Albertsson, 2005). Others have suggested exploring the substances involved in exercise and participation in food consumption that take place under various physiological conditions (Favaro, Caregaro, Burlina, & Santonastaso, 2000). Gomez-Pinilla, Ying, Roy, Molteni, and Edgerton (2002) observed a relationship between an increase in the brain-derived neurotrophic factor and decreased appetites in animals exposed to the activity wheel. The model of activity-based anorexia has proven suitable for analyzing each one of the elements of this phenomenon without compromising the health of people who suffer from this malady (Quiles, Terol, & Marzo, 2009). Therefore, applications of this experimental model may be useful in the clinical setting as they recognize the complexity of the phenomenon of anorexia in humans (Carretero, Sánchez, Rusiñol, Raich, & Sánchez, 2009). All these studies have implications for the development of treatments that seek solutions that can be transferred to humans (Blinder, Freeman, & Stunkard, 1970).
Conflicts of interest
The authors of this article declare no conflicts of interest.
ARTICLE INFORMATION
Manuscript received: 22/05/2013
Revision received: 30/05/2013
Accepted: 30/05/2013
DOI: http://dx.doi.org/10.5093/cl2013a12
*Correspondence concerning this article should be sent to
H├ęctor Mart├şnez.
Instituto de Neurociencias. Universidad de Guadalajara.
Francisco de Quevedo # 180, Colonia Arcos Vallarta, C.P. 44130.
Guadalajara, Jalisco. M├ęxico.
E-mail: hectorm@cencar.udg.mx and iris_lorenag@hotmail.com
References
Blinder, B. J. Freeman, D. M. A., & Stunkard, A. J. (1970). Behavior therapy of anorexia nervosa effectiveness of activity as a reinforcer of weight gain. The American Journal of Psychiatry, 126, 1093-1098.
Boakes, R. A. (1997). Wheels, clocks, and anorexia in the rat. In M. E. Bouton & M. S. Fanselow (Eds.), Learning, motivation and cognition: The functional behaviorism of Robert C. Bolles (pp. 163-176). Washington, DC: American Psychological Association.
Boakes, R. A., & Dwyer, D. M. (1997). Weight loss in rats produced by running: Effects of prior experience and individual housing. Quarterly Journal of Experimental Psychology, 50 , 129-148.
Boakes, R. A., & Juraskova, I. (2001). The role of drinking in the suppression of food intake by recent activity. Behavioral Neuroscience,3, 718-730.
Boakes, R. A., Mills, K. J., & Single, J. P. (1999). Sex differences in the relationship between activity and weight loss in the rat. Behavioral Neuroscience, 113, 1080-1089.
Cano, C., Guti├ęrrez, M., & Pell├│n, R. (2006). Preexposici├│n al programa de comida y desarrollo de anorexia basada en actividad en ratas. International Journal of Psychology and Psychological Therapy, 6 , 273-286.
Carretero, G. A., S├ínchez, P. L., Rusi├▒ol, E. J., Raich, E. R. M., & S├ínchez, C. D. (2009). Relevancia de factores de riesgo, psicopatolog├şa alimentaria, insatisfacci├│n corporal y funcionamiento psicol├│gico en pacientes con TCA. Revista de Psicolog├şa Cl├şnica y Salud , 20(2), 145-157.
Dixon, D. P., Ackert, A. M., & Eckel, L. A. (2003). Development of, recovery from, activity-based anorexia in female rats. Physiology & Behavior, 80, 273-279.
Dwyer, D. M., & Boakes, R. A. (1997). Activity-based anorexia in rats as failure to adapt to a feeding schedule. Behavioral Neuroscience, 1, 195-205
Doerries, L. E., Stanley, E. Z., & Aravich, P. F. (1991). Activity based anorexia: Relationship to gender and activity-stress ulcers. Physiology and Behavior, 52, 123-125.
Eckel. L. A., Houpt, T. A., & Geary, N. (2000). Spontaneous meal patterns in female rats with and without access to running wheels. Physiology & Behavior, 70, 397-405.
Epling, W. F., Pierce, W. D., & Stefan, L. (1983). A theory of activity-based anorexia. International Journal of Eating Disorders, 2 , 27-46.
Epling, W. F., & Pierce, W. D. (1988). Activity-based anorexia: a biobehavioral perspective. International Journal of Eating Disorders, 7 , 475-485.
Epling, W. F., & Pierce, W. D. (1992). Solving the anorexia puzzle: A scientific approach . Toronto: Hogrefe & Huber.
Erlanson-Albertsson, C. (2005). How palatable food disrupts appetite regulation. Basic & Clinical Pharmacology & Toxicology , 97, 61-73.
Favaro, A., Caregaro, L., Burlina, A. B., & Santonastaso, P. (2000). Tryptophan levels, excessive exercise, and nutritional status in anorexia nervosa. Psychosomatic medicine, 4, 535-538.
Gomez-Pinilla, F., Ying, Z., Roy, R. R., Molteni, R., & Edgerton, V. R. (2002). Voluntary exercise induces a BDNF-mediated mechanism that promotes neuroplasticity. Journal of Neurophysiology, 88,2187-2195.
Guti├ęrrez, D. M., & Pell├│n, R. (2002). Anorexia por actividad: una revisi├│n te├│rica y experimental. International Journal of Psychology and Psychological Therapy , 2,131-145.
Lambert, K. G., & Kinsley, C. H. (1993). Sex differences and gonadal hormones influence susceptibility to the activity stress paradigm. Physiology and Behavior, 53, 1085-1090.
Lett, B. T., Grant, V. L., Smith, J. F., & Koh, M. T. (2001). Preadaptation to the feeding schedule does not eliminate activity-based anorexia in rats. Quarterly Journal of Experimental Psychology, 54B , 193-199.
Logue, A. W. (2004). Strictly about females. En A. W. Logue (Ed.), The Psychology of eating and drinking (pp. 237-253). USA: Taylor & Francis Books.
Millenson, J. R. (1967). Principles of behavior analysis. New York: The Macmillan Company. Par├ę, W. P. (1975). The influence of food consumption and running activity on the activity stress ulcer in the rat. American Journal of Digestive Disease, 20 , 262-273.
Par├ę, W. P., Vicent, G. P., Isom, K. E., & Reeves, J. M. (1978). Sex differences and the incidence of activity stress ulcers in the rat. Psychological Reports, 43, 591-594.
P├ęrez-Padilla, ├ü., Magalh├úes, P., & Pell├│n, R. (2010). The effects of food presentation at regular or irregular times on the development of activity-based anorexia in rats. Behavioural Processes, 84, 541-545.
Pierce, W. D., & Epling, W. F. (1986). Deprivation and satiation: The interrelations between food and wheel running. Journal of the Experimental Analysis of Behavior , 46,199-210.
Premack, D., & Premack, A. J. (1963). Increased eating in rats deprived of running. Journal of Experimental Analysis of Behavior , 6, 209-212.
Quiles, M. Y., Terol, C. C., & Marzo, C. J. C. (2009). Representaci├│n de la enfermedad, afrontamiento y ajuste en los trastornos alimentarios. Revista de Psicolog├şa Cl├şnica y Salud , 20(2), 159-175.
Rolls, B. J., & Rowe, E. A. (1979). Exercise and the development and persistence of dietary obesity in male and female rats. Physiology and Behavior, 23, 241-247.
Routtenberg, A., & Kuznesof, A. W. (1967). Self-starvation of rats living in activity wheels on a restricted feeding schedule. Journal of Comparative and Physiological Psychology, 64 , 414-421.
Routtenberg, A. (1968). "Self-starvation" of rats living in activity wheels: Adaptation effects. Journal of Comparative and Physiological Psychology, 66 , 234-238.
Spatz, C., & Jones, S. (1971). Starvation anorexia as an explanation or "self-starvation of rats living in activity wheels. Journal of Comparative and Physiological Psychology, 2 , 313-317.
Tokuyama, K., Saito, M., & Okuda, H. (1982). Effects of wheel running on food intake and weight gain of male and female rats. Physiology and Behavior, 28, 899-903.
Verplank, W. S., & Hayes, J. R. (1953). Eating and drinking as a function of maintenance schedule. The Journal of Comparative and Physiological Psychology, 46 , 327-333.
Copyright © 2026. Colegio Oficial de la Psicología de Madrid








 CrossRef

