


Assessing Job Performance Using Brief Self-report Scales: The Case of the Individual Work Performance Questionnaire
[La evaluaci├│n del desempe├▒o en el trabajo con escalas de autoinforme breves: el cuestionario de desempe├▒o laboral individual]
Pedro J. Ramos-Villagrasa1, Juan R. Barrada1, Elena Fern├índez-del-R├şo1, and Linda Koopmans2
1Universidad de Zaragoza, Spain; 2TNO Healthy Living, Leiden, The Netherlands
https://doi.org/10.5093/jwop2019a21
Received 24 July 2018, Accepted 7 September 2019
Abstract
Job performance is considered the “ultimate dependent variable” in human resource management, turning its assessment into a capital issue. The present study analyzes the functioning of a brief 18-item self-report scale, the Individual Work Performance Questionnaire (IWPQ), which measures the main dimensions of job performance (task performance, contextual performance, and counterproductive behaviors) in a wide variety of jobs. Participants were 368 employees who voluntarily answered a questionnaire including the IWPQ, other performance scales, and the NEO-FFI. Descriptive statistics, exploratory structural equation modeling, and correlations were performed. Results show that the IWPQ has a tridimensional structure with adequate reliability, exhibits significant associations with other measures of performance, and its association with personality traits is similar in terms of direction and strength of the correlations between other job performance measures and personality. We conclude that the IWPQ is an adequate measure of job performance but with emphasis on behaviors aimed toward organizations.
Resumen
El desempeño laboral es considerado la “variable dependiente definitiva” en recursos humanos, convirtiendo su evaluación en algo crucial. El presente estudio analiza el funcionamiento de una escala autoinformada breve de 18 ítems, el Individual Work Performance Questionnaire (IWPQ), que mide las principales dimensiones del desempeño laboral (desempeño de tarea, desempeño contextual y comportamientos contraproductivos en el trabajo) en una amplia variedad de trabajos. Los participantes fueron 368 empleados que voluntariamente completaron un cuestionario que incluía el IWPQ, otras escalas de desempeño y el NEO-FFI. Se llevaron a cabo estadísticos descriptivos, modelos exploratorios de ecuaciones estructurales y correlaciones. Los resultados muestran que el IWPQ tiene una estructura tridimensional con una fiabilidad adecuada, mostrando asociaciones significativas con el resto de medidas de desempeño. En cuanto a los factores de personalidad, el IWPQ muestra correlaciones similares a las de los otros instrumentos de desempeño analizados. Se concluye que el IWPQ es un instrumento adecuado para medir de manera breve y autoinformada el desempeño laboral, pero con énfasis en los comportamientos dirigidos hacia la organización.
Palabras clave
Desempe├▒o laboral, Desempe├▒o de tarea, Desempe├▒o contextual, Conductas contraproductivas en el trabajo, Adaptaci├│n, Escala autoinformada breve.Keywords
Job performance, Task performance, Contextual performance, Counterproductive work behaviors, Adaptation, Brief self-report scale.Cite this article as: Ramos-Villagrasa, P. J. , Barrada, J. R. , Fern├índez-del-R├şo, E. , & Koopmans, L. (2019). Assessing Job Performance Using Brief Self-report Scales: The Case of the Individual Work Performance Questionnaire. Journal of Work and Organizational Psychology, 35, 195 - 205. https://doi.org/10.5093/jwop2019a21
Correspondence: pjramos@unizar.es (P. J. Ramos-Villagrasa).Job performance is considered the ultimate criterion in human resource management (Organ & Paine, 1999). Its assessment and analysis is capital for different organizational processes, such as personnel selection, compensation and rewards, or training. Regardless of the purpose of the evaluation, organizations need accurate ratings of performance, and even better if they produce the same results while saving time and effort (DeNisi & Murphy, 2017). This paper is aimed to contribute in this regard, analyzing a brief self-report job performance scale suitable for a broad set of jobs, which includes the three main dimensions of job performance (i.e., task performance, contextual performance, and counterproductive work behavior). Dimensionality of Job Performance Following the review by Campbell and Wiernik (2015), job performance is a construct that comprises behaviors under workers’ control that contribute to organizational goals. These authors emphasize that performance is a set of behaviors, not the variables that determine these behaviors or their outcomes. The definition is quite open because it is the only way to describe a phenomenon that varies substantially across jobs (Aguinis, 2013) and time (Sackett & Lievens, 2008). However, there is consensus regarding the multidimensional nature of performance (Dalal, Baysinger, Brummel, & Lebreton, 2012). Although different dimensions have been proposed, such as safety performance (Burke, Sarpy, Tesluk, & Smith-Crowe, 2002) and adaptive performance (Pulakos, Arad, Donovan, & Plamondon, 2000), there are three major domains of job performance (Sackett & Lievens, 2008): task performance, contextual performance, and counterproductive work behavior. Together, these dimensions provide a relatively comprehensive and parsimonious approach to overall job performance (Dalal et al., 2012). Following Rotundo and Sackett (2002), we are going to define each of these dimensions. The first one is task performance, which refers to “behaviors that contribute to the production of a good or the provision of a service” (p. 67). It entails behaviors that vary across jobs, likely to be role-prescribed and that are usually included in job description (Aguinis, 2013). As it is related to core job tasks, it is difficult to find generic frameworks for task performance, so context-specific frameworks are used instead. For instance, Salgado and Cabal (2011) developed a performance appraisal for public employees according to the level of responsibility. Among high- and low-level positions, only two out of five indicators of task performance were shared: technical knowledge and productivity (in terms of quantity and quality). A step forward to a generic framework was the review performed by Koopmans et al. (2011), which included task-performance indicators, such as completing job tasks, keeping knowledge up-to-date, working accurately and neatly, planning and organizing, and solving problems, among others. The second dimension is contextual performance, also referred to as organizational citizenship behavior (OCB). It can be defined as “behavior that contributes to the goals of the organization by contributing to its social and psychological environment” (Rotundo & Sackett, 2002, pp. 67-68). It includes tasks beyond job duties, initiative, proactivity, cooperating with others, or enthusiasm (Koopmans et al., 2011). The distinction with task performance is that in contextual performance the effective functioning of the organization is promoted, but not necessarily with a direct effect on workers’ productivity (MacKenzie, Podsakoff, & Fetter, 1991). Later studies, such as those by Hoffman, Blair, Meriac, and Woehr (2007), support the distinction between task and contextual performance. However, the dimensionality of contextual performance itself has also been investigated. For example, Werner (1994) proposed two dimensions: one regarding behaviors directed toward the organization (e.g., suggesting work improvements), and another toward the people (e.g., helping others). Further meta-analytic studies have found that multidimensional approaches are best interpreted as indicators of a general, latent, unidimensional construct (Hoffman et al., 2007; Lepine, Erez, & Johnson, 2002). The third dimension is counterproductive work behavior, which is defined as “voluntary behavior that harms the well-being of the organization” (Rotundo & Sackett, 2002, p. 69). It comprises off-task behavior, presentism, complaining, doing tasks incorrectly on purpose, and misusing privileges, among others (Koopmans et al., 2011). These deviant behaviors are related to negative consequences at the personal (Aubé, Rousseau, Mama, & Morin, 2009) and organizational (Rogers & Kelloway, 1997) levels. Although counterproductive work behavior has a considerable relationship with contextual performance, the meta-analysis performed by Dalal (2005) demonstrated that each dimension had its own identity and domain. Within the counterproductive work behavior domain, we can find a bidimensional structure (Berry, Ones, & Sackett, 2007; Robinson & Bennett, 1995; Sackett & DeVore, 2001), comprising deviant behaviors related to people (e.g., gossiping about coworkers) and to organizations (e.g., absenteeism). However, empirical research on counterproductive work behavior shows recent examples of unidimensional (e.g., Baloch et al., 2017; Navarro-Carrillo, Beltrán-Morillas, Valor-Segura, & Expósito, 2018; Rehman & Shahnawaz, 2018) and multidimensional approaches (e.g., Bragg & Bowling, 2018; Fernández del Río, Barrada, & Ramos-Villagrasa, 2018; Fine & Edward, 2017; Morf, Feierabend, & Staffelbach, 2017). The Measure of Job Performance Being able to measure performance with adequate instruments is as important as describing it. From our point of view, this is related to at least two issues: variability across raters and the degree of job-specificity needed. Regarding raters, most researchers and practitioners trust job performance scales, but the difference lies in “who” completes them: supervisors, peers, subordinates, or the workers themselves. The fact that job performance scores vary according to the rater is undisputable (Murphy, 2008). In Woehr’s (2008, p. 163) words, “the lack of agreement across sources may reflect true differences resulting from differences in perspectives or opportunities to observe performance.” Multi-rater assessments may help to understand performance, but this cannot be simply resolved by pooling samples (Adler et al., 2016). In consequence, researchers agreed that different raters provide different perspectives of workers’ performance, and the use of one or another rater depends on researchers’ purposes (Scullen, Mount, & Goff, 2000). Self-evaluations tend to be more favorable than other-evaluations (DeNisi & Murphy, 2017), making them less frequent in applied contexts. Nevertheless, self-reports have some advantages that should be recognized, namely (Koopmans, Bernaards, Hildebrandt, & van Buuren, 2013): (1) they allow measuring job performance in occupations where other measures are difficult to obtain (e.g., high-complexity jobs); (2) unlike the remaining stakeholders, employees have the opportunity to observe all their own behaviors; (3) peers and managers rate performance considering their general impression of the employee (i.e., halo effect); and (4) they are easy to collect and reduce problems with missing data and confidentiality problems. Thus, the use of self-report measures of performance is still useful. The second issue is the level of specificity needed. More than sixty years ago, Cronbach and Gleser (1957) brought up the debate about the use of general or specific measures (or broadness vs. narrowness), which has been called the bandwidth-fidelity dilemma. As Judge and Kammeyer-Mueller (2012) state, it makes “little sense to use a specific measure of a predictor to predict a general behavior” (p. 168). Although the dilemma has been centered on the level of specificity that predictors need to approach the criterion (e.g., Bragg & Bowling, 2018; Salgado et al., 2015), we want to point out the stress on the latter (in our case, job performance). Job performance can be operationalized in very different ways depending on our purposes, ranging from broad descriptions of behaviors (e.g., demonstrating effort, industriousness, adaptability) to narrow ones (e.g., written and oral communications, attendance, adherence to rules). As an example, the meta-analysis of Salgado et al. (2015) found 10 different job-performance measures, each one with its own degree of specificity, whilst the theoretical review developed by Koopmans et al. (2011) found 17 generic frameworks and 18 job-specific frameworks of job performance. This situation confines researchers to studying particular situations and multiplies the amount of measures of job performance, hindering the generalization of their findings (Viswesvaran & Ones, 2017). According to the review performed by Koopmans, Bernaards, Hildebrandt, De Vet, and Van Der Beek (2014), existing scales of task performance, contextual performance, and counterproductive work behavior show several limitations: (1) none of them measure all of the main dimensions of individual work performance together; thus, they do not measure the full range of individual work performance; (2) the joint use of scales for different dimensions can include antithetical items, creating an overlap between these scales; and (3) none of the scales seem suitable for generic use, which might help to overcome the generalization problems. These limitations are especially noteworthy in non-Anglo-Saxon countries, where the available scales are considerably fewer. For example, in Spain, the available job performance scales suitable for overall working population (i.e., published in peer-review journals, with evidence of reliability and validity in workers of different occupations and sectors, with items included in the paper or available upon request from the research team) are scarce. Among the exceptions, we can mention two scales for contextual performance (i.e., Dávila & Finkelstein, 2010; Díaz-Vilela, Díaz-Cabrera, Isla-Díaz, Hernández-Fernaud, & Rosales-Sánchez, 2012), and one for counterproductive behaviors (i.e., Fernández del Río et al., 2018). Summarizing the already outlined issues, to advance research, it seems interesting to have an instrument that measures job performances and that: (1) is brief, saving time in data collection (DeNisi & Murphy, 2017); (2) is a self-report and generic, allowing its use in many different contexts and jobs (Koopmans, Bernaards, Hildebrandt, van Buuren et al., 2013); and (3) comprises at least the main dimensions of job performance, avoiding the problems related to the joint use of different performance scales (Koopmans et al., 2014). The Individual Work Performance Questionnaire (IWPQ) meets all these criteria. The Individual Work Performance Questionnaire The Individual Work Performance Questionnaire (Koopmans, 2015) is an 18-item scale developed in The Netherlands to measure the three main dimensions of job performance: task performance, contextual performance, and counterproductive work behavior. All items have a recall period of three months and a 5-point rating scale (0 = seldom to 4 = always for task and contextual performance; and 0 = never to 4 = often for counterproductive work behavior). A mean score for each IWPQ scale can be calculated by adding the item scores, and dividing their sum by the number of items in the scale. Item wording is included in Table 1. Table 1 Item Descriptives and Factor Loadings of the Individual Workplace Performance Questionnaire 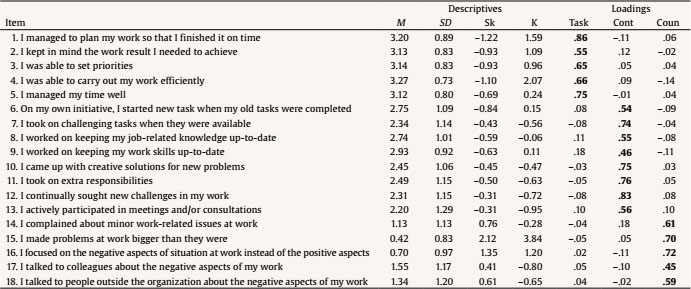 Note. M = mean; SD = standard deviation; Sk = skewness; K = kurtosis; Task = task performance; Cont = contextual performance; Coun = counterproductive behaviors. Bold loadings indicate loadings over |.30|. Loadings are those of the ESEM model with two pairs of correlated uniquenesses (M3). The operationalization of the IWPQ scales was based on a systematic review of the occupational health, work and organizational psychology, and management and economics literature (Koopmans et al., 2011) and a study by Koopmans, Bernaards, Hildebrandt, De Vet, and van der Beek (2013). In the latter study, Koopmans, Bernaards, Hildebrandt, De Vet et al. (2013) identified all possible indicators of job performance dimensions from the literature, existing questionnaires, and expert interviews. It yielded 317 potential items belonging to four dimensions of job performance: task performance, contextual performance, counterproductive behaviors, and adaptive performance. The items were reduced to 128 after removing indicators that overlapped among dimensions and variables that were determinants of job performance and not of performance itself (e.g., motivation). Subsequently, agreement among 253 experts from different professional backgrounds and countries was reached on the most relevant, generic indicators per scale. It is remarkable that experts came from different professions (44.7% were researchers, 21.3% were human resource managers, 19.0% were managers, and 15.0% were occupational health professionals), and mostly with six or more years of experience (77%). This study led to developing an initial version of the IWPQ (Koopmans, Bernaards, Hildebrandt, van Buuren et al., 2013), aimed to be used on generic working population, avoiding antithetical items among dimensions. For this purpose, Koopmans, Bernaards, Hildebrandt, van Buuren et al. (2013) developed a pilot test with researchers (N = 54) and a field test with Dutch workers from different occupational sectors (N = 1,181), including blue, pink, and white collar jobs. In the pilot test, researchers were asked whether they thought the questionnaire actually measured individual job performance, whether any questions were redundant, and whether any important questions were missing. In the field test, workers were asked whether the items were applicable to their occupation. As result, the authors reached a generic scale with three dimensions: task performance, contextual performance, and counterproductive behaviors. Although IWPQ initially considered adaptive performance, the items related to this dimension were included in contextual performance. This version of IWPQ has been adapted to American-English language in a further study (Koopmans et al., 2016) in which they asked American workers (N = 40) whether they thought the questionnaire actually measured individual work performance, and whether all relevant facets of individual work performance were assessed. Based on the aforementioned studies (Koopmans, Bernaards, Hildebrandt, van Buuren et al., 2013; Koopmans et al., 2016), the content validity of the IWPQ was judged to be good. IWPQ scores showed sufficient convergent validity and very good discriminative validity in a sample of 1,424 Dutch workers from different occupational sectors (Koopmans, et al., 2014). Although the IWPQ seems adequate, one more thing is missing: further evidence of convergent validity. It is true that Koopmans (2015) provides evidence of the relationship of IWPQ with variables related to job performance such as presentism, work engagement, or job satisfaction, but we consider that is necessary for the IWPQ to demonstrate its relationship with existing measures of job performance and with predictors such as personality, whose relationship with performance has been highlighted in previous studies (e.g., Barrick & Mount, 1991). The present study is aimed at providing this evidence. The Present Study With our study, we want to analyze the IWPQ and provide evidence of its validity. As the study was developed in Spain, we needed to translate the scale into Spanish. Our first hypothesis was that the Spanish version of IWPQ would demonstrate the same structure (i.e., task performance, contextual performance, counterproductive work behavior) and adequate reliability as the original version (Koopmans, 2015): H1: Spanish IWPQ will show a tridimensional structure as in the original version, and each dimension will show adequate reliability. Moreover, meta-analytic studies demonstrated that the three dimensions of job performance were related to each other. Thus, Podsakoff, Whiting, Podsakoff, and Blume (2009) found a significant correlation between task performance and contextual performance behaviors directed toward organization (r = .54) and toward individuals (r = .47). Viswesvaran, Schmidt and Ones (1999, quoted by Sackett, 2002) reported a correlation of counterproductive work behavior with task performance of -.57, and of -.54 with contextual performance. Lastly, Dalal (2005) and Berry et al. (2007) found correlations of -.11 and -.32 between contextual performance and counterproductive work behavior. Thus, following prior research and Cohen’s (1992) criterion for effect size (i.e., .10-.29 is small, .30-.49 is medium, .50 or higher is large), we hypothesize the following: H2: The dimensions of IWPQ and the dimensions of other job performance measures will show a medium or large correlation between each other. Continuing with convergent validity, several meta-analyses have demonstrated the role of the “Big Five” personality traits as predictors of performance. Thus, conscientiousness and neuroticism have generalized validity across countries, organizations, and occupations (Barrick & Mount, 1991; Hurtz & Donovan, 2000; Salgado, 2003). Moreover, agreeableness and openness to experience also have a significant and positive relationship with contextual performance (e.g., Borman, Penner, Allen, & Motowidlo, 2001; Chiaburu, Oh, Berry, Li, & Gardner, 2011), and agreeableness has a significant and negative relationship with counterproductive work behavior (Salgado, 2002). Taking all this evidence into account, we propose the following hypotheses between IWPQ and personality: H3: The correlations between IWPQ and personality will be similar in terms of direction and strength to the correlations between other job performance measures and personality. Participants and Procedure Three hundred and eighty-six employees (52.3% women, 47.7% men), aged between 18 and 70 years (M = 39.00, SD = 13.92), from different organizations were involved in the study. Their average job tenure was 8.61 years (SD = 10.05) and their organizational tenure was 10.51 years (SD = 11.27). Data were collected through the voluntary collaboration of degree students of the Faculty of Work and Social Sciences from the University of Zaragoza (Spain). They distributed the questionnaires following a non-probability sampling, seeking workers in any job. Participants voluntarily agreed to fill out the questionnaire with the variables of interest. They were informed about anonymity and the research objectives of this survey. The open database and code files for these analyses are available at the Open Science Framework repository at https://osf.io/y2t5n Instruments Sociodemographic and work behavior questionnaire. We asked participants about their sex, age, job tenure, organizational tenure, and job experience. Individual Work Performance Questionnaire (IWPQ). The IWPQ has been described in the Introduction. Through a back-translation procedure (Muñiz, Elosua, & Hambleton, 2013), the Spanish version of the IWPQ was translated from the 18-item version of the latest version of the English instruction manual (Koopmans, 2015). In our case, three native Spanish-speakers translated the scale from English to Spanish, reviewed the translation together and agreed on a single version of the scale. Finally, a native professional translator reviewed the correspondence between the English and Spanish versions, which agreed with the translated version. The Spanish version can be seen in the Appendix. Organizational Citizenship Behavior Scale (OCB). We used the scale developed by Lee and Allen (2002) adapted to a Spanish population (Dávila & Finkelstein, 2010). The scale comprises 16 items with a 5-point Likert type response format ranging from 1 (never) to 5 (always). The instrument assesses two dimensions with eight items per dimension: OCB aimed at the organization (OCB-O; e.g., “Demonstrate concern about the image of the organization”), and OCB aimed at individuals (OCB-I; e.g., “Give up time to help others who have work or nonwork problems”). Both dimensions have adequate observed reliability in our sample (α = .83 for OCB-O and α = .87 for OCB-I). Total scores were computed as the sum of the scores of each item. Workplace Deviation Scale (CWB). We applied the Spanish version (Fernández del Río et al., 2018) based on the original version by Bennett and Robinson (2000). This instrument includes two scales with a 7-point Likert type response format ranging from 1 (never) to 7 (daily) to measure counterproductive work behavior: a 12-item scale of organizational deviance (CWB-O, e. g., “Taken property from work without permission”) and a 7-item scale of interpersonal deviance (CWB-I, e.g., “Said something hurtful to someone at work”). Both dimensions have adequate observed reliability in our sample (α = .85 for organizational deviance and α = .86 for interpersonal deviance). Total scores were computed as the sum of the scores of each item. Big Five personality traits1. Personality was assessed with the 60 items of the Spanish version of the NEO-FFI (Costa & McCrae, 2008). The items are rated on a 5-point Likert scale ranging from 1 (strongly disagree) to 5 (strongly agree). Observed reliability indexes are appropriate (α = .79 for Neuroticism, α = .84 for Extraversion, α = .73 for Openness to Experience, α = .73 for Agreeableness, and α = .77 for Conscientiousness). Total scores were computed as the sum of the scores of each item. Data Analysis Firstly, we computed the descriptive statistics of the IWPQ items (mean, standard deviation, skewness, and kurtosis) and scales (mean, median, standard deviation, first quartile, third quartile, skewness, and kurtosis) and reliabilities (Cronbach’s alpha). Secondly, we studied the internal structure of the IWPQ with exploratory structural equation modeling (ESEM) and with confirmatory factor analysis (CFA). Thirdly, we aggregated item scores to develop the scores of each variable. The association of the IWPQ scales and the other variables were assessed with Pearson correlations, both with raw data and with rank-based inverse normal transformation. For the ESEM models, we used target rotation. As described by Asparouhov and Muthen (2009), “[c]onceptually, target rotation can be said to lie in between the mechanical approach of EFA [exploratory factor analysis] rotation and the hypothesis-driven CFA model specification. In line with CFA, target loading values are typically zeros representing substantively motivated restrictions. Although the targets influence the final rotated solution, the targets are not fixed values as in CFA, but zero targets can end up large if they do not provide good fit” (p. 409). Goodness of fit of all the derived models was assessed with the common cut-off values for the fit indices (Hu & Bentler, 1999): CFI and TLI with values greater than .95 and RMSEA less than .06 were indicative of a satisfactory fit. Localized areas of strain were assessed with modification indexes (MI). Models were analyzed using robust maximum likelihood estimator (MLR estimator in MPlus), an appropriate estimator for items with five response options (Rhemtulla, Brosseau-Liard, & Savalei, 2012) and departure from multivariate normality (Muthén & Muthén, 2015). For all the factor models, we interpreted the standardized solution (STDYX solution in MPlus). The default rotation in MPlus, Geomin, was applied. All the analyses were performed with R 3.6 (R Core Team, 2019) except for ESEM, which was performed with MPlus 7.4 (Muthén & Muthén, 2015). All the aforementioned techniques are well known in organizational research except for ESEM and correlations with transformed data. Thus, we are going to explain these techniques and their advantages. Exploratory structural equation modeling (ESEM; Asparouhov & Muthen, 2009) is a technique that, unlike CFA, permits all items to load on all factors, and, unlike EFA, permits the correlation between item uniquenesses. We shall present the characteristics of ESEM through comparison with the main limitations of other methods for the assessment of the internal structure of tests, such as EFA and CFA. EFA is usually referred to as a data-driven technique (Fabrigar, Wegener, MacCallum, & Strahan, 1999) and is commonly used with the aim of obtaining a simple and interpretable structure. Basically, and as far as this study is concerned, there is an important limitation to EFA (e.g., Brown, 2006): when items share any element in their wording without theoretical relevance, they may show greater covariance than can be explained merely by their relation to the measured constructs. In these cases, the interpretation of the internal structure of the questionnaire may become complex or actually misleading (e.g., Sánchez-Carracedo et al., 2012). CFA is considered a theory-driven technique, as the number of dimensions and the item-factor relationship with which the covariance matrix will be explained must be supported by a strong previous theory or by previous EFAs in which a simple structure has been found. In a CFA, the factor loadings are usually estimated with the restriction that each item will only load on the expected factor, the other loadings being fixed to 0. Correlated uniqueness can be included in the model in such a way that the loadings are not distorted by spurious factors or redundant items. The main limitation of CFA is the restrictive assumption: The factor structure is fully simple (Asparouhov & Muthen, 2009). Whereas in the EFA context, simple structure implies no salient loadings on the secondary dimensions, in the CFA context, simple structure means no loading at all. In CFA, any nonmodeled loading different from 0 in the population reduces the model fit and can bias the results. When minor cross-loadings are fixed to 0, the correlations between dimensions are distorted (Asparouhov & Muthen, 2009; Garrido et al., 2018). ESEM, like EFA, permits the estimation of the factor loadings of all items in all factors, so that the problem of fixing the cross-loadings to 0 disappears. When the loading matrix of the population includes cross-loadings, ESEM recovers this matrix better than CFA and is not subject to its parameter estimation bias. As such, ESEM may be the most appropriate model for the IWPQ. As noted by Barrada et al. (2019, p. 9), “ESEM models should be preferred over CFA models when they yield better fits, when substantial cross-loadings exist, or when inter-factor correlations differ among solutions.” Correlations with transformed data. In this section, we follow the descriptions by Bishara and Hittner (2012, 2015). It is known that when data are nonnormally distributed, a Pearson’s r significance test may inflate Type I error rates and reduce power. Nonnormality can also lead to an increment of random fluctuations of point estimates of the correlations. Type I and Type II error rates are minimized by transforming the data to a normal shape prior to assessing the Pearson correlation. Data transformation also reduces random error of the correlation estimation. Among the different data transformations, the one that seems to provide better statistical performance is rank-based inverse normal transformation. This transformation can approximately normalize any distribution shape. Raw data are, firstly, converted into ranks. Then, the ranks are converted into probabilities. Finally, using the inverse cumulative normal function, these probabilities are converted into an approximately normal shape. Correlations (and significance tests of those correlations) are computed with those transformed scores. Considering that we could expect the IWPQ scores to be nonnormal (self-report of performance could lead to ceiling or floor effects), we tested associations between scores with correlations both with raw (untransformed) data and with rank-based inverse normal transformation. Item Descriptives of the IWPQ The descriptives of the items are included in Table 1. As can be seen, the items of the counterproductive work behavior dimension presented lower means (Mmean = 1.03, range [0.42, 1.55]) than task (Mmean = 3.17, range [3.12, 3.27]) and contextual performance (Mmean = 2.62, range [2.20, 2.93]). In line with these means, task and contextual items had negative skewness (MSk = -0.97 and -0.51, respectively), whereas counterproductive work behavior items had positive skewness (MSk = 1.05). Kurtosis had a mean value of 0.34, with a range between -0.95 and 3.84. Internal Structure and Reliability of the IWPQ The fit of the different models can be seen in Table 2. The initial ESEM model (model 1; M1) offered an unsatisfactory model fit (CFI = .914, TLI = .871, RMSEA = .065). The higher MI corresponded to the correlation between the uniquenesses of Items 17 and 18 (MI = 77.5). The two items are equivalent in their wording except for a few words: “I talked to colleagues [people outside the organization] about the negative aspects of my work.” In the second model (M2), we included this new parameter, which led to a marked improvement in model fit (ΔCFI = .036, ΔTLI = .053, ΔRMSEA = -.015), although with a TLI still below the conventional cut-off value. Now, the higher MI corresponded to the correlation between the uniquenesses of Items 8 and 9 (MI = 53.1). Again, the wording was redundant to an important degree: “I worked on keeping my job-related knowledge [work skills] up-to-date.” When this new parameter was included in the final ESEM model (M3), we also found a relevant improvement in model fit (ΔCFI = .027, ΔTLI = .041, ΔRMSEA = -.016) and an adequate fit (CFI = .977, TLI = .965, RMSEA = .034). In this final model, all the MIs were much smaller (maxMI = 22.9). For all the CFA models (M4–M6), model fit was markedly worse than the fit of the respective ESEM model (maxΔCFI = .033, maxΔTLI = .027, maxΔRMSEA = –.011). So we considered that the preferred model to model the internal structure of the IWPQ responses was an ESEM model with two correlated uniquenesses (M3). Table 2 Goodness of Fit Indices for the Different Models 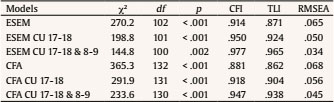 Note. df = degrees of freedom; TLI = Tucker-Lewis index; CFI = comparative fit index; RMSEA = root mean square error of approximation; ESEM = exploratory structural equation modeling; CFA = confirmatory factor analysis; CU = correlated uniqueness. In this model, the correlation between uniquenesses for Item 17 – Item 18 was .52, and .42 for Item 8 – Item 9. The size of the primary loadings was satisfactory (Mloading = .65, range [.45, .86]). All the items showed high loadings on their intended factor. All the cross-loadings were small (maximum cross-loading = .18). Item loadings of M3 can be seen in Table 2. In the selected model, task performance and contextual performance correlated at .46; task performance and counterproductive work behavior correlated at -.35; and contextual performance and counterproductive work behavior correlated at -.05. Reliability of the scores was adequate (α = .83, α = .87, and α = .77 for task performance, contextual performance, and counterproductive work behavior dimensions, respectively). These patterns of results were evidence supporting H1. Descriptives and Associations with Other Variables Descriptives and the associations with the measured variables can be seen in Table 3. Regarding descriptives, for the three different IWPQ scores, it should be noted that the skewness and kurtosis values were always clearly below |1|. We want to stress that both scores of the Workplace Deviation Scale had higher skewness (2.09 and 3.30) and kurtosis (5.67 and 13.47) values than the remaining variables, whose absolute values were below 0.88 for skewness and 0.67 for kurtosis. Table 3 Descriptive Statistics and Correlations of the Different Variables 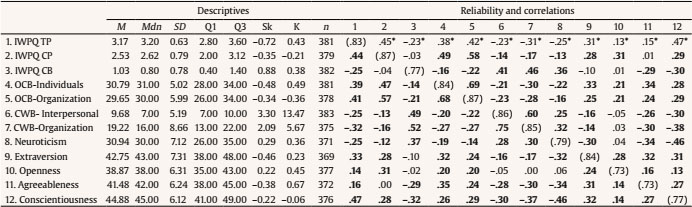 Note. M = mean; Mdn = median; SD = standard deviation; Q1 = first quartile; Q3 = third quartile; Sk = skewness; K = kurtosis; n = sample size; IWPQ = Individual Work Performance Questionnaire; TP = task performance; CP = contextual performance; CB = counterproductive behaviors; OCB-I = organizational citizenship behaviors aimed at individuals; OCB-O = organizational citizenship behaviors aimed at the organization; CWB-I = Workplace Deviance Scale aimed at individuals; CWB-O = Workplace Deviance Scale aimed at organization. Values in the diagonal of the correlation matrix correspond to Cronbach’s alpha. Values below the diagonal correspond to Pearson correlations with raw data. Values above the diagonal correspond to Pearson correlations with rank-based inverse normal transformation. The distributions of scale scores for the IWPQ are shown in Figure 1. The result to highlight is the ceiling effect found for task performance. Seventeen percent of the participants reached the maximum possible score for this scale. Regarding associations between variables, we compared the correlations with raw data and transformed data. The differences were negligible for all the correlations involving IWPQ scores, with a mean unsigned difference of .01. For simplicity, we will therefore focus on correlations with raw data. We begin by focusing on the IWPQ scale, where the task performance dimension showed a medium association with contextual performance, r(373) = .44, p < .001, and a small one with counterproductive work behavior, r(376) = -.25, p < .001, but contextual performance and counterproductive work behavior were not related to each other, r(375) = -.04, p = .471. Regarding the relationship between IWPQ and its association with the remaining measures of job performance, the correlations ranged from small to large (Cohen, 1992). Thus, task performance showed a medium association with OCB-I, r(375) = .39, p < .001, and OCB-O , r(372) = .31, p < .001. Its relationship with CWB-I was small, r(377) = -.25, p < .001, and medium with CWB-O, r(369) = -.32, p < .001. Regarding contextual performance, the IWPQ dimension showed a medium association with OCB-I, r(374) = .47, p < .001, and a large association with OCB-O, r(371) = .57, p < .001. However, the associations with CWB were small: r(376) = -.13, p < .001 for CWB-O and r(368) = -.16, p < .001, for CWB-I. A similar pattern was found with the counterproductive behavior of IWPQ, which showed a small association with OCB, r(377) = -.14, p < .001 for OCB-I, and r(374) = -.21, p < .001 for OCB-O, a medium association with CWB-I, r(374) = .49, p < .001, and a large association with CWB-O, r(379) = .52, p < .001. Nevertheless, the associations of OCB and CWB were also small: OCB-I had a relationship of r(378) = -.20, p < .001 with CWB-I and of r(371) = -.27, p < .001 with CWB-O, whereas OCB-O had a relationship of r(375) = -.22, p < .001 with CWB-I and of r(369) = -.27, p < .001 with CWB-O. As not all associations were medium or large, we considered H2 as partially supported. Regarding personality, task performance, which was measured only with IWPQ, had small to medium associations with all the Big Five personality traits and in the expected direction according to the literature, ranging from r(364) = -.24, p < .001 for Neuroticism to r(369) = .47, p < .001 for Conscientiousness. The dimension of contextual performance of the IWPQ showed small associations with Neuroticism, r(362) = -.12, p < .001, Extraversion, r(360) = .28, p < .001, and Conscientiousness r(367) = .28, p < .001, and a medium association with Openness, r(368) = .31, p < .001. Comparing these relationships with the OCB scale, we see two differences: (1) IWPQ demonstrated a medium association with Openness whilst OCB dimensions had a small one, OCB-I: r(371) = .20, p < .001; OCB-O: r(368) = .20, p < .001; (2) the contextual performance dimension was not related to Agreeableness, r(365) = .00, p = .944, whereas OCB-I had a medium association, r(366) = .35, p < .001, and OCB-O had a small one, r(363) = –.24, p < .001. The counterproductive dimension of IWPQ had the same pattern of associations as CWB with four of the personality traits (i.e., Neuroticism, Openness, Agreeableness, and Conscientiousness) but IWPQ did not have an association with Extraversion, r(363) = -.10, p = .052, and CWB had a small one, r(364) = -.16, p < .001 for CWB-I, and r(356) = -.17, p < .001 for CWB-O. Thus, we consider H3 as partially supported. Figure 1 Distribution of the IWPQ Scores by Dimension. Solid line corresponds to the mean value. Dashed lines, from left to right, correspond to first, second (median), and third quartile. 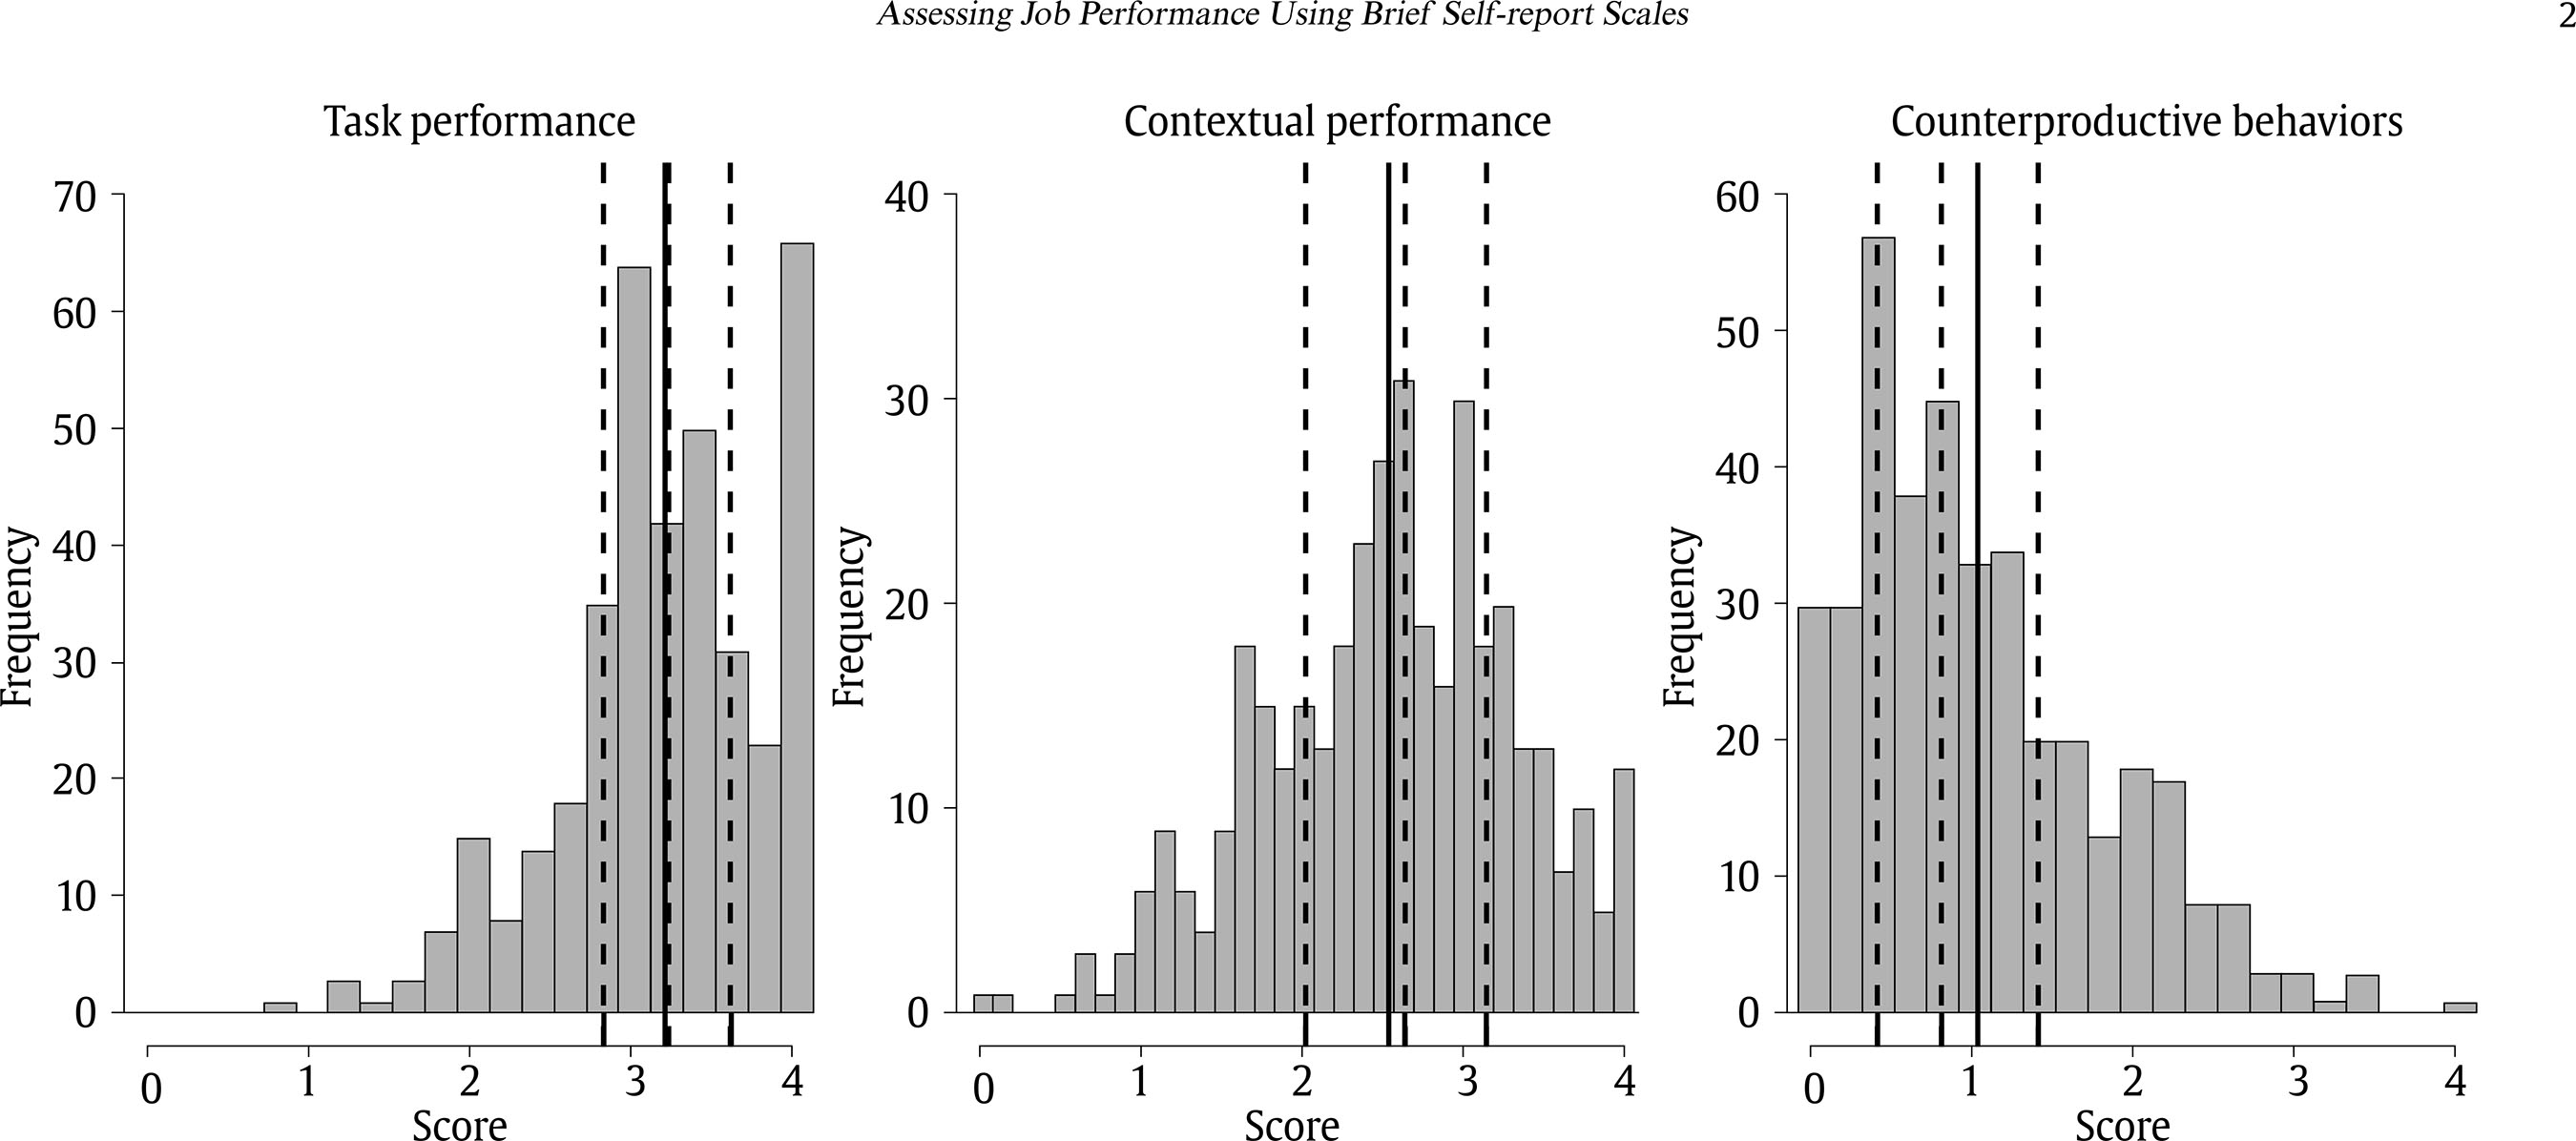 The present paper analyzes the functioning of the Spanish version of the Individual Work Performance Questionnaire (IWPQ). With our empirical study, we want to show that this scale meets the criteria to contribute to the advance of job performance research: it is a brief self-report scale that measures the three main dimensions of job performance and can be used in a wide variety of jobs. Now we want to discuss our findings in detail. Firstly, our study provides evidence that the IWPQ can be used in Spain like the original language (Koopmans, 2015) and its translation into English (Koopmans et al., 2016). It shows the same factor structure as in the original language and good internal reliability (Cronbach’s alpha). Although the cross-loadings were very small, we found that the ESEM fit was better than the CFA fit (e.g., Barrada, Castro, Correa, & Ruiz-Gómez, 2018). We detected an important degree of redundancy among two pairs of items. This should be considered in further improvements of this questionnaire. Another interesting result is the ceiling effect in the task performance scale of IWPQ. This finding is usual in self-report measures of job performance (DeNisi & Murphy, 2017), as can be seen in the scales by Carlos and Gouveia (2016), Fritz and Sonnentag (2006), Gorgievski, Bakker, and Schaufeli (2010), and Selenko, Mäkikangas, Mauno, and Kinnunen (2013), among others. In our data, only 17% of participants obtained the maximum score, which seems a relatively small effect. In any event, further research should take this into account. Continuing with extreme scores, we want to highlight an interesting result regarding counterproductive work behavior. A common problem with measures of deviant behaviors is the floor effect (Fernández del Río et al., 2018). Looking at the skewness and kurtosis of the scales used in the present study, this occurred with the CWB but not with the IWPQ. This finding supports the use of the IWPQ to measure counterproductive work behavior, as a subtle way to measure these behaviors without introducing antithetic items that overlap with contextual performance. Nevertheless, its emphasis on behaviors aimed at organization and not at interpersonal behaviors should be taken into account before its use. An unexpected result was that the contextual performance dimension and the counterproductive work behavior dimension of the IWPQ were not related. However, the two dimensions were related in the expected direction with the other scales of contextual performance (OCB) and counterproductive work behavior (CWB). The only explanation we found is that the IWPQ items of contextual performance are focused on individual behaviors (e.g., “I came up with creative solutions for new problems”) and counterproductive work behavior describes behaviors that are mainly carried out with others (e.g., “I complained about minor work-related issues at work”). The negative association between counterproductive work behavior and agreeableness support this idea, but further research should verify it. Regarding the association between the IWPQ dimensions with other measures of performance, we found a small association between the IWPQ contextual dimension and CWB dimensions, and with the IWPQ counterproductive dimension and OCB dimensions. Although this result is contrary to our hypothesis, it is also true that the relationship between OCB and CWB instruments is weak. Thus, we consider the results adequate. The results regarding the association of the IWPQ dimensions with the Big Five personality traits are mainly in accordance with our expectations, but there are three exceptions: (1) the relationship between contextual performance and Openess to Experience is higher than with OCB; (2) the lack of a significant association between contextual performance and Agreeableness; and (3) the lack of a significant association between counterproductive work behavior and Extraversion. We shall now provide some tentative explanations for these outcomes, although further research should verify them. The relationship between contextual performance and Openess to Experience and the lack of relationship with Agreeableness may be related to the content of the items. It is true that the IWPQ scale emphasizes new situations and challenges (e.g., Item 12) and extra-role behaviors (e.g., Item 11) whereas the OCB is focused on behaviors more closely related to the interaction with other people. The lack of relationship between the IWPQ counterproductive performance scale and Extraversion is also interesting. The IWPQ focuses on the more subtle forms of workplace deviations, and Extraversion is related to sociability, unrestraint, and assertiveness. It is possible that the behaviors described in the IWPQ are more subtle than those of other scales, like the CWB, which includes behaviors such as substance abuse, absenteeism, and theft. Taking all these results into account, we consider that the cross-cultural adaptation of the IWPQ to Spanish was successful. Like any instrument, its use should be supported by our purposes. The IWPQ seems a recommendable option when we want a brief but comprehensive measure of the main dimensions of job performance and we are assessing workers with substantially different jobs. Practical Implications Job performance is a complex phenomenon that should be approached in different ways depending on our purposes. The present research has shown that we can use brief scales such as the IWPQ. In research settings, this approach can be useful when we are exploring new predictors or relationships between variables. For example, there is growing research on the “dark personality” (Meedović & Petrović, 2015). The use of scales such as the IWPQ could allow the study of the incremental value of dark personality traits over the Big Five in the prediction of the three main dimensions of job performance. If evidence supporting this role is found, further research could be performed with more detailed measures like OCB or CWB. Another advantage for research is that the IWPQ has versions in Dutch and English, making it easier to perform cross-cultural studies. Our results also indicate that ESEM analysis provides a better fit in the assessment of the internal structure of instruments even when the cross-loadings are small. For the IWPQ, the maximum cross-loading was .18, but the improvement in the model with respect to a CFA model was remarkable. Thus, we consider the use of ESEM models should be extended in the research of human resources. In practitioner settings, we only recommend the use of IWPQ in very specific scenarios, such as when the scale is not used for individual evaluations (e.g., in-company or regional surveys) or when the company does not have the resources to develop specific measures of job performance, a common situation in the Spanish setting and small organizations (Alonso, Moscoso, & Cuadrado, 2015). Limitations and Recommendations for further Research This study has some shortcomings that require further examination and additional research in the assessment of job performance. First, as we could not find a task performance scale in Spain suitable for a wide set of jobs, we only compared the functioning of the IWPQ with scales of contextual performance and counterproductive work behavior. We recommend further research to develop studies with specific occupations that provide better knowledge of the functioning of the IWPQ task performance dimension compared with specific measures. We also want to acknowledge that our study focused only on self-report measures and there are differences according to the rater (Adler et al., 2016). Thus, further research should analyze whether our findings are replicated with different raters, such as supervisors or peers. Regarding further research, we recommend the study of content validity of the IWPQ using some coefficients such as Lawshe’s (1975) content validity ratio and Aitken’s (1980) coefficients to provide more evidence about its fit to the performance domain. Along with the aforementioned, we believe that it would be interesting to perform a comparative study of job performance measures with different degrees of broadness, ranging from overall performance scales to more specific instruments with different facets within dimensions. With this effort, we could determine in which situations the analysis of job performance does not need to be multidimensional, thereby simplifying its assessment. Note 1 The specific information regarding the battery is omitted because it is commercial material and to preserve its possible use in further selection processes. Cite this article as: Ramos-Villagrasa, P. J., Barrada, J. R., Fernández-del-Río, E., & Koopmans, L. (2019). Assessing job performance using brief self-report scales: The case of the individual work performance questionnaire. Journal of Work and Organizational Psychology, 35, 195-205. https://doi.org/10.5093/jwop2019a21 References |
Cite this article as: Ramos-Villagrasa, P. J. , Barrada, J. R. , Fern├índez-del-R├şo, E. , & Koopmans, L. (2019). Assessing Job Performance Using Brief Self-report Scales: The Case of the Individual Work Performance Questionnaire. Journal of Work and Organizational Psychology, 35, 195 - 205. https://doi.org/10.5093/jwop2019a21
Correspondence: pjramos@unizar.es (P. J. Ramos-Villagrasa).Copyright © 2026. Colegio Oficial de la Psicología de Madrid


 PDF
PDF e-PUB
e-PUB CrossRef
 JATS
JATS Print
Print SEND
SEND


