The Connor-Davidson Resilience Scale (CD-RISC) amongst Young Spanish Adults
[La escala de resiliencia de Connor-Davidson en adultos españoles jóvenes]
Maria-Eugenia Gras1, SĂlvia Font-Mayolas1, AlĂcia Baltasar1, Josefina Patiño1, Mark J. M. Sullman2, and Montserrat Planes1
1University of Girona, Spain; 2University of Nicosia, Cyprus
https://doi.org/10.5093/clysa2019a11
Received 5 January 2019, Accepted 5 March 2019
Abstract
The interest in resilience has grown over the last few decades due to its relationships with health, well-being, and quality of life. Several instruments have been developed to measure resilience, with one of the most common being the Connor-Davidson Resilience Scale (CD-RISC). This scale has been validated in many cultures with divergent results. This paper investigates the factor structure of the CD-RISC. Participants were 3,214 students (62.1% female, mean age = 21.01, SD = 2.86) who were randomly divided into two equal subsamples (n = 1,607). One subsample was used to explore which models best fit the data and these models were fitted using the other subsample. Confirmatory factor analysis did not support the original 5-factor CD-RISC. The analyses supported unidimensional scale structures for both the 22-item and 10-item versions of the scale. The shorter instrument reduces the time needed to answer the questionnaire, allows it to be combined with other instruments, and does not require large sample sizes.
Resumen
El interés por el estudio de la resiliencia ha aumentado en las últimas décadas debido a su relación con la salud, el bienestar y la calidad de vida. Se han desarrollado diversos instrumentos para medir la resiliencia, siendo uno de los más comunes la Escala de Resiliencia de Connor-Davidson (CD-RISC). Esta escala ha sido validada en muchas culturas con resultados diversos. En este trabajo se analiza la estructura factorial del CD-RISC en una muestra de 3,214 estudiantes (62.1% mujeres, edad media =21.01, DT = 2.86) que fueron divididos aleatoriamente en dos submuestras iguales (n = 1,607). Se exploró en una de las submuestras qué modelos se ajustaban mejor a los datos y estos modelos fueron ajustados en la otra submuestra. El análisis factorial confirmatorio no avaló la estructura de 5 factores del CD-RISC, sino que confirmó una estructura unidimensional de 22 y de 10 items. La escala de 10 items reduce el tiempo de aplicación del cuestionario, permite combinarlo con otros instrumentos y no requiere muestras muy grandes.
Palabras clave
Resiliencia, Escala de Resiliencia de Connor-Davidson (CD-RISC), Adultos jóvenes españoles.Keywords
Resilience, Connor-Davidson Resilience Scale (CD-RISC), Young Spanish adults.Cite this article as: Gras, M. , Font-Mayolas, S. , Baltasar, A. , Patiño, J. , Sullman, M. J. M. , & Planes, M. (2019). The Connor-Davidson Resilience Scale (CD-RISC) amongst Young Spanish Adults. ClĂnica y Salud, 30, 73 - 79. https://doi.org/10.5093/clysa2019a11
Correspondence: eugenia.gras@udg.edu (M. E. Gras).Resilience is not an easy concept to define and as a consequence there are several definitions of resilience. These definitions broadly take three different approaches: some researchers propose that resilience is located in the person (trait), others propose resilience as an outcome or behaviour, and others understand it as a process (Hu, Zhang, & Wang, 2015; Prince-Embury, 2013). Despite these divergent approaches, a review by Wald, Taylor, Admundson, Jang, and Stapleton (2006) identified a number of common features in these definitions: human strength, some type of disruption and growth, adaptative coping, and positive outcomes after exposure to adversity. For example, Luthar, Cicchetti, and Becker (2000) define resilience as a dynamic process encompassing positive adaptation within the context of significant adversity. Masten (2001) propose resilience as a phenomenon characterized by positive outcomes in spite of serious threats to adaptation or development. Connor and Davidson (2003) describe resilience as personal qualities that enable the person to thrive in the face of adversity. These serious threats or adversity could be understood as great stressors (e.g., bombs, victims of persecution) but also as cumulative stressful experiences in ordinary life (e.g., deaths in family) or a combination of both (Cyrulnik, 2002; Infurna & Luthar, 2017; Rolf & Glantz, 2002). Despite the fact that resilience has been criticised for its heterogeneity and complexity (Kaplan, 1999), it is considered to be a valuable concept (Prince-Embury & Saklofske, 2013) and has been used by interventions in several fields, such as protecting against adolescent substance use and drug use in adults (Hicks et al., 2014; Wingo, Ressler, & Bradley, 2014), burnout (Hao, Hong, Xu, Zhou, & Xie, 2015; Ying, Wang, Lin, & Chen, 2016), and facilitating performance in sport (Martin-Krumm, Sarrazin, Peterson, & Famose, 2003). Furthermore, high resilience has been positively associated with positive indicators of mental health (Aiena, Baczwaski, Schulenberg, & Buchanan, 2015; Benetti & Kambouropoulos, 2006; Hu et al., 2015; Martínez-Martí & Ruch, 2016; Smith, Tooley, Christopher, & Kay, 2010; Waugh, Fredrickson, & Taylor, 2008), to emotional intelligence (Liu, Wang, & Lü, 2013), as well as being negatively associated with neuroticism (Sarubin et al., 2015; Lü, Wang, Liu, & Zhang, 2014) and negative affect (Bajaj & Pande, 2015; Liu, Wang, Zhou, & Li, 2014). Unfortunately, the different tools used to measure resilience have made it difficult to compare findings and to develop preventive interventions (Prince-Embury & Saklofske, 2013; Vanderbilt-Adriance & Shaw, 2008). Windle, Bennett, and Noyes (2011) performed a systematic review of nineteen resilience scales and concluded that the scales with best psychometric properties were the Connor-Davidson Resilience Scale (Connor & Davidson, 2003), the resilience scale for adults (Friborg, Hjemdal, Rosenvinge, & Martinussen, 2003) and the brief resilience scale (Smith et al., 2008). The Connor-Davidson Resilience Scale - CD-RISC (Connor & Davidson, 2003) is one of the most common instruments to assess resilience amongst adults. Each item is rated on a five-point scale (0 = not at all true to 4 = true nearly all the time). The total score ranges from 0 to 100, with higher scores corresponding to higher levels of resilience. The original research reported that the scale included five factors: factor 1 describes the notion of personal competence, high standards, and tenacity; factor 2 relates to trust in one's instincts, tolerance to negative affect and the strengthening effects of stress; factor 3 was related to the positive acceptance of change and secure relationships; factor 4 refers to control; and factor 5 concerns spiritual influences. The scale had good psychometric properties (Cronbach's alpha = .89; test-retest reliability: intraclass correlation coefficient = .87), but the reliability of the factors was not reported. The CD-RISC has been validated in a variety of countries and cultures, such as Australia (Burns & Anstey, 2010), China (Fu, Leoutsakos, & Underwood, 2014; Wang, Shi, Zhang, & Zhang, 2010; Yu et al., 2011; Yu & Zhang, 2007), India (Singh & Yu, 2010), Korea (Baek, Lee, Joo, Lee, & Choi, 2010; Jung et al., 2012), South Africa (Jorgesen & Seedat, 2008), Spain (Manzano-García & Ayala-Calvo, 2013; Notario-Pacheco et al., 2014, 2011; Serrano-Parra et al., 2012, 2013), Turkey (Karairmak, 2010) and the United States (Burrow-Sánchez, Corrales, Ortiz, & Meyers, 2014; Campbell-Sills & Stein, 2007; Coates, Phares, & Dedrick, 2013; Fernandez, Fehon, Treloar, Ng, & Sledge, 2015; Green et al., 2014; Lamond et al., 2009), among others. Nevertheless, many of these validations failed to find the original 5 factor structure and instead propose four-factor, three-factor, and unidimensional models (including the original 25 items or shorter versions). For example, using exploratory factor analysis (EFA), Lamond et al. (2009) reported a four-factor CD-RISC structure in a sample of 1,395 women aged over 60 (mean age = 72.2, SD = 7.2) in San Diego. The alpha for the whole scale was .923, but the alphas for the individual factors were not reported. Also using confirmatory factor analysis (CFA), Singh and Yu (2010) reported a four-factor structure when using the CD-RISC in a sample of 256 Indian undergraduate students (65% male, mean age = 22.75, SD = 1.36). The individual alphas for the factors ranged from .69 to .80, and was .89 for the entire scale. Furthermore, using EFA, Crespo, Fernández-Lansac, and Soberón (2014) reported a four factor structure of CD-RISC in a sample of Spanish caregivers of the elderly (n = 111, 73.9% female, mean age = 62.0, SD = 11.8), but four items (item 3: “Sometimes fate or God can help”, item 9: “Things happen for a reason”, item 18: “I can make unpopular or difficult decisions”, and item 20: “I have to act on a hunch”) were dropped due to non-salient loadings. A number of other authors have also found that EFA does not support the original 5 factor structure of CD-RISC, finding instead a three factor solution. For example, Yu and Zhang (2007) used CFA to fit a three factor model that emerged with EFA in a Chinese sample (n = 560, 50% male, 84% between 20 and 60, 10% under 20 and 6% over 60). These authors called the factors: Tenacity (13 items, alpha = .88), Strength (8 items, alpha = .80), and Optimism (4 items, alpha = .60). The reliability coefficient of the scale was .91. Karairmak (2010) also adjusted a three-factor model, which emerged with EFA, using CFA in a sample of 246 Turkish earthquake survivors (61% female, mean age = 35.8, SD = 8.6), but one item was dropped due to low factor loadings (item 2: “I have close and secure relationships”). The overall reliability coefficient of the scale was .92 but the internal consistence of the third factor was only .49. Similarly, using CFA, Serrano-Parra et al. (2012) fitted a 17-item 3-factor model which emerged from EFA in a sample of Spanish elderly people (n = 168, 65.5% female, mean age = 67.2, SD = 7.6). Items 1, 3, 8, 9, 15, 18, 20, and 25 were dropped due to their low factor loadings. The Cronbach's alpha was acceptable for the first two factors (.79), but was low for the third (.56). More recently, Manzano-García and Ayala-Calvo (2013) also used CFA to verify a three-factor 23-item model, which emerged with EFA, in two subsamples (n1 = 389, n2 = 394) of Spanish entrepreneurs (67.8% male, aged 20-50). The factors were labelled by the authors as Hardiness (9 items, composite reliability = .88), Resourcefulness (7 items, composite reliability = .87) and Optimism (7 items, composite reliability = .81). Items 3 and 9 failed to load higher than .30 on any factor and were therefore dropped. These two items correspond to the original factor 5 (Spiritual Influences). Unidimensional models of the CD-RISC have also been proposed by several authors. For example, Campbell-Sills and Stein (2007) studied a sample of 1,743 undergraduate American students (74.4% female, mean age = 18.8, SD = 2.2) divided into three subsamples (each over 500) to determine the factor structure of the CD-RISC. After some modifications, they reported a 10-item 1-factor model with good psychometric properties (composite reliability = .85). The CD-RISC-10 is comprised of item 1 (“I am able to adapt to change”); item 4 (“I can deal with whatever comes my way”); item 6 (“I see the humourous side of things”); item 7 (“Coping with stress can strengthen me”); item 8 (“I tend to bounce back after a hardship or illness”); item 11 (“I can achieve my goals”), item 14 (“Under pressure, I focus and think clear”); item 16 (“I am not easily discouraged by failure”); item 17 (“I think of myself as a strong person”); and item 19 (“I can handle unpleasant feelings”). This short form has been validated in different cultures and populations. For instance, using EFA, Wang et al. (2010) assessed the psychometric properties of the CD-RISC-10 in a sample of 341 teachers, who were victims of an earthquake (54.2% female, mean age = 39.0, SD = 9.6) and found that the scale had a good internal consistency (alpha = .91). Burns and Anstey (2010) also supported the unidimensional CD-RISC model. These authors studied a sample of 1,775 young Australian adults (45.9% males, range age 20-24) and, using CFA, fitted a unidimensional model (dropping items 2, 3, and 9) for a 22-item scale. They also supported the unidimensional factor structure for the 10-item scale, as proposed by Campbell-Sill and Stein (2007). Gucciardi, Jackson, Coulter, and Mallett (2011) also supported the unidimensional nature of the 10-item scale, but failed to support the 22-item model proposed by Burns and Anstey (2010). These authors studied two subsamples of 321 adults (19% females, mean age = 26.1, SD = 6.8) and 199 adolescents (23% females, mean age 16.9, SD = 1.9), all of whom were engaged in competitive cricket in Australia. Notario-Pacheco et al. (2014, 2011) and Serrano-Parra et al. (2013) also supported the reliability of the Spanish CD-RISC-10, with samples of university students (n = 681, 73.9% female, mean age 20.1, SD = 4.1), patients with fibromyalgia (n = 208, 95.7% female, mean age = 52.4, SD = 8.4), and elderly people (n = 500, 57.2% female, mean age = 67.5, SD = 8.6). In addition, Vaishnavi, Connor, and Davidson (2007) proposed a 2-item version of the CD-RISC (CD-RISC2) in order to assess the clinical modification of resilience. They used items 1 (“I am able to adapt to change”) and item 8 (“I tend to bounce back after a hardship or illness”). Therefore, the present research investigated the factor structure of the 25-item and 10-item versions of the CD-RISC in a large sample of Spanish young adults. Furthermore, we compare the CD-RISC scores by gender. Participants The initial sample consisted of 3,267 students from four faculties at a university in the north-east of Spain. Thirty students present in the classes refused to answer the questionnaire, resulting in a participation rate of 99%. As our aim was to study young adults, only students aged under 36 years old were included in the research, resulting in a final sample of 3,214 students (mean age = 21.01, SD = 2.86, 62.1% female). The distribution of students by faculty was: Nursing (11.8 %), Education and Psychology (44.3%), Medicine (13.3%), and Engineering (30.6 %), which was broadly representative of the university's student population. Materials The Spanish version of the Connor-Davidson Resilience Scale (CD-RISC) (Manzano-García & Ayala-Calvo, 2013) was used to measure resilience. The original English scale consists of 25 items which form five factors (Connor & Davidson, 2003). Respondents are asked to answer on a five-point Likert scale (0 = totally disagree to 4 = totally agree). Design and Procedure A cross-sectional survey was used to collect data. After permission had been obtained from the person in charge of each faculty, the questionnaires were administered to all students present during normal class time in a compulsory subject. Students granted their consent to participate in the research in accordance with the Declaration of Helsinki. Participation was voluntary and students were assured of their anonymity and the confidentiality of their responses. The students answered the Spanish form of the CD-RISC along with the demographic variables. This research complies with the research ethics policy of the institution where the students were enrolled. To fit the CFA models, participants were randomly divided into two equal sized subsamples: A (n = 1,607) and B (n = 1,607). Subsample A was used to explore which models better fitted the data and then these models were fitted in subsample B. Data Analysis Confirmatory factor analysis (CFA) was used to assess the adequacy of the CD-RISC. The maximum likelihood method was used to estimate the model parameters; t-tests were used to compare means between groups and the effect sizes were measured using Cohen's d. AMOS 22 was utilised to conduct the CFA and SPSS 19.0 for all other statistical analyses. Structural Validity of CD-RISC CFA was carried out with a half of the sample (subsample A: n = 1,607) initially to try to fit the original five-factor model (Connor & Davidson, 2003), but the goodness of fit indices were poor (model 1, Table 1). When significant covariance paths between errors terms were included for modification indexes (MI) over 20, the goodness of fit remained poor (model 2, Table 1). Table 1 Models Tested 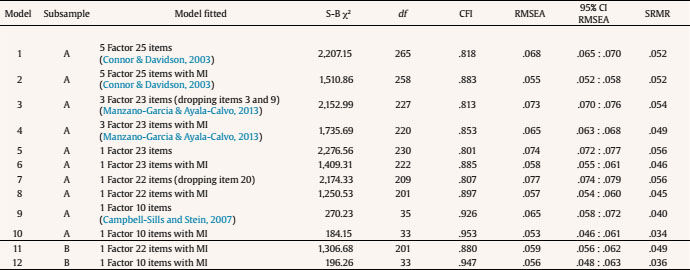 Note. MI = modification indices. Secondly, the 23-item (excluding items 3 “Sometimes fate or God can help” and 9 (“Things happen for a reason”) three-factor solution, proposed by Manzano-García and Ayala-Calvo (2013), was fitted with even worse results (model 3, Table 1). The goodness of fit indices did not improve substantially when covariance paths between the error terms were included for MI over 20 (model 4, Table 1). Following other authors (e.g., Burns & Anstey, 2010) a 22-item unidimensional model (without items 3 and 9) was also tried, but goodness of fit indices were not very good (model 5, Table 1). However, goodness of fit improved when we reran the analysis including the covariance paths between errors terms with MI over 20 (items 4/5, 6/7, 10/11, 14/15, 16/17, 18/19, 20/21, and 24/25) (model 6, Table 1). As item 20 (“I have to act on a hunch”) failed to load over .30 we reran the analysis without this item, but the goodness of fit did not improve substantially (model 7, Table 1). Nevertheless, when significant covariance paths between errors terms were included for MI over 20 (items 1/2, 4/5, 6/7, 10/11, 14/15, 16/17, 18/19, and 24/25) acceptable goodness of fit indices resulted (model 8, Table 1). This model was also attempted using subsample B (n = 1,607), which resulted in similar goodness of fit indices (model 11, Table 1). The short 10-item unidimensional version proposed by Campbell-Sills and Stein (2007) was then tested using sample A. This short version includes items 1, 4, 6, 7, 8, 11, 14, 16, 17, and 19. This found acceptable goodness of fit indices (model 9, Table 1), which improved when significant paths between errors terms were included for MI over 20 (items 6/7, and 16/17) (model 10, Table 1). This model was also tried using subsample B, which produced similar goodness of fit indices (model 12, Table 1). Table 2 shows the factor loadings, along with the composite reliability coefficients (CR) for the two models fitted. All factor loadings were over .30 and the CR coefficients were acceptable. Table 2 Factor Loadings and Composite Reliability Coefficients of the Fitted Models 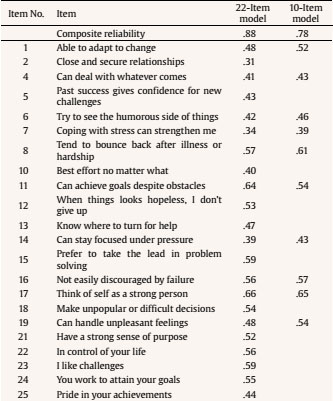 CD-RISC by Gender Table 3 shows means, standard deviations in the whole sample and by gender, as well as the results of the t-test and the Cohen's d effect size. The resilience scores of the young adult males were higher in 15 of the 22 items, many of them related to challenge and overcoming adversity (item 4: “I can deal with whatever comes my way”; item 5: “Past success gives confidence for new challenges”; item 12: “When things look hopeless, I don't give up”; item 23: “I like challenges”; item 16: “I'm not easily discouraged by failure”; item 19: “I can handle unpleasant feelings”; item 14: “Under preasure, I focus and think clearly”, among others). However, females scored higher than men in items related to personal effort (item 10: “I give my best effort no matter what”), relationships (item 2: “I have close and secure relationships”; item 13: “I know where to turn to for help”), and for item 25 “I take pride in my achivements”. Nevertheless, effect sizes ranged from very small (.06) to moderate (.37). There were only three items with means that did not differ significantly between males and females (Item 11: “I can achieve my goals”; Item 21: “I have a strong sense of purpose” and Item 24: “I work to attain my goals”). Men's total score were significantly higher than women's, on both the 22-item scale and the 10-item version. Nevertheless, the effect sizes were very small (under .20) or in the small to medium range (.20 to .50). Table 3 CD-RISC Items by Gender 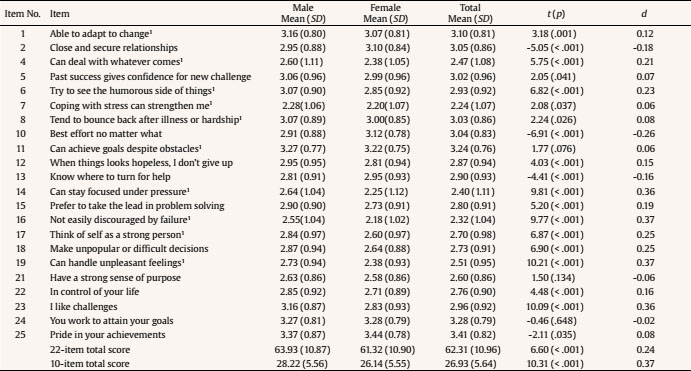 Note. 110-item short version. The aim of this paper was to investigate the factor structure of the CD-RISC in a large sample of Spanish undergraduate students. Confirmatory factor analysis failed to support the adequacy of the original five factor CD-RISC (Connor & Davidson, 2003) among Spanish undergraduate students. These findings are generally in agreement with previous research (Campbell-Sills & Stein, 2007; Crespo et al., 2014; Karairmak, 2010; Lamond et al., 2009; Manzano-García & Ayala-Calvo, 2013; Serrano-Parra et al. , 2012; Singh & Yu., 2010; Yu & Zhang, 2007). Furthermore, CFA did not support the three factor model proposed by Manzano-García and Ayala-Calvo (2013) among Spanish entrepreneurs. The present research found one dimension solutions for both the revised 22-item scale and the 10-item scale proposed by Campbell-Sills and Stein (2007). The 22-item scale fitted after items 3 (“Sometimes fate or God can help”) , 9 (“Things happen for a reason”) and 20 (“I have to act on a hunch”) were dropped from the original scale. In support of this action, Connor and Davidson (2003) reported a low item-total scale correlation with these three items. In addition, many authors have found that items 3 and 9 failed to load over .30, either on unidimensional models (Burns & Anstey, 2010) or three/four factor models (Crespo et al., 2014; Manzano-García & Ayala Calvo, 2013). In the original scale, these two items correspond to factor 5 and were related to spiritual influences (Connor & Davidson, 2003). Regarding item 20, authors such as Crespo et al. (2014) also found factor loadings lower than .35 when studying in a sample of non-professional Spanish elderly caregivers of dependent relatives. This item was included in factor 2 (trust in one's instincts, tolerance to negative affect, and strengthening effects of stress) by Connor and Davidson (2003). The present results also support the 10-item unidimensional CD-RISC proposed by Campbell-Sills and Stein (2007). This short version has also been validated across specific populations such as adult and adolescent Australian cricketers (Gucciardi et al., 2011), elderly Spanish participants (aged 60-75) (Serrano-Parra et al., 2013), Spanish patients with fibromyalgia (Notario-Pacheco, 2014), and the youngest adult cohort (aged 20-24) from the PATH study in Canberra (Burns & Anstey, 2010). Another aim of this research was to compare the CD-RISC scores by gender. Men's total score was significantly higher than women's in both the 22-item and the 10-item scale, which is in agreement with previous research. For example, using the original 25-item scale among Chinese secondary school students (N = 2,914, range age 13-17), Yu et al. (2011) found males scored significantly higher than females. This pattern has also been found using the 10-item CD-RISC. Using the 10-item version Campbell-Sills, Forde, and Stein (2009) found significantly higher scores in men than in women (N = 764, range age 18-75). According to these authors the gender difference might be due to a bias in responding, as men are more concerned (than women) to provide an image of strength in coping with stress. Another possible explanation is that previous research has found resilience has a negative relationship with different personality constructs, such as neuroticism, which are higher among females (Campbell-Sills, Cohan, & Stein, 2006; Schmitt, Realo, Voracek, & Allik, 2008; Sing & Yu, 2010). Nevertheless, as other authors have not found significant differences by gender (N = 246 Turkey's earthquate survivors, range age 18-58), and the effect size found here were in the small to medium range, according to Cohen's criteria (Cohen, 1988), further research is needed to clarify these results. The study reported here clearly has a number of methodological limitations, such as the possibility of sampling bias. Since all participants were undergraduate students in a city in the north-east of Spain, it is possible that they differ significantly in some way from the general population of young Spanish people. Furthermore, the use of self-reported questionnaires might result in social desirability bias. However, as anonymity and confidentiality were guaranteed, we expect social desirability bias to be relatively low. Confirmatory factor analysis failed to support the original 5-factor solution (Connor & Davidson, 2003) using the 25-item CD-RISC, supporting instead a unidimensional factor structure for both the 10-item and 22-item CD-RISCs. Although both instruments are adequate, the shorter 10-item CD-RISC is a particularly useful tool as it reduces the time needed to answer the questionnaire, allows it to be combined with other instruments, and does not require very large sample sizes. Cite this article as: Gras, M. E., Font-Mayolas, S., Baltasar, A., Patiño, J., Sullman, M. J. M., & Planes, M. (2019). The Connor-Davidson Resilience Scale (CD-RISC) amongst young Spanish adults. Clínica y Salud, 30, 73-79. https://www.doi.org/10.5093/clysa2019a11 References |
Cite this article as: Gras, M. , Font-Mayolas, S. , Baltasar, A. , Patiño, J. , Sullman, M. J. M. , & Planes, M. (2019). The Connor-Davidson Resilience Scale (CD-RISC) amongst Young Spanish Adults. ClĂnica y Salud, 30, 73 - 79. https://doi.org/10.5093/clysa2019a11
Correspondence: eugenia.gras@udg.edu (M. E. Gras).Copyright © 2026. Colegio Oficial de la Psicología de Madrid


 PDF
PDF e-PUB
e-PUB CrossRef
 JATS
JATS Print
Print Send
SendEMAIL ALERT
Clinical and Health is licensed under a Creative Commons Attribution-NonCommercial-NoDerivatives 4.0 International License