


A Test of Combi-Lineups: A Lineup Procedure for Multiple Perpetrator Cases in the Netherlands
[Puesta a prueba de ruedas de reconocimiento combinadas: un procedimiento de ruedas de reconocimiento para los casos de mĂşltiples sospechosos en los PaĂses Bajos]
Melanie Sauerland1, Micol Iannuzzi1, Nina Tupper1, Adri G. van Amelsvoort2, & Colin G. Tredoux3
1Maastricht University, Maastricht, The Netherlands; 2National Facial Biometrics Working Group, The Netherlands; 3University of Cape Town, Cape Town, South Africa
https://doi.org/10.5093/ejpalc2026a2
Received 12 September 2025, Accepted 7 January 2026
Abstract
Background: International best-practice guidelines for lineup administration typically address single perpetrator crimes; few guidelines exist for cases involving multiple perpetrators. In the Netherlands, lineups testing the possible presence of several perpetrators are administered in a single intermixed sequence. This combi-lineup has the advantage that the witness does not know how many people are in the lineup and that it is cognitively less demanding for witnesses. It may also enhance memory performance through cueing effects. Method: In a laboratory (N = 158) and an online experiment (N = 213), we compared identification performance and the confidence-accuracy relationship for combi-lineups versus separate standard lineups. Participants viewed a mock-theft video depicting two thieves, and completed lineup tests for both. They either made identification decisions from a 12-person combi-lineup or from two separate 6-person lineups. Results: Discriminability, confidence-accuracy characteristic curves, and Bayesian information gain curves as a function of target presence base rates were very similar across both procedures. Conclusion: These findings provide evidence that the combi-lineup leads to results very similar to those obtained with multiple, separate standard lineups.
Resumen
Antecedentes: Las directrices internacionales de buenas prácticas relativas a las ruedas de reconocimiento normalmente se centran en los delitos con un único sospechoso. Hay pocas normas referidas a múltiples sospechosos. En los Países Bajos, las ruedas de reconocimiento con varios sospechosos se administran en una única rueda con todos ellos. Esta rueda combinada tiene las ventajas de que el testigo no sabe cuántos sospechosos están presentes en la rueda y de que es menos exigente cognitivamente para los testigos. También puede mejorar el rendimiento de la memoria gracias a los efectos de las señales. Método: En un experimento de laboratorio (N = 158) y en un experimento online (N = 213) comparamos el desempeño en la identificación en ruedas combinadas en comparación con ruedas de un único sospechoso. Los participantes vieron el vídeo de un robo simulado con dos autores y y se les solicitó la identificación de ambos, bien en una rueda combinada de 12 miembros con los dos sospechosos, bien en 2 ruedas distintas de 6 miembros con un sospechoso cada una. Resultados: Los resultados mostraron que la capacidad de discriminación, las curvas características de confianza-exactitud y las curvas bayesianas de ganancia de información como función de las tasas base de presencia del estímulo objetivo (sospechosos) eran muy parecidas en ambos tipos de ruedas. Conclusiones: Los resultados demuestran que las ruedas combinadas tienen resultados muy parecidos a los obtenidos con ruedas separadas para cada sospechoso.
Keywords
Multiple perpetrator crimes, Confidence-accuracy relationship, Lineup administration, Lineup guidelinesPalabras clave
Delitos con múltiples autores, Relación entre confianza y exactitud, Práctica de las ruedas de reconocimiento, Directrices sobre ruedas de reconocimientoCite this article as: Sauerland, M., Iannuzzi, M., Tupper, N., van Amelsvoort, A. G., & Tredoux, C. G. (2026). A Test of Combi-Lineups: A Lineup Procedure for Multiple Perpetrator Cases in the Netherlands. The European Journal of Psychology Applied to Legal Context, 18, Article e260177. https://doi.org/10.5093/ejpalc2026a2
Correspondence: melanie.sauerland@maastrichtuniversity.nl (M. Sauerland).Many crimes are committed by more than one perpetrator at a time. While international best practice guidelines for lineups specify the procedure for lineup construction and administration (e.g., Wells et al., 2020), those guidelines are usually silent about lineup procedures in cases with multiple perpetrators. Dutch lineup guidelines do address multiple perpetrator cases, though, and recommend a mixed-lineup procedure (van Amelsvoort, 2023). During this so-called combi-lineup, multiple suspects and foils are presented in one intermixed sequence. Although Dutch police have used combi-lineups since 1999 (van Amelsvoort, 1999), implications for eyewitness performance have not been tested empirically. In this study, we compared lineup performance across combi-lineups with two perpetrators and two separate lineups, in two experiments. We also assessed the confidence-accuracy relationship in each type of lineup. Surveys of police investigators and lineup administrators across Europe suggest that between 10 and 47% of crimes are committed by more than one perpetrator (Hobson et al., 2012; Tupper et al., 2019). When asked to indicate their practices when faced with a two-perpetrator crime, a third of Dutch, Belgian, and Swedish lineup administrators (N = 51) indicated that they would place two suspects into the same lineup (Tupper et al., 2019). The situation in the UK is different: in line with the Police and Criminal Evidence Act (PACE, 1984), 100% of police officers in a UK survey (N = 29) reported administering separate lineups in cases of multiple suspects (Hobson et al., 2012). Yet, many officers reported adapting the standard instructions to clarify that each lineup contained only one suspect and that the different lineups tested identification of different perpetrators. In a South-African survey (N = 75), many police officers (66%) reported placing multiple suspects together in a single lineup (Nortje et al., 2020). This is in line with the South-African guideline that additional suspects can be added to the parade so long as the suspects are physically similar and more foils are added to the parade, per suspect (Du Toit et al., 1987). These findings illustrate that lineups are in some places already conducted with more than one suspect, even though guidelines based on empirical evidence are missing. Lineup procedures for multiple perpetrator crimes are also relevant from a memory perspective. Increasing the number of faces during encoding reduces recognition performance (Megreya & Burton, 2006). In eyewitness identification research, witnessing a crime with multiple perpetrators, compared to one perpetrator, affects identification performance for target-present lineups (Clifford & Hollin, 1981; Lockamyeir et al., 2021; Megreya & Bindemann, 2012; Nortje 2018; Yarmey, 1982). Such negative effects can be attributed to divided attention and increased perceptual load during encoding (Bindemann et al., 2005; Megreya & Bindemann, 2012; Murphy & Greene, 2016). However, there seems to be no effect of multiple perpetrators on lineup rejections (or false alarms) in target-absent conditions (Lockamyeir et al., 2021; Megreya & Bindemann, 2012; Nortje 2018). This could suggest that people who witnessed a multiple perpetrator crime adopt a stricter criterion, increasing the likelihood of a rejection (Nortje, 2018). The negative effect of the presence of multiple perpetrators at a crime scene on hit rates raises the question of whether certain lineup procedures might support lineup performance of people who witnessed a multiple perpetrator crime. Multiple suspects, if more than one is a perpetrator, may provide cues for each other during lineup administration, and this could assist memory retrieval in a lineup procedure. This is because associative information and binding independent pieces of information is intrinsic to memory functioning (Aue et al., 2012). Recognition rates for a previously studied face are often higher when the face is shown with a previously associated face as a cue, compared to being presented alone or with a different face (Tupper, Sauer et al., 2018, Experiment 2; Watkins et al., 1976; Winograd et al., 1977). For lineups, cueing has been tested in studies by presenting two perpetrator lineups side-by-side (Wells & Pozzulo, 2006), by presenting a photo of an accomplice next to the lineup containing the suspect (Dempsey, 2012), or by presenting separate lineups after another, twice, before allowing lineup decisions (Hobson & Wilcock, 2011). The success of these attempts was mixed, with an advantage of the cued procedure for target-present but not target-absent lineups in two studies (Dempsey, 2012; Hobson & Wilcock, 2011) or non-significant effects in another (Wells & Pozzulo, 2006). Relevant limitations of cuing effects include that they rely on a strong association between the two stimuli (cf. Tupper, Sauer et al., 2018) and that they might unfold only when memory for the perpetrator is relatively weak (Smith & Vela, 2001). In summary, witnesses of multiple perpetrator crimes may benefit from retrieval support during recognition under certain conditions. Lineup Construction and Administration in the Netherlands The Dutch handbook for identification procedures (van Amelsvoort, 2023; Handbook henceforth) details protocols for the construction and administration of lineups in the Netherlands since 1994. For example, according to the Handbook, lineups can include between five and eleven fillers; witnesses may view the lineup simultaneously or sequentially; and lineups can be administered live, or using photos or videos. In practice, sequential photo lineups come into use most frequently, whereas live lineups are rare due to the high costs (for more details on Dutch lineup construction and administration, see Sauerland et al., 2023). For multiple perpetrator lineups, the Handbook (van Amelsvoort, 2023) proposes a sequential or a simultaneous lineup procedure. Here, we focus on the sequential procedure: witnesses see lineup members referring to several perpetrators intermixed in one large combi-lineup. The rationale for this adapted sequential procedure is that the witness should not know the size of the lineup. If witnesses did know, there would be a risk that the witness would use an increasingly lenient decision criterion when approaching the last lineup members. In case of multiple perpetrator crimes, the first of several sequential lineups would reveal the (approximate) number of lineup members in subsequent lineups, increasing the pressure to identify someone as the witness progresses from one lineup to the next (Horry et al., 2012; Lindsay et al., 1991). Additionally, going through multiple separate lineups can put strain on witnesses’ cognitive and mental resources, and this can be reduced by using a single, combined procedure. The Confidence-Accuracy Relationship as a Function of Lineup Procedure Apart from adjusting lineup procedures or adding control variables, diagnosticity of lineup decisions can be improved by considering confidence judgments. In recent years, consensus has emerged that post-decision confidence and identification accuracy are strongly related for positive identification decisions (Sauerland & Sporer, 2009; Sporer et al., 1995; Weber & Brewer, 2006; Wixted et al., 2016) – under pristine conditions (Wixted & Wells, 2017) and when the confidence judgment was collected immediately following the identification decision (Douglass & Steblay, 2006). For the Dutch combi-lineup, the question arises whether the specific conditions of this procedure affect the confidence-accuracy relationship. These conditions include witnessing a crime with multiple perpetrators rather than one perpetrator and viewing a somewhat larger rather than a smaller lineup1. As we have seen, witnessing a multiple perpetrator crime leads to poorer identification performance. Yet, witnesses may be able to account for such performance decreases when making their confidence judgment (Palmer et al., 2013; Semmler et al., 2018). One experiment comparing the confidence-accuracy relationship for a single vs. multiple-perpetrator crime supports this idea (Lockamyeir et al., 2021): despite a detrimental effect of multiple perpetrators on identification accuracy, confidence was still reliably associated with accuracy and, importantly, high confidence, on average, indicated high accuracy. 2 Another line of reasoning could be that large lineups might suppress performance and reduce the strength of the confidence-accuracy relationship. To our knowledge, no work to date has tested the effect of lineup size for multiple perpetrator-crimes. For single perpetrator-crimes, effects of lineup size on diagnosticity or the confidence-accuracy relationship are mixed. Some work has not found differences in discriminability between smaller and larger lineups with ROC curves (Akan et al., 2021, Experiment 1 and 2; Seale-Carlisle et al., 2019; Wooten et al., 2020). Others have found an advantage of 6-person over 2-person lineups under low filler-similarity conditions (Lam & Wixted, 2024, Experiment 1; Shen et al., 2024, Experiment 2). Experiments that reported calibration analyses or confidence-accuracy characteristic curves found no differences as a function of lineup size (Akan et al., 2021) or a small advantage for larger over smaller lineups (Seale-Carlisle et al., 2019; Wooten et al., 2020). Overall, these findings suggest that larger lineup size does not affect lineup performance or the confidence-accuracy relationship. Here, we put the confidence-accuracy relationship for combi- and standard lineups to another test. The Present Study In a laboratory experiment (Experiment 1) and an online replication of that experiment (Experiment 2), we assessed identification performance and the confidence-accuracy relationship for a two-perpetrator crime, either with two separate, standard lineups or the Dutch combi-lineup procedure. Participants witnessed a simulated theft perpetrated by two thieves. Half of the participants made two separate lineup decisions from sequential lineups containing one suspect each. The other half of the participants made a decision in a task containing a combi-lineup that presented the suspects and foils from thief lineups in an intermixed order. Based on the idea that in a combi-lineup, one target can provide cues regarding the identity of the other target (Tulving & Thompson, 1973; Tupper, Sauer et al., 2018), we expected better identification performance in the combi-lineup condition than the standard lineup condition. We did not expect differences in the confidence-accuracy relationship between the two procedures. The experiment received ethical approval by the Ethics Review Committee of the faculty (approval code OZL_231_140_12_2020_S4). The data are available here: https://doi.org/10.17605/OSF.IO/23EUN. We cannot share the lineup images because we do not have permission from the individuals. Participants The data collection procedures were in accordance with the Declaration of Helsinki. Power analyses for Generalized Estimating Equations (GEE) rely on estimates of parameters that are not obvious. To inform the required sample sizes, we therefore relied on power analyses for two separate 2 (identification accuracy: accurate vs. inaccurate) x 2 (lineup procedure: combi-lineup vs. standard) chi-squared tests for target-present and target-absent lineups. For a chi-squared test with a moderate effect size phi = .30, p = .05, and power = .80, G*Power (Faul et al., 2007) returns a sample size of n = 88. For two separate chi-squared tests for target-present and target-absent lineups, this means a sample of 2 x 88 = 176 is required. We started data collection for Experiment 1 in the fall of 2019. Due to the COVID-19 pandemic, data collection was halted in the spring of 2020. We then collected as many participants as possible by the end of the academic year 2020/21. In total, N = 178 people participated in Experiment 1. We excluded 9 participants because they differed in ethnicity from the targets in the stimulus film, so as to reduce other-group bias (Meissner & Brigham, 2001). We further excluded five participants because they previously knew a lineup member, three participants due to technical errors, two participants because their confidence was not recorded through error, and one participant because their phone rang during the lineup administration. The final Experiment 1 sample consisted of N = 158 participants, (23 men, 135 women; Mage = 20.63 years; age range = 17-32 years; SD = 2.7; Mdn = 20). Participants were students (75.9%), had completed higher vocational education (20.3%), university education (7.5%), medium vocational education (0.6%), or provided no answer (3.2%). Participants received either 0.5 participation credits or a 5€ gift voucher. In Experiment 2, N = 265 people participated. We excluded 22 participants because they differed in origin from the targets in the stimulus film to reduce other-group bias (Meissner & Brigham, 2001). We further excluded 20 participants because they answered both attention check questions incorrectly, four participants because their identification decisions were not recorded, three participants because they previously knew a lineup member, two participants due to technical error during the administration of the experiment, and one participant because they indicated they were distracted in a follow-up question. The final Experiment 2 sample consisted of N = 213 participants, (78 men, 133 women, 2 non-binary). Participants indicated their age as under 18, 18-24, 25-34, …, 75-84 years. Participants’ age ranged from under 18 to 75-84 years, with most participants belonging to the group of 18-24-year-olds. Most participants were students (69.0%). We recruited participants through the participation platform of the faculty, word of mouth, social media (Facebook and Instagram), and SurveyCircle. Student participants received course credit in return for participation; other participants did not receive reimbursement. Design We used a 2 (lineup procedure: combi-lineup vs. standard) x 2 (target presence: present vs. absent) between-subject design in both experiments. Participants were randomly assigned to the conditions. In the standard lineup condition, participants made two separate lineup decisions from two sequential lineups. In the combi-lineup condition, participants received one combined sequential lineup that contained the suspects and foils from both lineups in the standard lineup condition in an intermixed order. All combinations of target presence were possible for the two thieves: both target-absent, one of the two target-absent and one target-present, or both target-present. We created three versions of target-absent and target-present lineups to counterbalance the position of the innocent suspect(s) and perpetrator(s). We also counterbalanced the order of the two thief lineups in the standard lineup condition. We considered identification decisions as accurate (hits, correct rejections) or inaccurate (filler or replacement selections, false rejections). We also measured participants’ post-decision confidence on a scale from 0 to 100 for both lineup decisions. Materials Stimulus Film Participants viewed a 1:37 min stimulus film that depicted a nonviolent multi-perpetrator mock-theft. In the film, a man, the victim, is unloading his car. In the background, two thieves (a man and a woman) gesture towards the victim. Once the victim carries a box inside his home nearby, the male thief follows and distracts him by asking for directions when the victim attempts to walk back to his car. At the same time, the female thief steals various objects from the victim’s car and walks away. The two thieves were white, and 25 and 27 years old, respectively. The female thief appeared for 60 seconds on screen with 18 seconds of close-up view shots of her face and the male accomplice appeared for 58 seconds with 28 seconds of close-up shots of his face. Lineups Lineups Construction. We constructed the lineups in line with Dutch police protocol (van Amelsvoort, 2018). For each target, we created a person description that included information about age, body shape, hair color, and hair length. Following Dutch police procedure, we presented each target and a selection of possible fillers to four mock-witnesses (two men, two women) who were similar in age and origin to our target population (i.e., students). They were informed that a theft had occurred and received a general perpetrator description prepared by women (for female test observers) or men (for male test observers), respectively (e.g., She is between 22 and 27 years old, has long, blond hair and a normal figure). It was their task to point out anyone who stood out (if anyone), for whatever reason. Test observers pointed out several fillers who were subsequently dropped or replaced. The final selection of six fillers (one serving as replacement for target-absent conditions) was established following four rounds with test observers. We established the effective lineup size by means of the mock-witness paradigm (Doob & Kirshenbaum, 1973). Independent samples of mock-witnesses (ns between 30 and 38) who had not seen the stimulus event, read a target description similar to the descriptions used for the Dutch police protocol described above and viewed a standard lineup. Mock-witnesses then selected the person from the lineup who matched the description best. E (i.e., the effective lineup size) ranged from E = 3.6 to 4.7 (of a possible 6), thereby marking them as a fair selection (Tredoux, 1998, 1999). Lineup Composition. The standard lineups included one suspect (innocent or guilty) and five fillers. The combi-lineup included two suspects (innocent or guilty) and ten fillers. Lineup photographs showed each lineup member from the shoulders up in front of a white background; including one portrait photo and a 45° angle profile picture for each lineup member. The two photos of each lineup member were presented simultaneously; the lineup members were presented sequentially. Lineup Administration Experiment 1. We administered the lineups in line with Dutch police protocol (van Amelsvoort, 2018). Prior to viewing the lineups, participants were informed that they a) would see a sequential lineup, b) would see the selection once, and c) should immediately indicate if they saw the person who committed the theft. A leaflet emphasized that 1) the lineup administrator did not know the lineup members nor who was suspected of the theft and that the fillers were innocent citizens, 2) it was difficult to recognize a person from a photograph, 3) if in doubt, they should not identify anyone, and 4) it was possible that the person(s) who committed the theft was (were) not present in the selection. We presented the lineups sequentially, using PowerPoint. Following Dutch procedure, each lineup member appeared on screen for 4 seconds followed by 3 seconds of a black screen. Lineup members were numbered 1-6. Lineups could only be viewed once and could be paused on the black screen. Participants first viewed two test photographs with the same timing as the actual lineup photographs. Just before participants saw the actual lineup, they were reminded that it was possible that the person(s) wanted was (were) not part of the selection and that they should not point out anyone if they were in doubt. These instructions were simultaneously given both orally and in writing, as part of the PowerPoint presentation (Kerstholt et al., 1998). The lineup administrator documented the number of the selected photograph if participants identified a lineup member. In line with Dutch procedure, the lineup then continued to the last lineup member. Following an identification, lineup administrators asked the participant how confident they were in the decision they had just made on a scale from 0 to 100%. If the participant did not make an identification, administrators asked participants how confident they were that the target was not present in the lineup at the end of the lineup. Blinding Administrators. Blinding of administrators was accomplished in two ways. The lineup was presented on two screens – one for the participant and one for the lineup administrator. The administrator’s screen was covered during lineup presentation such that only the number of the presented lineup member was visible. Additionally, and to avoid lineup administrators learning the likely position of the target over time, suspect positions varied between three different positions for each target. Lineups were created by the supervisor of the experiment, who was the only person aware of the suspect positions and counterbalancing scheme and who provided the lineup as a blinded file. Experiment 2. We mirrored the procedures for Dutch police protocol as much as possible in the online testing setting. Prior to the lineup presentation, participants were informed that they would view lineup(s) of possible suspects and that they should fetch something for notetaking, so they could write down the photograph numbers of anyone they might recognize from the theft. Analogous to Experiment 1, participants then viewed two test photographs and were asked to adjust their screen or seating position so that they could see the photographs clearly. Next, participants learnt that they would see sequential lineup(s) and should take note of the referring lineup member number(s) if they saw the person(s) who committed the theft. Before the lineup presentation commenced, participants were warned that the person(s) wanted may not be present and that they should not select anyone if they had doubts. As in Experiment 1, these instructions were simultaneously given both orally and in writing (Kerstholt et al., 1998). Unlike Experiment 1, participants then viewed all lineup members sequentially before indicating any recognition. As in Experiment 1, each lineup member appeared on screen for 4 seconds followed by 3 seconds of a black screen. Lineup members were numbered 1-6 (standard lineups) or 1-12 (combi-lineup), respectively. After participants had viewed all lineup members, they could indicate the lineup member (standard lineup) or members (combi-lineup) they had recognized or indicate that the perpetrator(s) were not present in the lineup. Participants indicated their confidence on a scale from 0-100% following each lineup decision. In the standard lineup condition, participants repeated this procedure twice, once for each lineup. Procedure Experiment 1 Participants who took part in Experiment 1 had already participated in a different experiment in the same session. There was a brief break between the two studies. In the first study (not reported here), participants viewed a short crime video and then made identification decisions for a thief and a victim. This study investigated an unrelated research question, namely the post-decision confidence-accuracy relationship for Dutch lineup protocols and is published elsewhere (Sauerland et al., 2023). Here, we report the results of the second study. Participants learned about the experiment through the University’s participant recruitment platform (SONA), online advertisements, and flyers at various university faculties. The experiment was advertised as a study where participants would find out what it was like to be a police witness. The advertisement did not mention eyewitness identification specifically. Participants were tested individually and the identification procedure was video recorded. After signing the written informed consent form, participants viewed the stimulus film. During a 10-minute retention interval, they provided demographic information and completed several unrelated filler tasks on the computer. Next, they viewed the lineup(s). After each lineup decision, participants indicated their confidence and what role that person had played in the crime. Finally, participants were asked what they had thought the purpose of the experiment was prior to participating. Participants furthermore indicated whether they knew any of the lineup members. Before leaving, participants were asked not to talk about the details of the experiment to avoid bias in future participants. Participants then received the debriefing and reimbursement. Experiment 2 Participants received a Qualtrics link to complete the experiment online. After providing informed consent, participants were instructed to pay attention to the video they were about to watch, because they would be asked questions about it later. To check if participants had watched the whole video, a still image of a blue star appeared at the end of the video. Participants received the cue to “Pay attention to this blue star” because they would be asked about it later. During a 10-minute retention interval, participants played a few short games (Pacman, Mario Kart, Flappy Bird, visual search tests). Before viewing the lineups, participants answered two attention check questions about the shape and the color of the blue star at the end of the stimulus film. Most participants answered both (n = 241) or one (n = 4) of the two questions correctly. We excluded participants who answered both questions incorrectly (n = 20). Then, participants viewed the lineup(s). After each lineup decision, participants indicated what role that person had played in the crime. Finally, participants provided demographic information and indicated what they had thought the purpose of the experiment was prior to participating and whether they personally knew any of the persons in the lineup(s). The final question was about the environment while completing the experiment (e.g., alone, surrounded by others). Participants then received the debriefing. Data Analyses Effect of Lineup Procedure on Lineup Performance We used GEE to assess the effect of lineup procedure and target presence on lineup performance. GEE allows the specification of a regression model with dichotomous outcome measures and any combination of within- and between-subjects factors as predictors, with the specification of a so-called working correlation matrix (i.e., unstructured) as a nuisance parameter to accommodate the correlated residuals that result from repeated measurements (Hanley et al., 2003). To ensure the generalizability to a broader population and to avoid overfitting of the data, the minimum number of observations per possible outcome (identification accuracy: accurate vs. inaccurate) should be at least 10 times the number of predictors (Peduzzi et al., 1996). Our models included three predictors (two main effects and one interaction term). That means, we needed at least 30 accurate and 30 inaccurate responses per model. All of our GEE models met this condition. The initial analyses included both main effects (lineup procedure, target presence) and the resulting two-way interaction in the equation. The interaction was non-significant for both experiments, pE1 = .991, pE2 = .0553. We therefore excluded the interaction from the model to assess the two main effects. The exponent of the b value is equal to the partial odds ratio. For binary predictors, this can be interpreted as effect size. To test the effect of cueing on identification performance, we computed another GEE with effects of target presence and cueing (correct cue vs. incorrect cue) on identification performance. We coded the cue for the female thief as correct if the male thief was present in the lineup. Likewise, we coded the cue for the male thief as correct if the female thief was present. The initial analyses included both main effects (cueing, target presence) and the resulting two-way interaction in the equation. The interaction was non-significant for both experiments, pE1 = .304, pE2 = .642. We therefore excluded the interaction from the model to assess the two main effects. We also constructed the ROC curves for standard and combi-lineups and computed the area under the curve (Gronlund et al., 2014; Mickes et al., 2012; Wixted & Mickes, 2018; Wixted et al., 2017). A ROC curve is constructed by plotting the rate of correct identifications against the rate of false identifications for separate levels of confidence (rated by participants on a scale from 0 to 100, transformed to an 11-point Likert scale). ROC curves require large sample sizes to yield reliable estimates. We therefore collapsed data across both experiments. We deemed this approach justified, given similar patterns of results in identification performance and confidence-accuracy characteristic (CAC) curves. Effect of Lineup Procedure on Confidence-Accuracy Relationship We used two techniques for mapping accuracy of participants who made a selection from the lineup (i.e., choosers) across varying levels of confidence: CAC curves and Bayesian information gain curves as a function of target presence base rates. These methods require large sample sizes to yield reliable estimates. Following other work (Dodson & Dobolyi, 2016; Sauer et al., 2010; Sauerland et al., 2025; Tupper et al., 2023), we therefore collapsed data for both targets in these analyses. Confidence-Accuracy Characteristic Curves. We constructed separate CAC curves for standard and combi-lineups. Innocent suspect selections in target-absent lineups were computed as number of filler selections divided by number of lineup members (Lockamyeir et al., 2021; Palmer et al., 2013; Sauerland et al., 2013). To allow for the construction of stable curves and following earlier work (Flowe et al., 2017; Sauerland et al., 2016; Wixted et al., 2015), we collapsed confidence categories into low, medium, and high confidence ([0, 54%], [55, 84%], [85, 100%]). Confidence-Accuracy Relationship as a Function of Target Presence Base Rates. To provide insights into the confidence-accuracy relationship for standard vs. combi-lineups as a function of different prior base rates of target presence, we conducted Bayesian information gain analyses (Wells et al., 2015; Wixted & Wells, 2017). Eyewitness identification research often presents 50% of participants with target-present lineups and 50% with target-absent lineups (i.e., a base rate of target presence of 50%). For different legislations and police stations, however, the base rate probability of perpetrator presence is unknown and variable. We constructed Bayesian information gain curves for standard and combi-lineups separately for high and lower levels of confidence ([85, 100%], [0, 84%]). Effect of Lineup Procedure on Lineup Performance Table 1 shows an overview of hits, filler selections, and false and correct rejections for the different lineup conditions and Table 2 shows the corresponding identification accuracy rates. In Experiment 1, identification accuracy for standard lineups was 84.5% [78.4, 89.9] and for combi-lineups it was 83.9% [78.0, 89.3]. For target-present lineups, correct performance in both lineup conditions was very similar (standard: 75.3% [66.2, 83.8], combi: 74.4% [65.2, 83.2]). Likewise, for target-absent lineups, correct performance in the two lineup conditions was very similar (standard: 94.4% [88.3, 98.7], combi: 93.9% [88.2, 98.8]). Table 1 Frequency (and Proportion, in parenthesis) of Decision Outcomes as a Function of Lineup Procedure and Target Presence (Experiment 1 and 2) 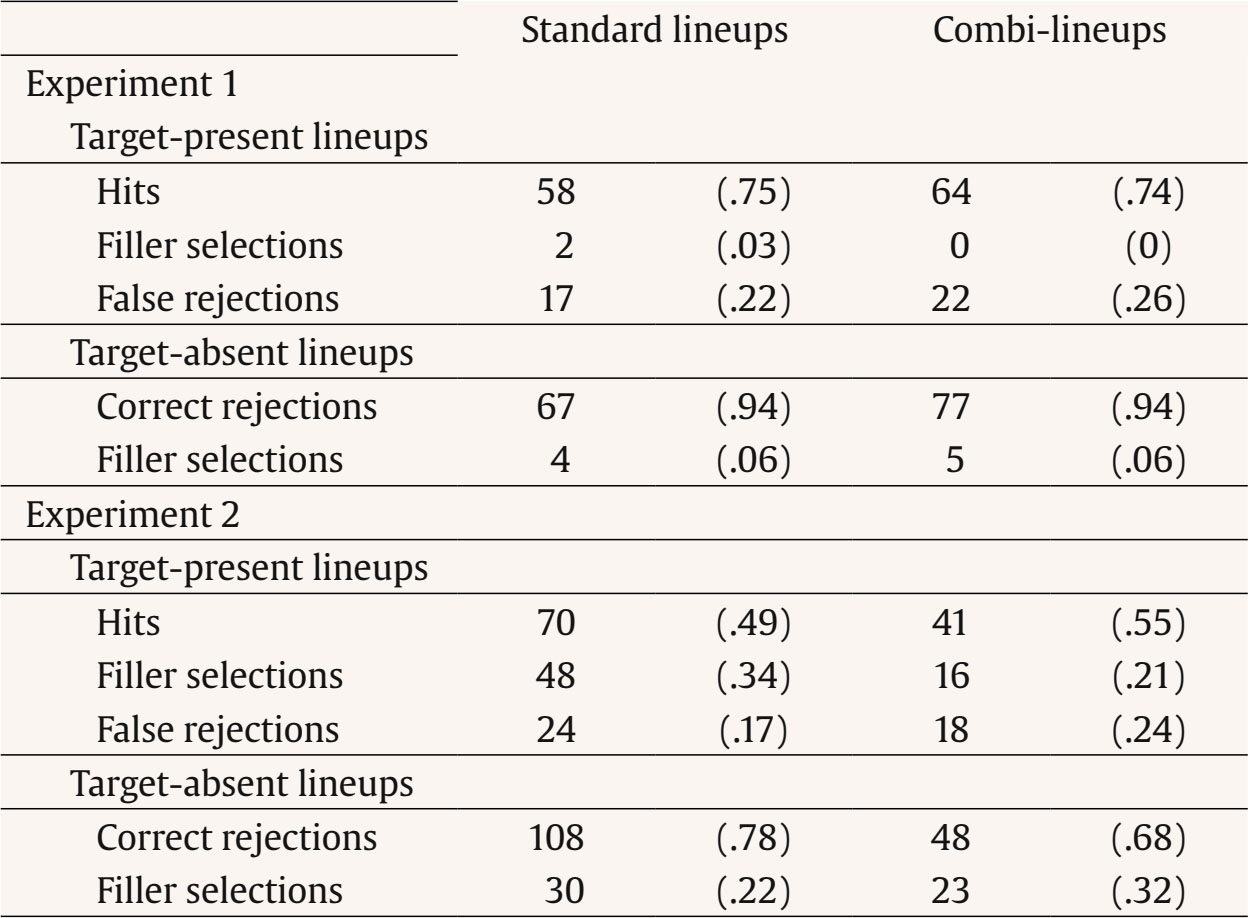 Table 2 Proportion (and Frequency, in parenthesis) of Correct Lineup Identification Decisions as a Function of Lineup Procedure and Target Presence for Experiment 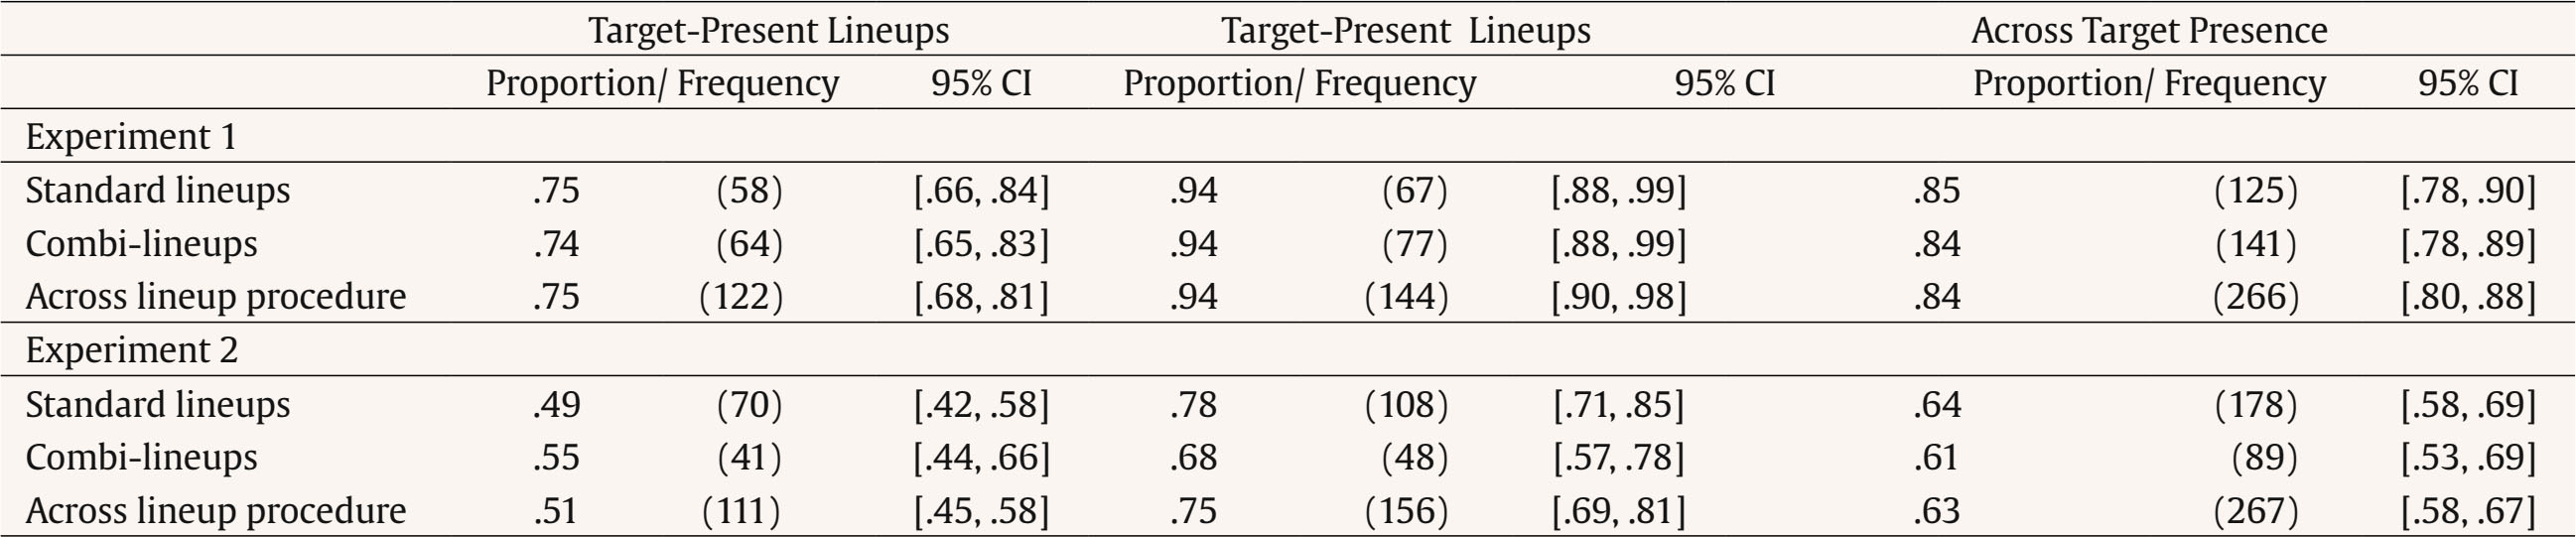 In Experiment 2, identification accuracy for standard lineups was 63.6% [57.5, 68.6] and for combi-lineups it was 61.0% [53.4, 69.2]. For target-present lineups, correct performance was 49.3% [41.7, 57.9] for standard lineups and 54.7% [43.5, 65.6] for the combi-lineup. For target-absent lineups, correct performance was 78.3% [71.0, 85.1] for standard lineups and 67.6% [56.5, 77.9] for the combi-lineup. In Experiment 1, in line with the descriptives, performance did not vary significantly as a function of lineup procedure, Wald χ2(1) = 0.04, p = .850, Exp(b) = 0.94. However, performance did vary as a function of target presence, with better performance in target-absent lineups (94%) than target-present lineups (75%), Wald χ2(1) = 17.68, p < .001, Exp(b) = 5.38. In Experiment 2, performance again did not vary significantly as a function of lineup procedure, Wald χ2(1) = 0.18, p = .671, Exp(b) = 1.11. Again, performance in target-absent lineups (75%) was superior to performance in target-present lineups (51%), Wald χ2(1) = 25.02, p < .001, Exp(b) = 2.76. Figure 1 shows the ROC curves for standard and combi-lineups, together with a positive diagonal line that represents chance performance. Data points on this line would correspond to equal rates of correct and false identifications. A ROC curve has greater empirical discriminability when it rises closest to the upper-left area in the ROC graph. The different points that form the ROC curves represent pairs of correct and false identification rates at different levels of confidence. Looking at the ROC curve for the combi-lineup group, the point located at the upper right of the curve shows the rates of correct and false identifications, determined over all confidence levels taken together. One data point further to the left and we find the rates of correct and false identifications computed over all confidence levels taken together, with the exception of the lowest level of confidence. As we move further towards the left, we ultimately end at the lower left-most point, where only responses that were rated with the highest possible confidence (100%) were included for the computation. Figure 1. Receiver Operating Characteristic (ROC) Plots for Standard and Combi-lineups Combined for Experiment 1 and 2. The Diagonal Represents Chance Performance. 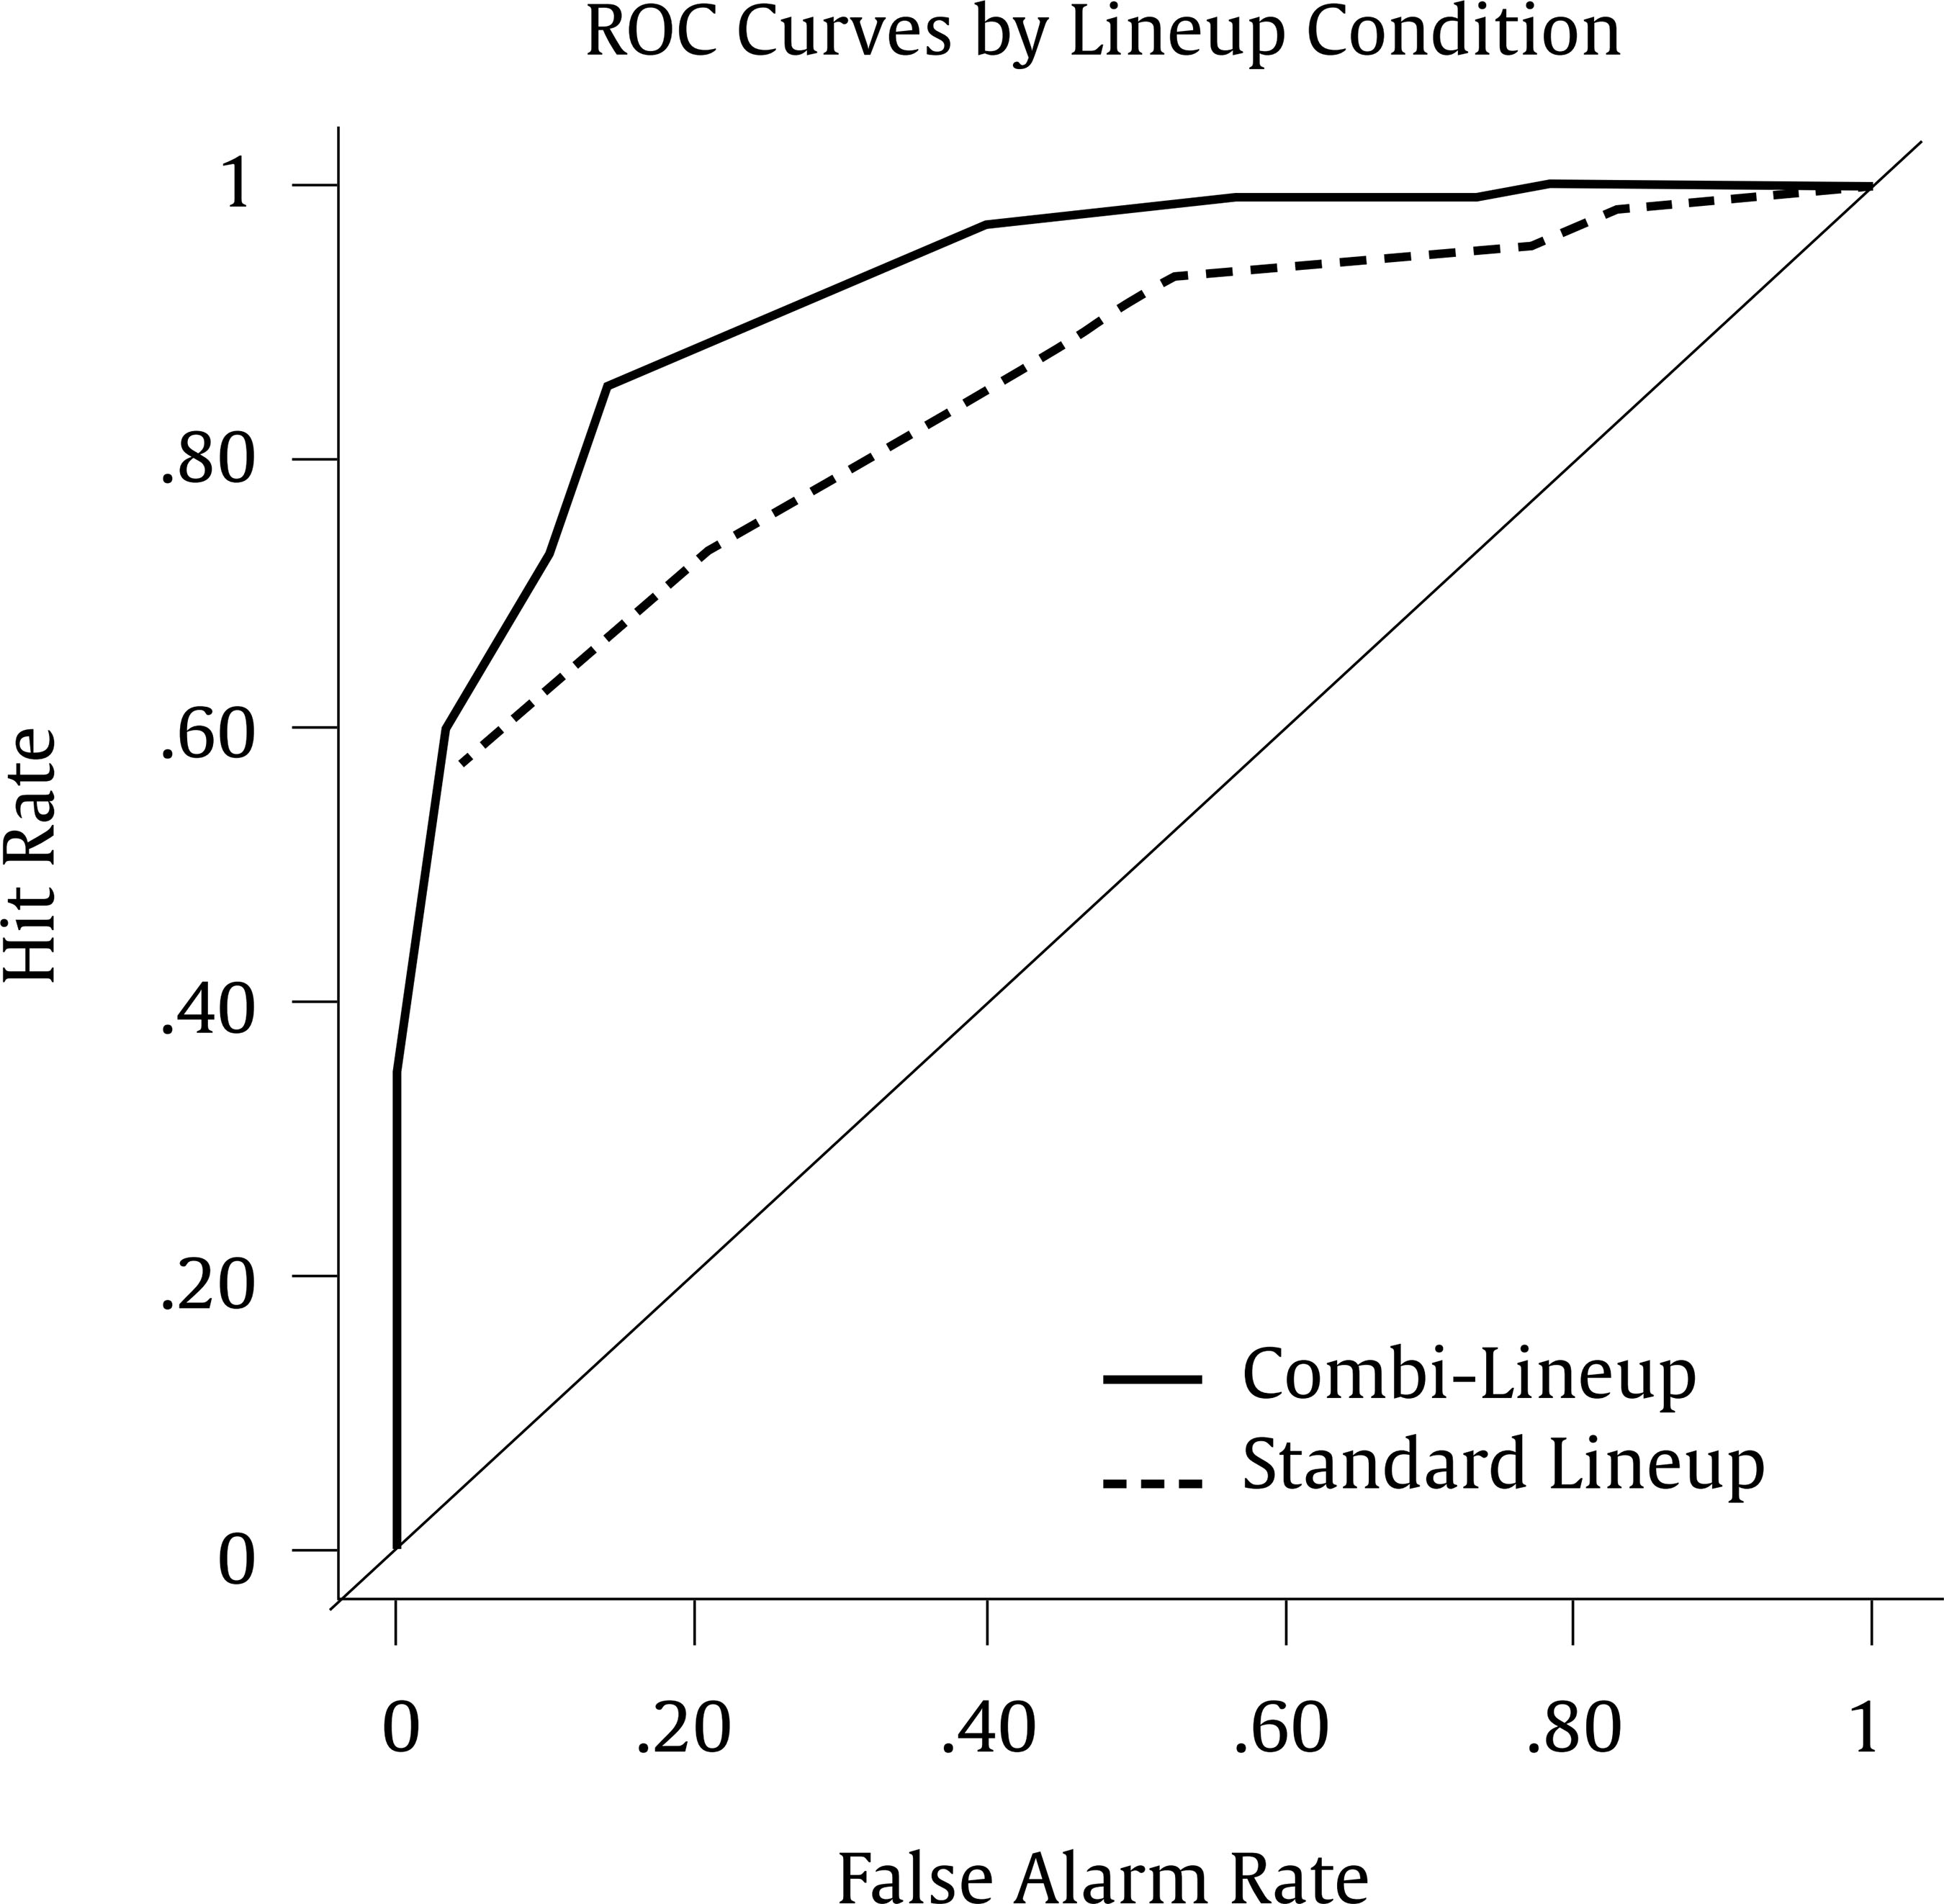 Note. False alarm rates represent all filler selections in target-absent line ups, i.e., we did not divide by the number of foils. To assess a possible effect of lineup procedure on identification performance, we calculated the area under the curve for the relevant range of false identification rates. Using a bootstrap analysis via the pROC package in R (Robin et al., 2011), we found the pAUC for the ROC curve to be .85 (95% CI [.779, .906]) for standard lineups, and .92 (95% CI [.867, .967]) for combi-lineups. DeLong’s test indicated that the difference between the two AUCs was not statistically significant, D(290.78) = 1.81, p = .071. On this comparison, a post-hoc power analysis (α = .05) showed that we had moderate power to detect an effect of this magnitude, 1-β = .77. Effect of Cueing on Lineup Performance in Combi-Lineups In neither experiment did cueing (accurate vs. inaccurate) have a significant effect on identification performance (Experiment 1: Wald χ2(1) = 0.40, p = .526, Exp(b) = 1.34; Experiment 2: Wald χ2(1) = 1.16, p = .282, Exp(b) = 1.48). In Experiment 1, the main effect of target presence was significant, as reported above, p = .002, Exp(b) = 5.45. In Experiment 2, the main effect of target presence was non-significant, p = .154, Exp(b) = 1.68. This is in line with the marginally significant interaction between target presence and lineup procedure in Experiment 2 that showed an effect of target presence for standard lineups but not combi-lineups (reported in footnote 2). Effect of Lineup Procedure on Confidence-Accuracy Relationship Confidence-Accuracy Characteristic Curves Figure 2 displays the CAC curves for standard and combi-lineups. For both experiments, CAC curves for the two lineup procedures were very similar at high and moderate confidence levels. Generally, the curves displayed under-confidence, especially in the moderate-confidence bin. Highly confident choosers were highly accurate in both experiments. Figure 2 Choosers’ Confidence-Accuracy Characteristic Curves for Standard vs. Combi-Lineups for Low Confidence, Medium Confidence, and High Confidence ([0, 54%], [55 - 84%], [85, 100%]) in Experiment 1 (left panel) and Experiment 2 (right panel). 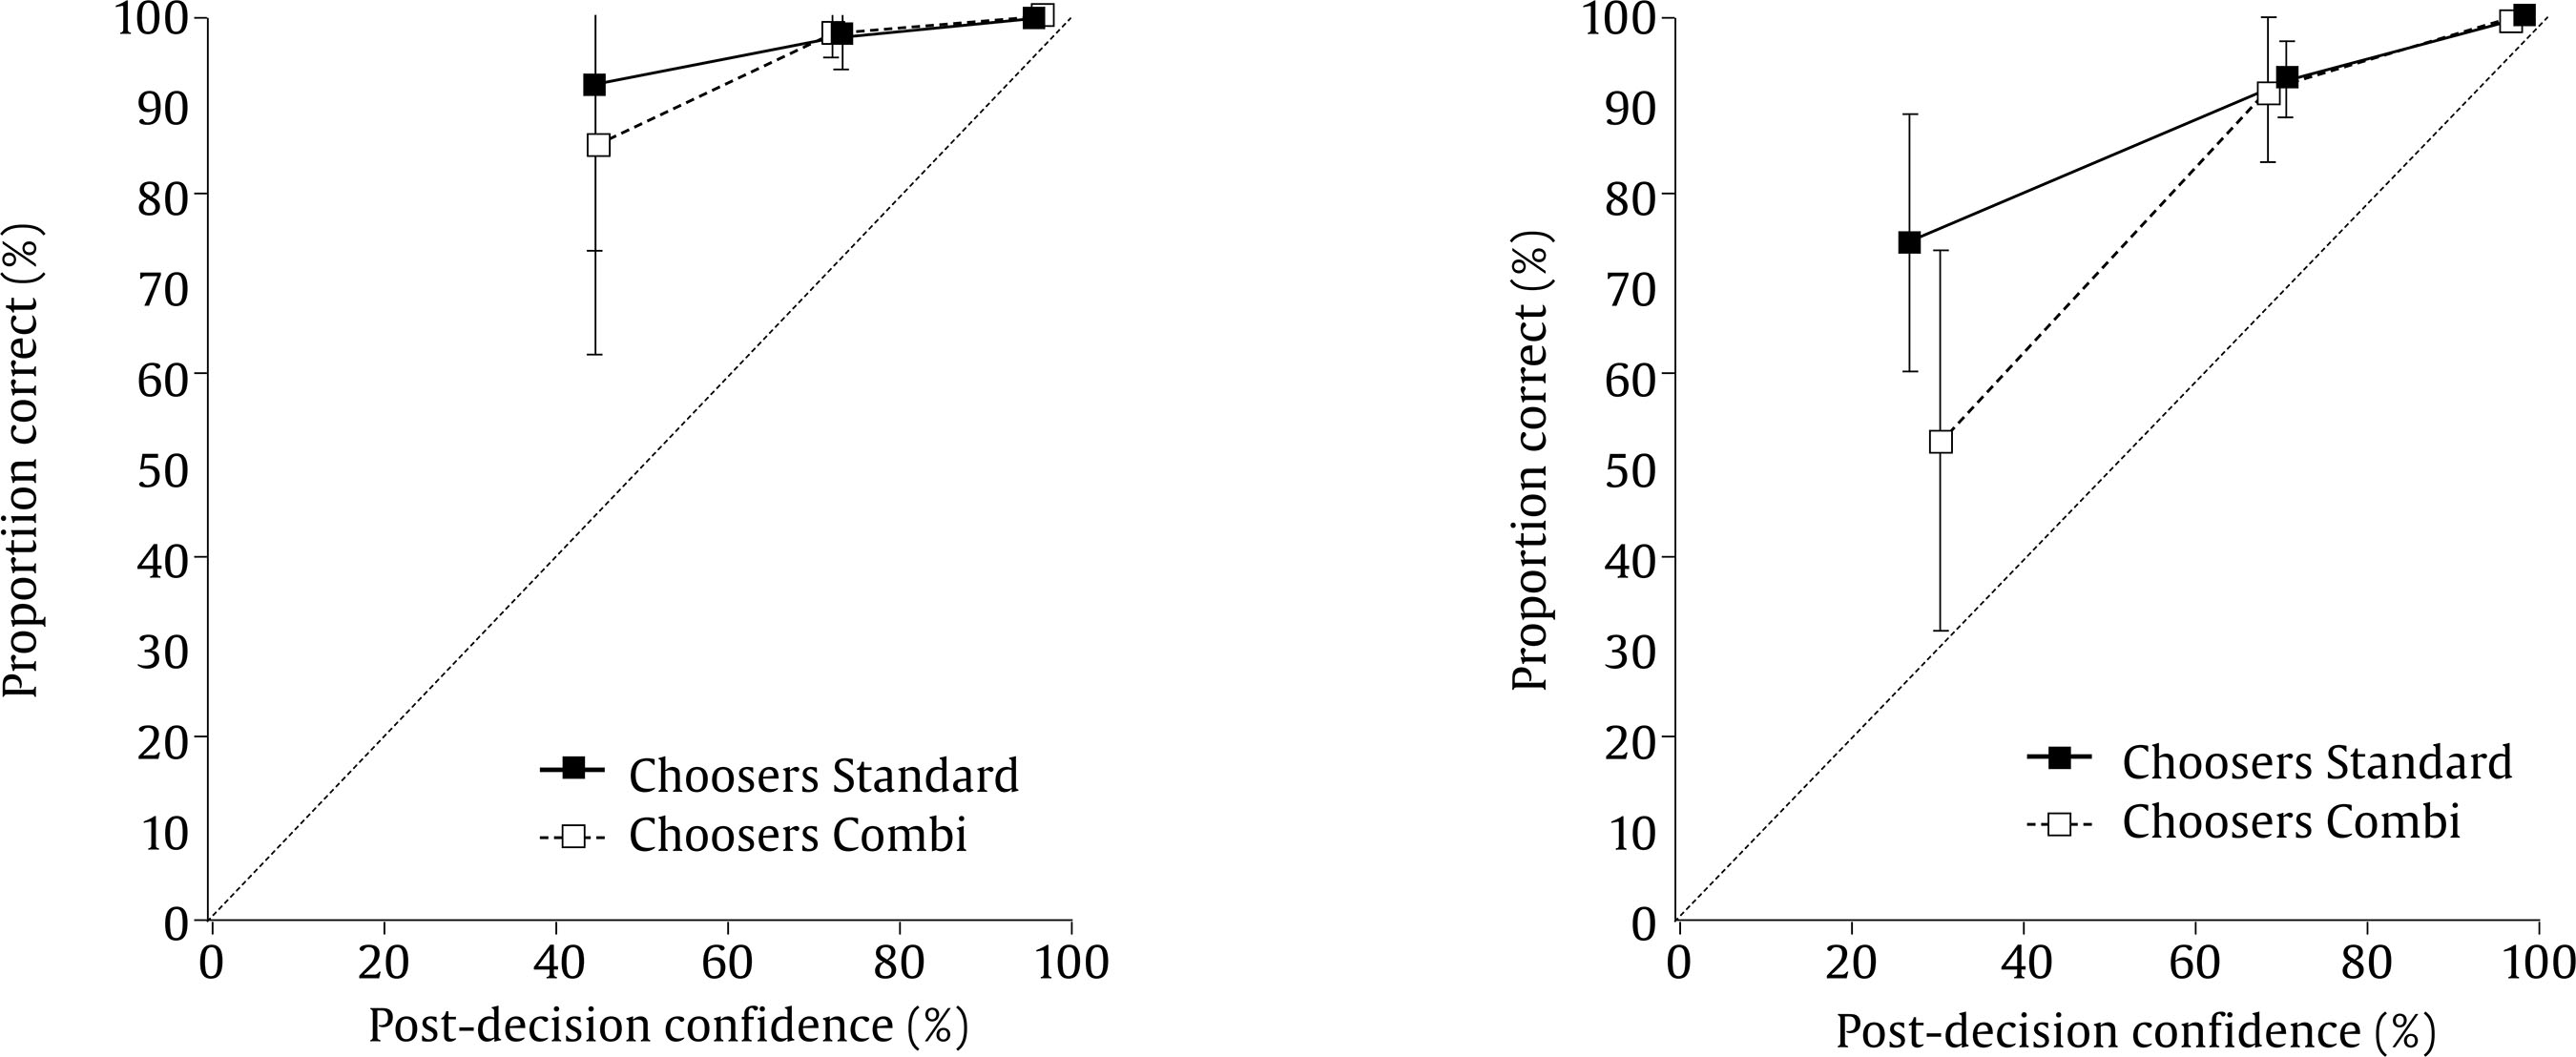 Confidence-Accuracy Relationship as a Function of Target Presence Base Rates To address the possibility that the confidence-accuracy relationship may depend on the target presence base rates, we plotted the probability that a suspect identification from portrait lineups was accurate across all possible target presence base rates (Figure 3). The identity line shows where the data would fall if an identification was non-diagnostic. Figure 3 Bayesian Information Gain Curves: Post-Lineup Probability that the Suspect is the Perpetrator on Portrait Lineups for Experiment 1 (left) and Experiment 2 (right) as a Function of the Base Rate of Target Presence and Lineup Procedure. 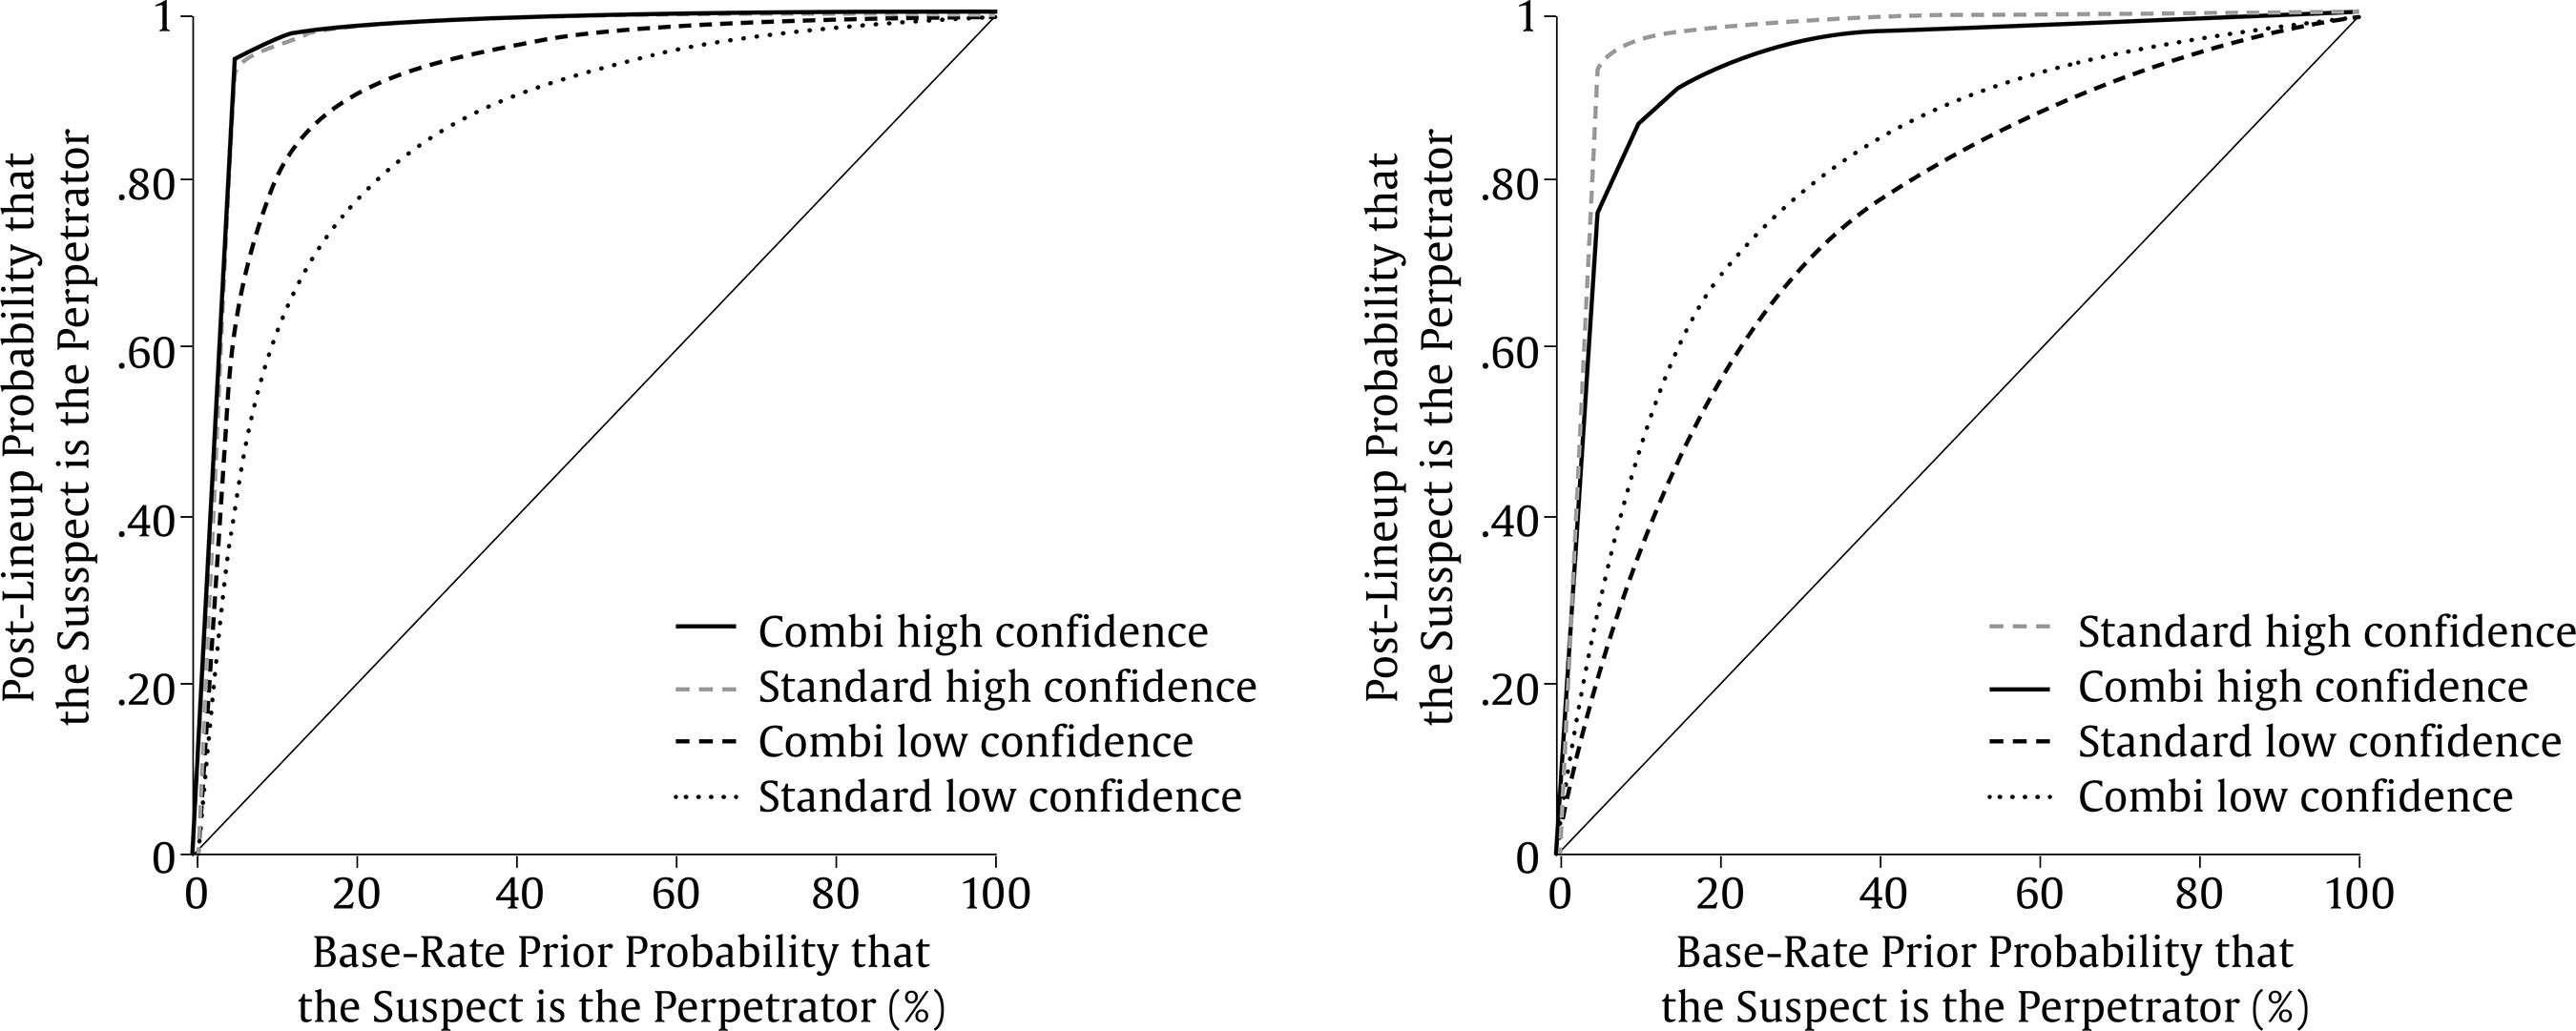 Note. For some conditions, the number of innocent suspect selections was 0 (Experiment 1: combi-lineup; Experiment 2: standard condition). To be able to construct the curves, we replaced 0 with 0.5. For both experiments, all curves were above the identity line, demonstrating that identifications were diagnostic of guilt. The heights of the curves indicate better discriminability for more confident participants at nearly the whole spectrum of target presence base rates than for less confident participants. The curves of highly confident participants in the two lineup procedure conditions were very similar. Decisions of less confident participants were somewhat more diagnostic when they were in the combi-lineup condition than in the standard lineup condition in Experiment 1, but more diagnostic when they were in the standard lineup condition in Experiment 2. Although many crimes are committed by more than one perpetrator, international best practice guidelines do not specify lineup procedures for multiple perpetrator cases. Dutch police have used a mixed-lineup procedure for multiple perpetrator cases since 1999 (van Amelsvoort, 1999). However, it has been unclear whether this combi-lineup procedure affects witness performance or the confidence-accuracy relationship. In two experiments, we compared performance and the confidence-accuracy relationship in combi-lineups and standard separate lineups. Unexpectedly, identification accuracy and discriminability were not significantly higher in combi-lineups than in standard lineups. As expected, the confidence-accuracy relationship was overall similar across procedures. We expected better identification performance in combi-lineups, compared to standard lineups based on the idea that in a combi-lineup one suspect can serve as a cue to other suspects (Tulving & Thompson, 1973; Tupper, Sauer et al., 2018). Our null findings for both target-present and target-absent lineups are in line with earlier work (Wells & Pozzulo, 2006), but contrary to reported advantages of the cued procedure for target-present but not target-absent lineups (Dempsey, 2012; Hobson & Wilcock, 2011). The literature suggests that cuing effects depend on a strong association between the binding stimuli (Tupper, Sauer et al., 2018) and a weak memory for the perpetrator (Smith & Vela, 2001). Arguably, the association between the two thieves in the stimulus film was strong, as they were planning and carrying out a theft in one video sequence. The very high identification performance rates in Experiment 1 (see Table 2), however, suggest that memory for the perpetrator was strong and that a ceiling effect might have occurred. This could explain the non-significant effects of cueing. On the other hand, identification accuracy was more moderate in Experiment 2, especially for target-present lineups – the condition that showed cueing effects in some earlier work (Dempsey, 2012; Hobson & Wilcock, 2011). In summary, our findings align with a literature of inconsistent success in eliciting cueing effects (Dempsey, 2012; Hobson & Wilcock, 2011; Tupper, Sauer et al., 2018; Wells & Pozzulo, 2006) and cast some doubt on the cueing hypothesis. Both our lineup procedures were designed to protect participants’ confidence judgments from any external interference. Based on this, and also on earlier work comparing the confidence-accuracy relationship for a single vs. multiple-perpetrator crimes (Lockamyeir et al., 2021), and on evidence that witnesses can account for performance decreases when making their confidence judgment (Palmer et al., 2013; Semmler et al., 2018), we had no reason to believe that the confidence-accuracy relationship would differ between combi-lineups and standard lineups. Indeed, the CAC curves look very similar (see Figure 2), as do the Bayesian Information Gain Curves (see Figure 3). Overall, our findings suggest that confidence is reliably associated with accuracy in the Dutch combi-lineup procedure. A limitation to this work is that participants in Experiment 1 participated in another lineup experiment in the same testing session. Potentially, the earlier study could affect the results of the current Experiment 1. Reassuringly, earlier work found that making multiple identification decisions was not harmful to eyewitness memory and had either no effect or a trivial effect on accuracy, choosing, or confidence (Mansour et al., 2017; Tupper, Sauerland et al., 2018). Additionally, the correspondence of the pattern of results in Experiments 1 and 2 gives us confidence in the findings of Experiment 1. Policy Implications and Future Directions We present empirical evidence that the Dutch combi-lineup procedure leads to very similar results as multiple, separate standard lineups. In two experiments, the combi-lineup and standard lineup resulted in comparable identification performance and confidence-accuracy relationship. Future studies might investigate how the combi-lineup fares with larger groups of perpetrators. Another motivation for using the combi-lineup is the idea that the combi-lineup might reduce the strain on witnesses, compared to multiple lineups. While such reasoning is intuitive, this has never been studied in an experimental setting. This is another avenue for future research. To conclude, the current research provides evidence that the Dutch combi-lineup is a viable method for establishing the identity of perpetrators in cases with multiple perpetrators. It leads to similar performance and confidence-accuracy relationship as multiple, separate standard lineups. The procedure could serve as a model for police in other countries when dealing with multiple perpetrator crimes. Future research is to establish whether the combi-lineup reduces the strain on witnesses. Conflict of Interest The authors of this article declare no conflict of interest Cite this article as: Sauerland, M., Iannuzzi, M., Tupper, N., van Amelsvoort, A. G., & Tredoux, C. G. (2026). A test of combi-lineups: A lineup procedure for multiple perpetrator cases in the Netherlands. European Journal of Psychology Applied to Legal Context, 18, Article e260177. https://doi.org/10.5093/ejpalc2026a2 1 The number of lineup members is limited to six persons per suspect in Dutch combi-lineups. 2 Other experiments that compared multiple and single perpetrator crimes did not collect confidence judgments (Megreya & Bindemann, 2012) or did not report the confidence-accuracy relationship as a function of number of perpetrators (Clifford & Hollin, 1981; Nortje 2018). 3 We did compute the simple slopes for Experiment 2 (p = .055) for exploratory purposes. Performance did not vary as a function of lineup procedure in either target-present, p = .406, nor target-absent lineups, p = .103. Rather, performance in target-absent lineups (78%) was superior to performance in target-present lineups (49%) for standard lineups, p < .001, but not for combi-lineups, p = .168. References |
Cite this article as: Sauerland, M., Iannuzzi, M., Tupper, N., van Amelsvoort, A. G., & Tredoux, C. G. (2026). A Test of Combi-Lineups: A Lineup Procedure for Multiple Perpetrator Cases in the Netherlands. The European Journal of Psychology Applied to Legal Context, 18, Article e260177. https://doi.org/10.5093/ejpalc2026a2
Correspondence: melanie.sauerland@maastrichtuniversity.nl (M. Sauerland).Copyright © 2026. Colegio Oficial de la Psicología de Madrid


 PDF
PDF e-PUB
e-PUB CrossRef
 JATS
JATS Print
Print Send
SendEMAIL ALERT
The European Journal of Psychology Applied to Legal Context is licensed under a Creative Commons Attribution-NonCommercial-NoDerivatives 4.0 International License


