Adapting a Measure of Quality of Life to Children with Down Syndrome for the Development of Evidence-based Interventions
[Adaptaci├│n de una medida de calidad de vida a ni├▒os con s├şndrome de Down para el desarrollo de intervenciones basadas en la evidencia]
Laura E. Gómez1, Miguel A. Verdugo2, Mar Rodríguez2, Lucía Morán1, Víctor B. Arias2, and Asunción Monsalve1
1Universidad de Oviedo, Spain; 2INICO, Universidad de Salamanca, Spain
https://doi.org/10.5093/pi2019a17
Received 9 August 2019, Accepted 24 September 2019
Abstract
Research has highlighted that no instrument with adequate evidence of validity and reliability currently exists to assess quality of life (QoL) in children with Down syndrome (DS). Important limitations have been pointed out when existingQoL instruments for children with intellectual disability are applied to this population. The main goal of this research is to adapt the KidsLife scale by selecting the most reliable and discriminant items for children and youth with DS. The sample was composed of 405 children with DS, aged between 4 and 21 years old, attending organizations that provide educational, social, and health services. The field-test version of the KidsLife scale was administered as an informantreport, completed by someone who knew the child well, and who had opportunities to observe him/her over long periods of time in different situations. Evidence of reliability and validity based on the internal structure of the scale is provided.According to the QoL model used to develop the scale, the solution showing the best fit to the data was the one with eight intercorrelated domains. Finally, the implications of the study, its limitations and suggestions for future researchare discussed.
Resumen
La investigación ha puesto de manifiesto que actualmente no existen instrumentos que presenten una adecuada evidencia de validez y fiabilidad para evaluar la calidad de vida (CV) de los niños con síndrome de Down (SD). De hecho, se encuentran importantes limitaciones cuando se aplican a esta población instrumentos de CV diseñados para personas con discapacidad intelectual. El principal objetivo de este trabajo es adaptar la escala KidsLife seleccionando los ítems más fiables y con mayor poder discriminativo para los jóvenes con SD. La muestra estaba formada por 405 jóvenes con SD, con edades comprendidas entre los 4 y los 21 años que asistían a organizaciones proveedoras de servicios educativos, sociales y de salud. La versión piloto de la escala KidsLife la contestó un informante que conocía al joven o a la joven bien, teniendo la oportunidad de observarle durante periodos prolongados de tiempo en diferentes situaciones. Se proporcionan pruebas de la fiabilidad y validez basadas en la estructura interna de la escala. De acuerdo con el modelo de CV utilizado para el desarrollo de la escala, la solución que mostró mejor ajuste a los datos fue la de ocho dimensiones correlacionadas. Finalmente, se discuten las implicaciones del estudio, sus limitaciones y se hacen sugerencias para la investigación futura.
Keywords
Quality of life, Down syndrome, Youth, Assessment, ValidityPalabras clave
Calidad de vida, S├şndrome de Down, J├│venes, Evaluaci├│n, ValidezCite this article as: Gómez, L. E., Verdugo, M. A., Rodríguez, M., Morán, L., Arias, V. B., & Monsalve, A. (2020). Adapting a Measure of Quality of Life to Children with Down Syndrome for the Development of Evidence-based Interventions. Psychosocial Intervention, 29(1), 39 - 48. https://doi.org/10.5093/pi2019a17
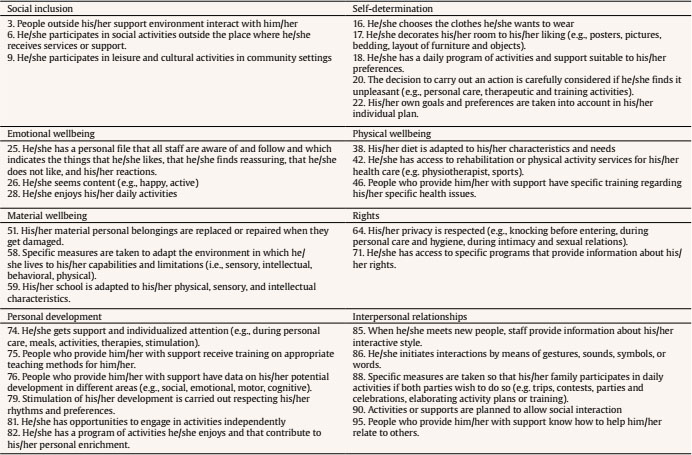
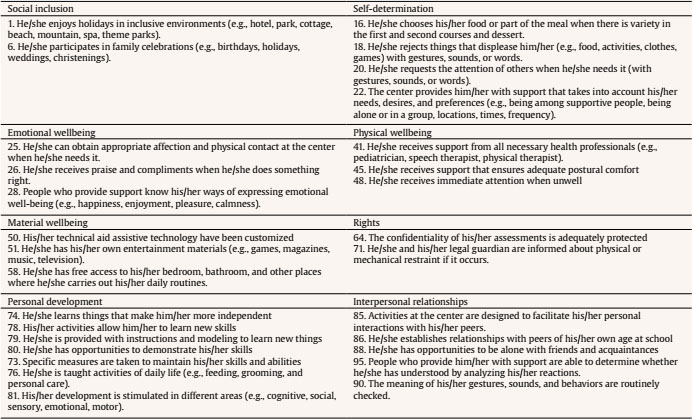
gomezlaura@uniovi.es Correspondence: gomezlaura@uniovi.es (L. E. Gómez).Down syndrome (DS) is a lifelong developmental disability that has a substantial impact on a person’s life, and it may therefore be assumed that quality of life (QoL) models are desirable for the development of research and practice in this field. In fact, the need for the application of more comprehensive individual QoL models for research and practice in DS was first recognized over 20 years ago (Brown, 1998, 2014). However, despite important developments in the operationalization and application of the QoL construct in the field of intellectual disability (ID), there is a gap in research literature related to potential differences amongst people with DS compared to people with ID. Specifically, assumptions about people with ID are frequently generalized to people with DS without confirming whether they are true. Trisomy 21 is the most common genetic cause of ID and is usually associated with a high prevalence of health-related issues, such as cardiac, gastrointestinal, immunological, respiratory, endocrine, dental, sensory, and orthopedic conditions (Bittles, Bower, Hussain, & Glasson, 2007). However, there are also cognitive, social, emotional, behavioral, and contextual aspects specific to people with DS that may impact their QoL. The majority of people with DS have mild to moderate intellectual disability (Acharya, 2011). In fact, a distinctive cognitive phenotype has been identified across people with DS that is characterized by relative weakness in expressive language, syntactics, and verbal working memory (Silverman, 2007), as well as strengths in visual memory, visual-motor integration, and visual imitation (Fidler, 2005). Further, children with DS are usually shown to be more empathic in that they characteristically demonstrate greater prosocial responses and charming personalities such as sending more positive emotional signals like smiling, which could be interpreted as an overuse of their social skills to compensate other areas of needed improvement (Fidler, 2005). People with DS also present fewer emotional and behavioral disorders than other people with ID (Mantry et al., 2008). In their social lives, people with DS tend to experience challenges related to communication (Leonard, Msall, Bower, Tremont, & Leonard, 2002) and social relationships (Foley et al., 2013) that may affect their QoL. Indeed, the characteristic facial features associated with the DS phenotype make it a visible disability that may impact interpersonal relationships and promote isolation (Betancor, Arino, Rodríguez, & Delgado, 2016). On the other hand, some research has explored the “DS advantage”, suggesting that families of children with DS experience less stress and greater rewards in comparison with families with a child with ID from another cause (Hodapp, Ly, Fidler, & Ricci, 2001). Therefore, specific social aspects of the lives of people with DS may also influence their QoL. For example, people with DS show closer sibling (Orsmond & Seltzer, 2007) and parental (Esbensen & Seltzer, 2011) relationships than people with ID; however, people with DS also participate in predominantly solitary and sedentary leisure activities (Oates, Bebbington, Bourke, Girdler, & Leonard, 2011). Given the aforementioned characteristics and support needs specific to people with DS, it is critical to better understand and measure QoL in this population. Most studies have focused on family QoL (Marchal, Maurice-Stam, van Trotsenburg, & Grootenhuis, 2016; Vadakedom et al., 2017) or health-related QoL (Graves et al., 2016) and found significantly poorer scores for youth with DS in comparison with normative data (Haddad, Bourke, Wong, & Leonard, 2018; Jung, Chung, & Lee, 2017; Rofail et al., 2017; Shields et al., 2018; Xanthopoulos et al., 2017). Yet individual QoL is a broader and more comprehensive construct that is not merely reduced to health-related wellness as other important domains and indicators that are relevant for children with DS need to be articulated in order to develop comprehensive interventions (Murphy et al., 2017; Newton, 2018). Among existing individual QoL frameworks, Schalock and Verdugo’s (2002) eight-domain model (composed of eight intercorrelated domains of emotional wellbeing, physical wellbeing, material wellbeing, personal development, rights, self-determination, social inclusion, and interpersonal relationships) is one of the most internationally accepted and used in the ID field (Bowling & Gabriel, 2004; Gómez & Verdugo, 2016; Gómez, Verdugo, & Arias, 2010; Schalock, Verdugo, Gómez, & Reinders, 2016; Van Hecke et al., 2018; Xu, Wang, Xiang, & Hu, 2005). However, research has also highlighted the need for measurement tools of QoL with adequate evidence of validity and reliability for children with DS (Downs et al., 2019; Goodman & Brixner, 2013). To our knowledge, only two individual QoL instruments have shown adequate evidence of content and validity based on their internal structure for use with children and youth with ID. One is the Quality of Life Inventory-Disability (QI-Disability; Downs et al., 2019), a recently published Australian instrument for 6-to-18-year-old children with ID. It comprises 32 items accompanied by a five-point frequency scale that measures six domains (social interaction, positive emotions, physical health, negative emotions, leisure and the outdoors, and independence). The psychometric properties of the QI-Disability questionnaire were provided through the responses of a total of 253 parents, of whom only 61 (24%) had children with DS. The other instrument is the Spanish KidsLife scale (Gómez, Alcedo et al., 2016). The Spanish KidsLife scale is composed of 96 items with a four-point frequency answer format organized around the eight QoL domains proposed by Schalock and Verdugo. Evidence of content validity regarding the Spanish KidsLife scale’s suitability for children with ID and significant support needs were described by Gómez et al. (2014). Namely, the internal structure and reliability of the Spanish KidsLife scale were confirmed on the basis of answers from relatives and staff providing supports to 1,060 children with ID aged between 4 and 21, including only 187 (17.7%) with DS. Because the Spanish KidsLife scale is the only existing measure of QoL developed in the Spanish context, it is important to note that several limitations were identified during the field-test of the validation process when it was applied to parents of children with DS (Rodríguez, 2018). Specifically, among children with high levels of functioning, some items of the Spanish KidsLife scale led to misunderstandings, inconveniences, or unease (e.g., items related to mobility, pain, or postural comfort), resulting in respondents’ refusal to complete the questionnaire. However, when respondents completed such items, their most frequent answers were the most positive option and a ceiling effect (i.e., maximum score indicated resulting in non-discrimination across items) was found across several domains. Therefore, because existing instruments for people with ID have shown important limitations when used specifically with children and youth with DS, the purpose of the current study is to address this gap in the research literature by utilizing the KidsLife scale as a starting point. Given that the field-test version of the KidsLife scale included 156 items, it was necessary to return to this initial version and increase the sample of children with DS in order to check psychometric properties and select the most appropriate items for this target population. Therefore, the main goal of this study was to select the most reliable and discriminant items for children and youth with DS and to develop the KidsLife-Down, following a similar procedure to that used to develop the KidsLife scale for children and youth with ID and significant support needs (Gómez, Alcedo et al., 2016) and the KidsLife-ASD for those with ID and autism spectrum disorder (Gómez, Morán, Alcedo, Arias, & Verdugo, in press). To that end, proof of reliability and validity based on the internal structure of the new scale will be provided in subsequent sections. Participants The sample utilized in this study included 405 people. The requirements for participating were: (a) having DS and ID; (b) aged between 4 and 21 years old; and (c) attending organizations that provide educational, social, or health services in Spain. More than half of the sample were male (n = 238, 58.9%). Participant ages ranged between 4 and 21 years old (M = 12.1, SD = 4.7). The mean age across female participants was 11.59 years old (SD = 4.50) and 12.42 (SD = 4.72) across male participants. Most participants had a moderate level of ID (65.6%), with intermittent (41.1%) or extensive (30.4%) support needs according to official records at participating organizations and centers. Several participants presented other associated conditions, such as cardiopathies (17%), language disorders (17%), visual impairments (14%), hearing impairments (10.6%), or West syndrome (10.9%). Almost all participants lived in their family home (99%), and 46.8% attended traditional schools while 45.5% attended special schools and 7.7% were enrolled in both. Most participants (46%) had a severe dependency (level 2) that was legally recognized while 35% had a moderate dependency (level 1) and only 18.3% had a great dependency (level 3). Scales were completed by 325 respondents from 73 Spanish organizations. The majority were female (85%). Approximately two-thirds (64.4%) were parents, mainly mothers (53.2%), while approximately one-third (35.6%) were direct-care staff (e.g., teachers, psychologists). The mean age of those that completed the scale was 45.3 years (SD = 6.8), with a range of 21 and 61 years old. People completing the scale about a person with DS had a mean age of 9.2 years (SD = 5.3) and most interacted with the person with DS daily (85%). With regard to the participant organizations, participants received private (61.1%) or public funds (34.2%) from educational centers (69.3%) more often than social (28.5%) and health (2.2%) services. Most participants (90.8%) lived in urban areas while the remaining 9.2% resided in rural settings throughout 16 of Spain’s 17 regions (Cantabria was the only one that did not participate) across 37 of 50 provinces. Further, a high percentage of participants came from Madrid (20.2%), Andalucía (11.6%), and Murcia (11.1%). Instrument The field-test version of the KidsLife scale (Gómez, Alcedo et al., 2016) was utilized in this study. The scale assesses the QoL in people with ID aged 4 to 21 years old who receive support in organizations and services for people with ID or DS. The KidsLife scale is designed as an informant-report, so respondents must be external observers who know the participant well (for at least six months) and who have had opportunities to observe the child or youth over long periods of time in different situations (e.g., parents, siblings, teachers, staff). The field-test version of the KidsLife scale is comprised of 156 items organized around the eight domains proposed by Schalock and Verdugo (20 per domain, with the exception of social inclusion that included 16 items). All items were formulated as third-person declarative statements with four answer options (never, sometimes, often, and always). Scores ranged between 1 and 4, and depended on the valence of the item. In addition, sociodemographic data were collected about the person with DS, the respondent, and the service/support provider. Procedure Information on the project and its goals was disseminated in scientific meetings, conferences, and university courses, as well as on social media and websites of the Institute on Community Integration (INICO, University of Salamanca) and Down España, the Spanish DS confederation comprising 92 associations. Additionally, the research team carried out a web search of centers and organizations offering supports and services to people with ID in the different regions. An email was sent to each organization that might be interested in participating. If a center did not use email or needed more information, it was contacted by phone. Organizations and services that had expressed an interest in participating received an online survey to include their contact details, the name and location of their organization, information about the professional coordinating the study in each organization, and the number of potential participants. The person pointed out by each organization as coordinator of the study acted as an intermediary with the research team, transmitting questions and concerns while complying with the goals and commitments of the measurement tool. Because the quality of life of each participant needed to be assessed by only one person in that organization, the main task of coordinators was to organize who was going to be assessed for whom (i.e., matching participants and respondents). In addition to the the KidsLife scale administration booklets, a protocol of instructions to implement the measure was sent via email to each participant organization with the aim of standardizing the assessment procedures. The protocol included exhaustive information concerning the study, access to the electronic version of the scale, the instruction manual, and the informed consent to be signed by participants or their legal guardians. A deadline to send the agreed number of KidsLife scales was negotiated with each organization. Throughout the process, the research team was available (via email, phone, videoconference, or face-to-face) to respond to questions and issues related to assessment administration, as well as arrange deadlines to deliver the questionnaires. Some scales were administered to parents (at their request) through individual interviews by one of the members of the research team. Anonymous identification codes were used to ensure data confidentiality. These codes were known by the professional coordinating the study in each organization and participating organizations could be supplied with anonymized results for their own participants, allowing them to implement evidence-based practices. The study was approved by the ethics committee of the University of Oviedo and met the current ethical standards and the principles of the Declaration of Helsinki. Data Analysis Given that a response was mandatory for all items, there were no missing data. Reverse-worded items were reverse coded before analysis. Data analysis was conducted using SPSS 24.0 and MPlus 7.0. In order to refine the scale and select the items (grouped into the eight domains) with the strongest psychometric properties for use with participants with DS (Muñiz & Fonseca, 2019), an analysis of the reliability and discriminating power of the items was conducted. This involved calculating the difficulty indexes (DI), the corrected homogeneity indexes (CHI), and the internal consistency coefficient using Cronbach’s alpha. Subsequently, an exploratory factor analysis (EFA) was performed for each domain, using the principal component method (two factors, with Promax rotation) in order to check communalities, factor saturation, and the variance explained. The following criteria were used to identify the most discriminating items: (a) mean difficulty, large SD, and high discrimination; (b) CHI > .300; and (c) in the EFA, saturation in the first factor and the amount of variance explained by the first factor was greater than the second (with a difference > 3). The objective was to select 12 items for each domain (to match the number of items per domain in the other versions of the KidsLife scale). As it was important for the selected items to be psychometrically sound, to not overlap in terms of content, and to reflect relevant issues relating to quality of life in young people with DS, different solutions were tested with items that met the criteria; the analysis was repeated with each selection to determine if the values improved or if they still remained adequate. The aim was not to select the items with the highest internal consistency or the best psychometric properties, but rather to prioritize heterogeneity and non-overlap of content from among the items with adequate psychometric properties. Confirmatory factor analysis was used to provide evidence of the validity of the internal structure of the scale. The following analytic steps were undertaken: (a) the properties of each separate subscale were analyzed using eight unidimensional confirmatory models to inspect the degree of convergent validity of the items and to detect any violations of conditional independence; and (b) the properties of the complete model were analyzed using a model of eight correlated factors. Minimum criteria for adequate model fit were as follows (Browne & Cudeck, 1992; Marsh & Hau, 1996): comparative fit index (CFI) and Tucker-Lewis index (TLI) above .90 and .95, and a root mean square error of approximation (RMSEA) below .08. In all models, the modification index (MI) and standardized expected parameter change (SEPC) were inspected for unspecified correlations between the residuals. The cutoffs for good model fit were MI values below 10, accompanied by SEPC values below .30 in absolute value (Saris, Satorra, & Van der Veld, 2009). Finally, all models included a multilevel component with the aim of controlling for non-independence of observations made by the same evaluator. In order to examine the reliability of the domains, average variance extracted (AVE) was measured and values greater than .50 were considered adequate (Hair, Ringle, & Sarstedt, 2011). McDonald’s omega coefficient—considered the most sensitive index for a more accurate degree of confidence in the evaluation of the internal structure—was also calculated for each domain. Reliability and Refinement of the Scale First, the reliability of the eight subscales was analyzed in terms of internal consistency using the internal consistency coefficient. Further, the mean and SD of the items were calculated, as well as the CHI. The CHI values ranged from .006 (i069 in physical wellbeing) to .725 (i123 in personal development); the highest CHI were observed in personal development and social inclusion, while the lowest were in physical wellbeing and rights. Table 1 summarizes the mean index values and the coefficients for each of the eight domains. Table 1 escriptive Values of Items in the Field-Test Version  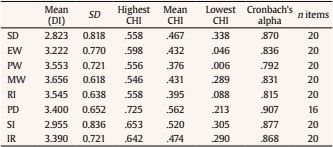 Note. SD = self-determination; EW = emotional wellbeing; PW = physical wellbeing; MW = material wellbeing; RI = rights; PD = personal development; SI = social inclusion; IR = interpersonal relationships. After calculating the descriptive values of the items and the internal consistency of the domains of the initial scale, the first step in scale refinement and item selection consisted of removing items with CHI < . 300 (n = 15). Given the excessive length of the pilot version, our subsequent objective was to refine and shorten the scale to a total of 12 items per domain to match the number of items in the final version of the original KidsLife scale (n = 96). Second, items with low loadings in the first factor of EFA and high loadings in the second were eliminated. Third, from within each domain we eliminated items with low discriminating power (i.e., means closest to the highest score together with low SD values). Of the remaining items that exceeded all of these criteria, we selected those with the highest CHI values (fourth step) and without redundant content (fifth step). The refinement process for the pilot version of the scale is set out in Table 2. Table 2 Eliminated Items in the Final Version of the Scale   Note. SI = social inclusion; SD = self-determination; EW = emotional wellbeing; PW = physical wellbeing; MW = material wellbeing; RI = rights; PD = personal development; IR = interpersonal relationships. 1Deleted on that domain but included in another. An exception to this process was i014 (“he/she receives supports and interventions in a natural context”): the content was considered extremely relevant for the target group; it did not lead to any misunderstandings or unease during fieldwork; and it obtained adequate values for the DI and variability (M = 2.93, SD = 0.906). However, the CHI result of .339, although adequate, was low in comparison with the other items in its domain; the same was true of communality in the EFA (.179). For these reasons, it was decided not to keep the item in its initial domain of social inclusion, but to reserve it for the personal development domain, which contained other items associated with supports. Included with the 11 items selected for the personal development domain, the CHI for i014 reached .351 and communality increased to .546. The final version of the scale comprises 96 items organized into the eight QoL domains. Of the final 96 items, 29 (30.2%) were different from those included in the original KidsLife scale. Any items that were different are in Appendix A: the domains with the largest number of different items were personal development (n = 6), interpersonal relationships (n = 5), and self-determination (n = 4). The other domains each had three items that were different, with the exception of the rights domain, which differed by only two items, and was therefore the closest to the original instrument. These items eliminated from the KidsLife original scale are shown in bold in Appendix B. Evidence of Validity Based on the Internal Structure In order to provide evidence of validity based on the internal structure of the scale, we checked the fit of the eight estimated unidimensional models, which correspond to the eight domains of the QoL model (Schalock & Verdugo, 2002). The baseline unidimensional models (unpaired models) mostly showed inadequate RMSEA values, suggesting the presence of a limited amount of unmodeled systematic residual variance. In addition, in the analysis of the MI and SEPC, values greater than .10 and .30 respectively were observed. Consequently, for each unidimensional model the correlations between residuals suggested by the MI and SEPC were freed in successive iterations until the fit (RMSEA) was adequate and the MI and SEPC values came below .10 and .30 respectively. In all cases at least one correlation between residuals needed to be freed, with the rights domain requiring the most parameters to be freed (n = 5). The correlations between residuals were in all cases associated with pairs of items that, while not redundant, clearly shared specific content (e.g., “he/she has a preventive health plan” and “his/her use or need for medication is regularly monitored” in physical wellbeing) or had similar wording (e.g., “he/she participates in inclusive activities that interest him/her” and “he/she participates in adequate inclusive activities for his/her physical and mental conditions”). The number of parameters freed was very low in relation to the total, and justified by the content or wording of the items. The modified unidimensional models (paired models) in all cases demonstrated adequate fit, the lowest being in the interpersonal relationships domain (RMSEA = .068, CFI = .958, TLI = .945), and the best fit in material wellbeing (RMSEA = .040, CFI = .981, TLI = .985). Table 3 compares the partial fit indexes of the eight baseline unidimensional models (unpaired models) with the eight modified unidimensional models (paired models); Table 4 includes the standardized factor loadings of the items in the modified unidimensional models (paired models in Table 3). Table 3 Eliminated Goodness-of-Fit Indexes for the Tested Models  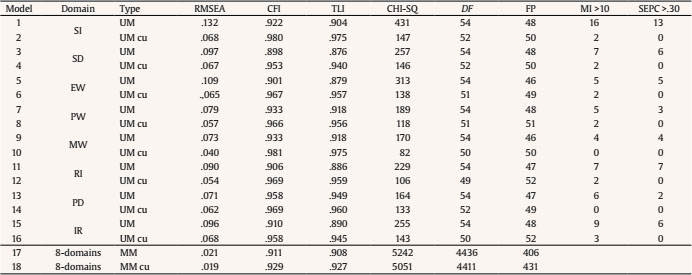 Note. SI = social inclusion; SD = self-determination; EW = emotional wellbeing; PW = physical wellbeing; MW = material wellbeing; RI = rights; PD = personal development; IR = interpersonal relationships. 1Deleted on that domain but included in another. Table 4 Factor Loadings for the Unidimensional Models   Note. SI = social inclusion; SD = self-determination; EW = emotional wellbeing; PW = physical wellbeing; MW = material wellbeing; RI = rights; PD = personal development; IR = interpersonal relationships. All loadings are significant (p <.01). After checking the fit of the eight unidimensional models, a new confirmatory first-order model (M17 in Table 3) was then measured using the combined specifications of the eight unidimensional models tested in the previous phase. The fit of M17 was acceptable (RMSEA = .019, CFI = .929, TLI = .927), without high MI and SEPC values that might suggest the need for additional modifications to the model. The last model (M18 in Table 3) consisted of the eight intercorrelated domains incorporating the correlated uniquenesses specified previously in the unidimensional models. Table 5 shows that the standardized factor loadings of this model were above .40 (M = .63, SD = .10). Table 6 presents the correlations between the eight domains, ranging from .39 (physical wellbeing and social inclusion) to .86 (interpersonal relationships and personal development). Table 5 Factor Loadings for Eight Intercorrelated Domains Model (M18)   Note. SI = social inclusion; SD = self-determination; EW = emotional wellbeing; PW = physical wellbeing; MW = material wellbeing; RI = rights; PD = personal development; IR = interpersonal relationships.All loadings are significative (p <.01). Table 6 Correlations between Domains in M18   Note. SI = social inclusion; SD = self-determination; EW = emotional wellbeing; PW =physical wellbeing; MW = material wellbeing; RI = rights; PD = personal development; IR = interpersonal relationships. In addition, the domains achieved a high degree of convergent validity because the majority of the AVE values were close to .50 (M = .43, SD = .048). Similarly, in all cases reliability based on the model was satisfactory, with omegas ranging from .85 (self-determination) to .90 (rights). AVE values and omegas are presented in Table 7. Table 7 McDonald’s Omega and AVE for M18   Note. AVE = average variance extracted; SI = social inclusion; SD = self-determination;EW = emotional wellbeing; PW = physical wellbeing; MW = material wellbeing; RI =rights; PD = personal development; IR = interpersonal relationships. Discussion The general aim of this study was to identify and select the most reliable QoL items for children and youth with DS and, consequently, to adapt the KidsLife scale for this population. To our knowledge, the KidsLife-Down constitutes the first QoL scale specifically adapted to the DS population that demonstrates adequate evidence of reliability and validity. This instrument overcomes the limitations of the original KidsLife scale to assess people with DS, and responds to the demands of organizations and families for a specific QoL questionnaire that takes into account the particularities and specific needs of these children and adolescents. Our adapted scale will help prevent the ceiling effect observed in the original KidsLife scale which, although developed for young people with ID (including DS), was designed specifically for those with greater support needs and a more significant level of disability. The new KidsLife-Down scale comprises the same number of items as the original KidsLife scale (Gómez, Alcedo et al., 2016), but the actual pool of items varied by 30% (n = 29). The domains that differed most from the original scale were personal development, interpersonal relationships, and self-determination; the most similar was rights. In fact, several items that were eliminated from the pilot version of the original KidsLife scale in the first round due to insufficient values (CHI < .300) demonstrated some of the highest values (CHI > .600) within their domain in the current scale (e.g., i025 in self-determination or i155 in interpersonal relationships). The KidsLife-Down scale showed good psychometric properties based on the internal structure of the scale, and adequate convergent and discriminant validity in this population. In comparison with the original KidsLife scale, there was a slight decrease in the internal consistency of most of the domains, with the exception of social inclusion and rights, where a slight increase was observed. The reason for this might be the elimination of redundancy and overlaps between items in six of the eight domains. When this occurs, correlations among items decrease and consequently, the internal consistency is affected. In spite of this slight decrease, indexes of internal consistency remained adequate: social inclusion was the most reliable subscale, whereas physical wellbeing showed the lowest internal consistency. In comparison, physical wellbeing was also the least reliable domain in the original KidsLife scale, but the most reliable was personal development. Regarding evidence of validity based on the internal structure of the scale, the eight intercorrelated first-order model showed the best fit to the data, consistent with previous studies based on other versions of the KidsLife (Arias et al., 2018; Gómez, Alcedo et al., 2016; Gómez et al., in press). Concerning convergent validity, as in the original KidsLife scale, the personal development domain (together with social inclusion) stood out particularly, while self-determination obtained the lowest score (rights was the least valid domain in the original scale). Given that the results obtained in the present study were very close to—or higher than—the strictest recommended thresholds, we may conclude that the KidsLife-Down scale constitutes an appropriate operationalization of the construct of QoL in children and youth with DS. However, this study is not free from limitations. First, the recruited group was a convenience sample, so participation was limited to families that signed the informed consent and to the collaborating centers that expressed an interest in the study. It is nonetheless important to note that a large sample from almost all the autonomous communities of Spain was reached despite this being a hard-to-reach population. Second, inter-rater reliability was not assessed, and therefore future research into the new KidsLife-Down should include these measurements. Third, the scale is an informant-report, despite literature highlighting the importance of considering the perspective of people with ID (Murphy et al., 2017; Newton, 2018). Although proxy reports may be convenient when the aim is to assess the efficacy of interventions (Gómez & Verdugo, 2016), future research should focus on the development of a self-report that captures the viewpoints and experiences of the people with DS themselves, helping ensure a better understanding and a more holistic approach to their QoL. Fourth, future research should check if using two different administration methods (i.e., informant-report and interview) may have an impact on the results of the assessment. In conclusion, it is significant that the KidsLife-Down version has been validated exclusively for people with DS. However, in the case of non-verbal people or those with serious associated conditions, such as chronic medical conditions or physical and sensory disabilities, the original KidsLife scale would also be suitable since it was developed for people with ID who have higher support needs. Accordingly, the decision to use one or the other should not rely solely on the diagnosis, but also on the level of functioning and the support needs of the person being evaluated. For this reason, future research efforts must focus on developing computerized adaptive tests, which, based on a person’s characteristics and responses provided, would select the most appropriate items to assess QoL for that person. Until this type of adaptive test is available, the KidsLife-Down scale constitutes a first approach that fills a gap in the research and the applied field of DS. It will help professionals and organizations develop person-centered planning based on current strengths and weaknesses around QoL. It could also be used to develop QoL provider profiles with aggregated data (Gómez, Peña, Arias, & Verdugo, 2016; Gómez, Verdugo, Arias, Navas, & Schalock, 2013; Schalock, Gómez, Verdugo, & Claes, 2017) in order to design, implement, and assess supports, services, resources, and policies intended to enhance personal outcomes for children and youth with DS. Conflict of Interest The authors of this article declare no conflict of interest. Acknowledgments The authors would like to thank the organizations, people with Down syndrome, professionals, and families their involvement and participation in this research. Cite this article as: Gómez, L. E., Verdugo, M. A., Rodríguez, M., Morán, L., Arias, V. B., & Monsalve, A. (2020). Adapting a measure of quality of life to children with Down syndrome for the development of evidence-based interventions. Psychosocial Intervention, 29, 39-48. https://doi.org/10.5093/pi2019a17 Funding: This study has been funded by the Ministry of Economic and Competitiveness of Spain (PSI2012-33139). |
Cite this article as: Gómez, L. E., Verdugo, M. A., Rodríguez, M., Morán, L., Arias, V. B., & Monsalve, A. (2020). Adapting a Measure of Quality of Life to Children with Down Syndrome for the Development of Evidence-based Interventions. Psychosocial Intervention, 29(1), 39 - 48. https://doi.org/10.5093/pi2019a17
gomezlaura@uniovi.es Correspondence: gomezlaura@uniovi.es (L. E. Gómez).Copyright © 2026. Colegio Oficial de la Psicología de Madrid




 e-PUB
e-PUB CrossRef
 JATS
JATS
