
A Tool for Assessing the Quality of Life of Adolescents in Youth Care: Psychometric Properties of the QOLYSS
[Una herramienta de evaluaci├│n de la calidad de vida de los adolescentes que reciben asistencia juvenil: propiedades psicom├ętricas de la escala QOLYSS]
Chris Swerts1, 2, Marco Lombardi2, Laura E. Gómez3, Dries Verlet4, 5, Dries Debeer6, Jessica De Maeyer2, and Wouter Vanderplasschen1
1Ghent University, Department of Special Needs Education, Belgium; 2HOGENT University of Applied Sciences and Arts, Social-Educational Care Work, EQUALITY//Research Collective, Ghent, Belgium; 3University of Oviedo, Department of Psychology, Spain; 4Ghent University, Faculty of Economics and Business Administration, Belgium; 5Statistics Flanders, Brussels, Belgium; 6Ghent University, Faculty of Psychology and Educational Sciences, Research Support Office, Belgium
https://doi.org/10.5093/pi2022a17
Received 25 April 2022, Accepted 5 September 2022
Abstract
Quality of life (QOL) has gained increased interest as a critical pathway to better understanding the lives and circumstances of children and adolescents in both the general population and among specific populations. Yet, QOL assessment among youngsters in youth care services remains a highly under-researched topic. This study examines the suitability and psychometric properties of a new QOL self-report scale for adolescents between 12 and 18 years old in youth care: the Quality of Life in Youth Services Scale (QOLYSS). The provisional version of the QOLYSS was pre-tested in a sample of 28 adolescents in youth care to examine its applicability and feasibility. Next, a comprehensive evaluation of the psychometric properties of the field-test version was conducted in a sample of 271 adolescents in youth care in Flanders, Belgium (M = 15.43, SD = 1.73). Classical item and factor analyses were carried out per subscale, (test-retest) reliability and item-discriminant validity of the subscales were examined, convergent validity was explored, and confirmatory factor analysis was used to examine the goodness-of-fit of different measurement models. Reliability measures of the scale are satisfactory, results are indicative of convergent validity, and confirmatory factor analysis provides evidence for the eight correlated factors model. Future lines of research concerning the ongoing development and application of the QOLYSS are discussed.
Resumen
La calidad de vida (CV) ha despertado un mayor interés como un modo esencial de comprender mejor la vida y circunstancias de niños y adolescentes tanto en población general como específica. No obstante, la evaluación de la CV de los jóvenes en servicios de atención juvenil sigue siendo un tema poco investigado. El presente studio analiza la adecuación y las propiedades psicométricas de una nueva escala de autoinforme de la CV para adolescentes entre los 12 y 18 años de edad en servicios para jóvenes: la Escala de Calidad de Vida en los Servicios Juveniles (QOLYSS, según sus siglas en inglés). Se realizó una prueba piloto con la versión provisional de la QOLYSS con una muestra de 28 adolescentes en servicios de atención a jóvenes para ver en qué medida era aplicable y factible. Luego se llevó a cabo una evaluación general de las propiedades psicométricas de la versión de campo de la prueba con una muestra de 271 adolescentes en servicios de atención a jóvenes en Flandes, Bélgica (M = 15.43, SD = 1.73). Se llevó a cabo un análisis clásico de ítems y análisis factoriales por subescalas, se examinó la fiabilidad (test-retest) y la validez discriminante de los ítems por subescalas, se exploró la validez convergente y se utilizó análisis factorial confirmatorio para analizar el ajuste de diferentes modelos de medida. Las medidas de fiabilidad de la escala son satisfactorias y los resultados son indicativos de validez convergente, a la vez que el análisis factorial confirmatorio muestra un modelo de ocho factores correlacionados. Se discute sobre las futuras líneas de investigación en relación con el desarrollo actual y aplicación de la QOLYSS.
Keywords
Quality of life, Scale, Psychometrics, Youth care, AdolescentsPalabras clave
Calidad de vida, Escala, Picometr├şa, Atenci├│n a la juventud, AdolescentesCite this article as: Swerts, C., Lombardi, M., Gómez, L. E., Verlet, D., Debeer, D., Maeyer, J. D., & Vanderplasschen, W. (2023). A Tool for Assessing the Quality of Life of Adolescents in Youth Care: Psychometric Properties of the QOLYSS. Psychosocial Intervention, 32(1), 21 - 31. https://doi.org/10.5093/pi2022a17
Correspondence: chris.swerts@ugent.be (C. Swerts).Every year, thousands of youngsters and their families are supported by youth care services. In Flanders (the northern part of Belgium), ‘youth care’ is a broad term used to denote a variety of interventions for children and youngsters (and their families) up to the age of 18 years (exceptionally, up to 25 years). In this study, the term ‘youth care’ refers to residential and non-residential services for adolescents between 12 and 18 years of age and their families who are supported by specialized, reactive and protective youth services (e.g., high-intensity home-based support; (therapeutic) residential care, youth detention centers). Youngsters in youth care are considered to be a particularly vulnerable group in society, as they are often confronted with a wide variety of profound challenges in various life domains and are prone to numerous risks or negative outcomes in life (Jozefiak & Kayed, 2015; Stein, 2006; Tausendfreund et al., 2016). If the challenges and needs of these youngsters are not adequately addressed, their probability of experiencing ongoing stressors in life – such as problems in housing, employment, and social relationships – may increase (Häggman-Laitila et al., 2019; Osgood et al., 2010). A major concern is that scholarly work and practice have traditionally adopted a negative problem-focused and risk-oriented lens to understand the lives and circumstances of youngsters (Brendtro & Larson, 2004; Cabrera et al., 2012). However, the field of child well-being and quality of life (QOL) research has consistently argued to expand the focus to broader and more positive aspects to fully comprehend the lives of young people (Ben-Arieh, 2008; Casas, 2016). Over the last few decades, the QOL framework has gained interest as a positive and meaningful approach for working towards a better understanding of the complex and evolving lives of youngsters. It has developed into a critical topic of interest and valued outcome indicator in research and practice in a wide array of educational, healthcare, and social welfare settings (Moons et al., 2006; Schalock & Verdugo, 2002). Still, despite ongoing advances, how to best define and measure QOL remains a subject of debate (Wallander & Koot, 2016). The concept has attracted so much attention from different disciplines that it has overwhelmed the scientific community with a vast and diverse body of definitions and models (Cummins, 2005; Wallander & Koot, 2016). There are, however, several conceptualizing principles regarding QOL that appear frequently within different research areas. Specifically, studies commonly underline the multidimensional, subjective, and dynamic nature of the concept (Taylor et al., 2008; Van Hecke et al., 2018; Wallander & Koot, 2016). These recurring attributes are compatible with several existing QOL definitions, such as the one set out by Schalock et al. (2010, p. 21), which underlies the framework adopted in this study as well: “quality of life is a multidimensional phenomenon composed of core domains influenced by personal characteristics and environmental factors. These core domains are the same for all people, although they may vary individually in relative value and importance. Assessment of QOL domains is based on culturally sensitive indicators.” Following this definition, the associated operational QOL measurement model represents a set of eight universal core domains: personal development, self-determination, interpersonal relations, social inclusion, rights, emotional well-being, physical well-being, and material well-being (Schalock et al., 2016). This multidimensional framework emphasizes QOL’s potential for change over time (Van Hecke et al., 2018). Therefore, it is believed that youngsters’ QOL is dynamic and can be impacted positively through strategies that encompass fostering personal talents, maximizing participation and personal involvement, providing individualized support, and facilitating opportunities for personal growth (Schalock et al., 2016). These considerations make the concept highly relevant to daily professional youth care practice. Although there is a long history of QOL research in adult populations, research focusing on the QOL of children and adolescents, in both general and specific populations, has also made considerable progress in recent decades (Ben-Arieh et al., 2014; Casas, 2016; Tiliouine et al., 2022). An important development contributing to these advances was the children’s rights movement and the impetus from the Convention on the Rights of the Child. This was a tremendous step forward in the way people think about the QOL of youngsters. It promoted a new image of children as engaged social actors that are competent in constructing and directing their own lives (Reynaert et al., 2009). In doing so, children are no longer viewed as being in a temporary state of ‘(well-)becoming’ or as entities on their way to adulthood. Instead, a noticeable shift has underlined youngsters’ right to ‘(well-)being’ in the present and, hence, has increased interest in new child-centered domains of QOL and in the perspective of the child (Ben-Arieh et al., 2014). Alongside these positive developments, researchers have gradually become more aware of additional conceptual and measurement challenges. A comprehensive discussion of these issues is beyond the scope of this article, but it can be found in the review by Wallander and Koot (2016). Yet, three critical challenges are worth nothing. First, a growing body of scholarly work has started to address the critical question of how best to assess the QOL of youngsters so that it accurately reflects their viewpoint on topics that are important to, and valued by them (Vuji et al., 2019). This change of perspective has created ongoing momentum for research to promote and give due weight to the inclusion of youngsters’ voices in understanding their perspectives on all matters that affect them (Casas et al., 2018). Many studies are now driven by the premise that children are capable of providing valid information and deserve to be the primary source of information when trying to understand their QOL (Casas, 2016; Savahl et al., 2015). The number of studies directly involving the perspectives of children and adolescents is growing rapidly (e.g., Carrillo et al., 2021; Fattore & Mason, 2017; González-Carrasco et al., 2019; Hill et al., 2014; Navarro et al., 2017; Parkinson et al., 2011; Savahl et al., 2015; Vuji et al., 2019). However, when delving into the literature on QOL among youngsters in youth care services, it becomes clear that few studies have focused on eliciting the perspectives of these youngsters (Swerts et al., 2019). Overall, the topic of the QOL of these youngsters remains under-researched. This can be a problematic issue, as it is crucial to guarantee that one does not overlook what is important in life to the young people in care themselves (Gómez et al., 2021a; Wallander & Koot, 2016). Second, it is argued that most of the work on child and adolescent QOL assessment stems from a health-related perspective (Casas, 2016; Wallander & Koot, 2016). Assessment instruments based on this functional approach draw attention to only those components affected by a specific health condition and its associated treatment, and on subjective perceptions of functioning and health status (Holte et al., 2014). For instance, commonly included dimensions in health-related QOL assessment among children and adolescents relate to diverse health-related issues: physical activity, body image, emotional status, social functioning, pain, vitality, appetite, family, school, and leisure (Holte et al., 2014; Solans et al., 2008). However, starting from a health-related QOL framework greatly undervalues the role of many other significant (non-health-related) aspects of life (Moons et al., 2006), and such a framework does not adequately represent QOL itself (Wallander & Koot, 2016). In the social sciences, in particular, there are many advocates for a more comprehensive and holistic conception of QOL (Cummins et al., 2004; Gómez et al., 2021b; Gómez et al., 2010; Wallander & Koot, 2016). Third, the global interest in the (HR-)QOL of children and adolescents has resulted in a plethora of generic and specific instruments to evaluate QOL (Koot & Wallander, 2016; Solans et al., 2008). Generic measures generally assess a basic set of domains that can be applied to a wide variety of populations and have merit in circumstances where comparisons between groups are relevant (Ravens-Sieberer, Karow et al., 2014). While being more comprehensive, generic instruments may not be sensitive enough to detect important (treatment-related) changes and may overlook relevant aspects in the lives of people with specific conditions (Danckaerts et al., 2010). This critique spurred the marked proliferation of measures addressing distinct challenges concerning the impact of a specific condition or illness and its associated treatment (Ravens-Sieberer, Karow et al., 2014). We now have dozens of disease-specific scales and modules at our disposal for a wide variety of conditions such as asthma, allergy, cancer, cystic fibrosis, cerebral palsy, diabetes, epilepsy, juvenile arthritis, and so on (for a detailed description, see Solans et al., 2008). The main limitation of these instruments is that they cannot be used outside the population under study (Wallander & Koot, 2018). Deciding which measure to design, adapt, or use is considered to be researcher-dependent (Wallander & Koot, 2016) and depends strongly on the purpose of the research (Solans et al., 2008) and the underlying conceptual and measurement framework (Claes et al., 2010; Davis et al., 2006). Table 1 Socio-demographic Characteristics of Participants in the Pre-Test, Field Test, and Test Re-Test 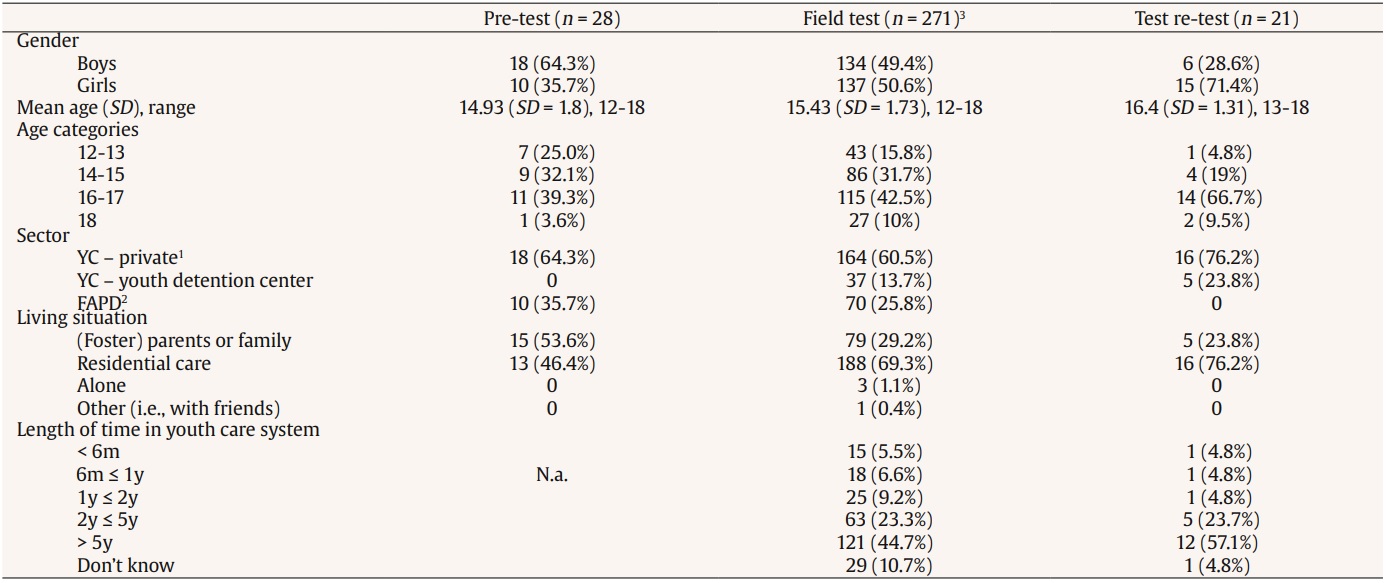 Note. 1Residential and non-residential organizations for Youth Care (YC); 2residential organizations for youngsters with emotional and behavioral disorders within the Flemish Agency for Persons with Disabilities (FAPD); 3analysis were conducted on data from 271 adolescents; nine cases out of 280 were removed because of missing data (see Results section). The previously mentioned eight-domain QOL framework (Schalock & Verdugo, 2002) approaches young people’s lives as a whole – paying attention to the interrelatedness of the various domains – and gives a sense of direction about ways to describe a ‘life of quality’ from their own perspectives. Yet, there is a pressing need to develop and operationalize this framework to youngsters. To the best of our knowledge, only two scales based on this model – i.e., the Personal Outcomes Scale (Claes et al., 2015) and the KidsLife Scale (Gómez et al., 2016) – have been developed for use among adolescents. However, neither scale is deemed appropriate for youngsters in youth care, because they specifically address the QOL of youngsters with specific support needs: namely children and adolescents with intellectual and developmental disabilities. To obtain adequate evaluations of the QOL of youngsters in youth care, there is a need for an instrument that is appropriate to the young people under study. Hence, a new specific scale has been developed for the self-reported evaluation of QOL among youngsters in youth care services: the Quality of Life in Youth Services Scale (QOLYSS). The QOLYSS has been designed as part of a larger practice-oriented research project that focuses on bridging the gap between research and practice when aiming to improve the QOL of adolescents in youth care. Evidence supporting its content validity is provided by meticulously documenting the construction process. The initial version of the scale was developed via a sequential approach, encompassing insights from literature, expert reviewers, and adolescents themselves (for a more detailed description, see Swerts, Gómez et al., 2022). First, an initial item bank was generated following a comprehensive literature search of existing scales for the assessment of QOL among adolescents. To select the most appropriate items and to provide firm content validity evidence, unique items were evaluated against results from previous qualitative studies among adolescents in youth care. Second, the item pool was reviewed by a panel of international experts to provide evidence on domain representation and relevance. The experts were asked to align the items to the eight-domain framework. After three consecutive rounds, agreement was reached on the classification of 262 items. Third, qualitative data regarding the content of the scale was collected by means of focus groups and interviews among 21 adolescents in youth care. The youngsters were asked to critically review and evaluate all items regarding relevance, importance, clarity, and comprehensiveness. This process resulted in an initial field test version of the scale comprising 88 items (Swerts, Gómez et al., 2022). The aim of this paper is to provide further evidence on the suitability, validity, and reliability of the QOLYSS among adolescents in youth care. More specifically, the applicability and feasibility of the provisional version of the scale is examined in a small-scale pre-test. Next, the psychometric properties of the field test version of the QOLYSS are evaluated in a broad sample of adolescents in youth care in Flanders. Participants Two independent groups of adolescents in youth care in Flanders, the northern part of Belgium, participated in this study. For the pre-test, a purposive sample (n = 28) was recruited from seven organizations and for the field test, a purposive sample (n = 280) was recruited from 24 organizations. From the field test sample, 21 youngsters also participated in the test-retest study. Table 1 shows the socio-demographic characteristics of the three samples. To be eligible to participate in the field test, the youngsters had to meet the following three criteria: (I) receive home-based, residential or ambulatory support; (II) be between 12 and 18 years old; and (III) have sufficient knowledge of Dutch. The sample selection for the pre-test study relied on the same criteria but also on additional demographic features (i.e., age and gender) to ensure a ‘large enough variety’ of youngsters to cover a wide range of possible reactions and interpretations (Willis, 2016). A collaboration was set up with organizations from two main sectors providing youth care: (I) the ‘Youth Care (YC)’ sector focuses on youngsters and families in worrisome living situations (private organizations) and youngsters who have committed offences (youth detention centers) and (II) the sector of the ‘Flemish Agency for Persons with Disabilities (FAPD)’ provides support to youngsters (and their families) with special needs (e.g., behavioral, cognitive, physical). The reasons why youngsters are placed in youth care services are thus manifold, and often interwoven (Khoo et al., 2012; Tausendfreund et al., 2016) – they include: problems in the home environment (e.g., troubled child-parent relationship, maltreatment), youth behavior labeled as problematic (e.g., truancy, violence, delinquency), or circumstances that require specialized support (e.g., emotional and behavioral problems). Although these situations are frequently portrayed as individual problems, the root causes are often intertwined with (structural) problems in society (Swerts, van Wolvelaer et al., 2022), such as a lack of financial and material resources, poor housing, work-related problems (e.g., long hours), and so on (Roose et al., 2014). In the former sector, we collaborated with residential and non-residential services. In the latter sector, we specifically collaborated with (therapeutic) residential organizations that provide support to youngsters with emotional and behavioral disorders (EBD). Previous studies (e.g., D’Oosterlinck et al., 2006; Swerts et al., 2019; Vander Laenen et al., 2009) have shown that it is common (> 30%) for youngsters with EBD to have three or more DSM diagnoses belonging to, amongst others, the classifications of disruptive, impulse-control and conduct disorders, neurodevelopmental disorders, depressive disorders, anxiety disorders, trauma- and stressor-related disorders. Procedure of the Pre-test Study A sequential approach comprising three perspectives was adopted to examine the applicability and feasibility of the scale. First, a technical approach to readability showed an average Flesch Reading Ease score of 64.76 and a Flesch-Douma score of 77.46, indicating that the scale appears to be appropriate for use among children 12 or 13 years old and older (De Cock, & Hautekiet, 2012; Grootens-Wiegers et al., 2015). Second, ‘real life’ readability and comprehensibility of the scale were evaluated by an expert (Fry, 2005): a speech therapist with considerable expertise in reading proficiency in youth and with in-depth clinical experience in working with children and adolescents with intellectual and developmental disabilities. Based on his feedback, 19 items were modified: changes were made to specific verbs (n = 5), sentence constructions (n = 6), adjectives (n = 1), and words that were considered too difficult (n = 7). Third, the revised items were pre-tested from the perspectives of youngsters in youth care. The pre-test was carried out by the principal investigator, the supervisor, and five master’s students in Educational Sciences (subject: Special Needs Education). The students received an intensive training on the concept of adolescent QOL, the QOLYSS, and appropriate interview techniques for youth. The youngsters involved were encouraged to voice their opinion aloud for every item they did not understand or found confusing, complex, difficult, or strange while completing the scale. Additionally, they were asked to share general thoughts about the content of the scale, the wording and sentences in general, the answer options, and their overall impression of the scale. Based on their feedback, a number of changes were made. The titles of QOL domains (e.g., emotional well-being, social inclusion) were simplified and six items received different wording or clarifying examples. Moreover, two items were eliminated: one in the domain rights (“I have a key to the place I live”), because it was considered inappropriate to be rated with the associated response scale; and one in the physical well-being domain (“I am satisfied with my physical health”), because of clear content-overlap with the domain-specific satisfaction item. An additional item (“I am able to cope with pain or discomfort”) was relocated from the domain emotional well-being to physical well-being, because all respondents associated this item with physical issues. No significant difficulties were reported regarding the response options. The pre-test process modified the initial 88-item QOLYSS to a final field test version containing 86 unique items classified in the eight domain QOL model by Schalock and Verdugo (2002): personal development (10 items), self-determination (10 items), social inclusion (11 items), rights (13 items), interpersonal relations (11 items), emotional well-being (11 items), material well-being (11 items), and physical well-being (9 items). Each item is written in the first-person and is rated on a 6-point agreement scale (1 = completely disagree, 2 = mostly disagree, 3 = somewhat disagree 4 = somewhat agree, 5 = mostly agree, 6 = completely agree). The QOLYSS also contains an additional item on overall life satisfaction (“Overall, how satisfied are you with your life as a whole?”) and asks respondents to rate the level of (domain-specific) satisfaction and importance for each of the eight domains (e.g., “How satisfied are you with how you feel emotionally?”; “How important is it to you to feel emotionally well?”). The satisfaction and importance items are rated on a 6-point satisfaction scale (1 = completely dissatisfied to 6 = completely satisfied) and a 6-point importance scale (1 = not important at all to 6 = very important), respectively. Procedure of the Field Test Study The aim of the large-scale field test was to investigate the psychometric properties of the QOLYSS. An electronic version of the scale was developed using Qualtrics XM (www.qualtrics.com) and administered via tablet. Youngsters residing in a youth detention center completed a pen-and-paper version of the QOLYSS because data collection via tablet was not allowed due to institutional regulations. Field test data were collected by the principal investigator and the supervisor of the project, using the same administration technique as in the pre-test study. The process started with providing introductory information on the research project, including ethical aspects of the research (e.g., the right to refrain from participation at any moment without explanation, the confidentiality of the study, the right to not answer certain questions). The youngsters were then presented with general information about the instrument, such as the structure of the scale and associated answering format. It was mentioned that items and their response scale would be presented on the tablet one-by-one, and that they could visually track their progress via an indicator-bar. It was also highlighted that each question needed to be answered before being able to move on to the next one, and that a reminder would pop up if they left a question blank. The reason for this was to control for unintentionally leaving items blank or accidently clicking to the next page. Respondents could, however, choose the additional option ‘I don’t know’ when they did not want to respond or when they were unable to think of an answer. Before administering the QOLYSS, the youngsters were ensured they could take as much time as they needed to respond to all questions. On average, it took them 20.43 min (SD = 9.32, range 5.1 to 51.53 min) to complete the QOLYSS. The study protocol was approved by the Ethics Committee of the Faculty of Psychology and Educational Sciences at Ghent University, in accordance with internationally accepted criteria for research (2015/78). Potential participants received oral and written information about the study at the moment of the pre-test and the field test, and written informed consent was obtained from all participants prior to any data collection. Support staff informed the respondents’ parents or guardians about the study, and none of them refused participation. As a compensation for participating in the study, the adolescents received a voucher worth €10 for use at a local store . Data Analysis Descriptive statistics were calculated using the Statistical Package for the Social Sciences 25 (SPSS 25) and R (R core team, 2021). Exploratory factor analysis (EFA) was performed using the R-package psych (Revelle, 2021). As the focus of this study was on validating the 86-item domain-specific QOL measure, the additional subjective measures on global and domain-specific life satisfaction and domain-specific importance were not included in the data analysis. First, we examined the distribution of responses for extreme data trends (e.g., excessively answering with the minimum or maximum value) and missing data on case level. Nine cases were removed because they showed a high percentage of missing data (> 30%), often combined with extreme scores (outliers) in 1 to 3 domains. This resulted in a final sample of 271 unique adolescents between 12 and 18 years old (M = 15.43, SD = 1.73) from which data were used for further item analysis. Psychometric properties of the 86-item scale were analyzed to identify the most appropriate and robust QOL items with good content. First, items with high levels of missing values (>10%) were closely examined to make an informed decision on possibly removing them. Second, the distribution of scores was examined for floor and ceiling effects. If more than 15% of the respondents had the lowest or highest possible score on a subscale, floor and ceiling effects were considered to be present (Terwee et al., 2007). Third, following the recommendations by Streiner et al. (2015), items were considered for removal if they demonstrated corrected item-total correlation values below a cut-off of < .300. Reliability was then estimated by calculating Cronbach’s alpha. Because this estimate has been criticized when used with ordinal data (Gaderman et al., 2012), ordinal alpha is used in this study as an additional reliability index. Test-retest reliability was calculated by computing correlations for all eight subscale scores and the total score between two admissions. Finally, the initial factor structure and associated sets of items were examined through preliminary EFA per subscale. Because the cases-to-variables ratio was less than 1:5 in this study, the suitability of the data for factor analysis was tested via the Kaiser-Meyer-Olkin (KMO) measure of sampling adequacy (Hair et al., 1995; Tabachnik & Fidell, 2019). KMO values for all subscales ranged from .825 to .920, which are considered meritorious (> .80) to marvelous (> .90; Kaiser, 1974). Visual inspections of the item response distributions indicated a negative skew in almost all items. This is in line with previous studies finding negatively skewed non-normal distributions for QOL data (Cummins & Gullone, 2000; Fayer & Machin, 2007). The EFA was based on polychoric correlations, which treat the 6-point response scales as ordinal and thereby also considers the skewedness of the response distributions. Missing responses were treated as missing at random (MAR) when estimating the polychoric correlations, implying that all the available data were used. To investigate the observed number of factors in EFA, eigenvalues greater than 1 were considered, as well as visual inspections of scree plots, which present the explained variance based on both PA and PCA. To better understand the scale’s dimensions – and, in particular, to examine how ‘clean’ the structure is – the next step focused on searching for potentially problematic items based on the item-loading tables. This involved a stepwise process in which the magnitude of item-factor loadings (preferred loading of ≥ .40; Costello & Osborn, 2005) and communalities (preferred value of < .20; Child, 2006) were investigated. Items that did not meet the specified criteria were removed one-by-one and EFA was re-run after each removal, until a ‘clean’ and satisfactory solution was reached. Last, confirmatory factor analysis (CFA) was carried out to provide evidence for construct validity, specifically on the dimensionality and internal structure of the QOLYSS (Bandalos & Finney, 2018). It was used to evaluate the goodness-of-fit of three a priori specified measurement models to the data: a unidimensional model in which QOL consists of one global domain (model 1); an orthogonal eight-factor model (i.e., factors assumed to be uncorrelated; model 2); and an eight-factor model without constraints on the correlations as proposed by Schalock and Verdugo (2003) (model 3). The CFA models were fit via full-information item factor analysis using the Metropolis-Hastings Robbins-Monro algorithm (Cai, 2010), as implemented in the multidimensional item response theory (mirt) package for R (Chalmers, 2012). The three a priori specified measurement models were first compared in order to select the model that best fits the available data. To do so, the following comparative measures of fit were explored: Akaike information criterion (AIC) and Bayesian information criterion (BIC). Lower values of the AIC and BIC indicate a better fit (Burnham & Anderson, 2004). Actual model fit was assessed by exploring the absolute fit index root mean square error of approximation (RMSEA), and the incremental fit indices, comparative fit index (CFI) and Tucker-Lewis index (TLI). To evaluate these indices, the criteria by Hu and Bentler (1999) were used: RMSEA with a value below .06, and CFI and TLI with values above .95 indicate a good fit. It should be noted that incremental fit indices (i.e., CFI and TLI) come with a caveat. More specifically, these indices compare a specified model to a baseline or null model. When the RMSEA value of the baseline model already reveals reasonable fit (RMSEA smaller than .158), CFI and TLI are unlikely to exceed the value of .90 and are subsequently considered to be uninformative or unreliable measures for model fit (Kenny, 2015; Rigdon, 1996). Classical Item and Factor Analysis The objective of item analysis is to end up with a manageable set of items for each of the eight domains and to select the most robust and reliable items that also reflect good content coverage. To do so, a sequence of steps is used. The first step to potentially eliminate items was to thoroughly analyze the item non-response. On the domain level, the highest mean for missing values was found in the domain social inclusion (4.55%) and the lowest in physical well-being (1.04%). On the item level, three items had more than 10% missing values: i85 (10.3% missing; “I receive help from my neighbors”; domain: social inclusion), i82 (11.4% missing; “I have responsibilities in a club, team or group”; domain: social inclusion), and i39 (22.9% missing; “I am satisfied with my sex life”; domain: emotional well-being). The latter two items were dropped from ongoing analyses. Moreover, items with high mean observed scores were scrutinized and two additional items were omitted from the scale: i16 (“I am planning on looking for a job or developing a career”; domain: personal development) and i63; “I have access to technology to communicate with other people”; domain: rights). Moreover, no floor or ceiling effects were found in any subscale. While no respondents were identified with the lowest possible score, the proportion of respondents with the highest possible score ranged from .01 (interpersonal relations) to .07 (self-determination). Next, classical item analysis methods and factor analysis were used to ensure reliable and valid measurements per subscale. First, eigenvalues and scree plots were examined to investigate the observed number of factors. In this study, scree plots for each of the eight domains revealed an obvious drop in the plotted values at factor/component two (see Figure 1). A flattening point at the second factor/component and eigenvalues of the second factor smaller than 1 support the claim that each subscale can be used to measure one dominant latent variable (Furr & Bacharach, 2008). Figure 1 Scree Plots for the Eight Quality of Life Domains. 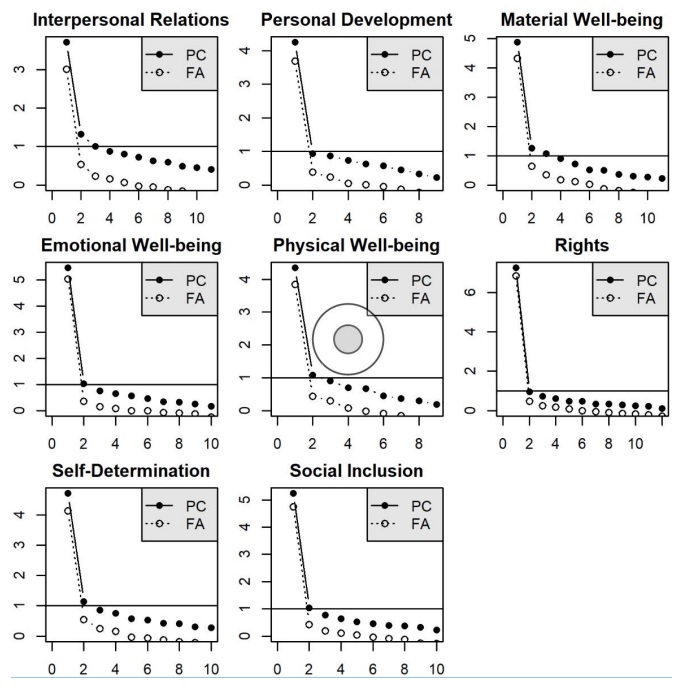 Second, corrected item-total correlations for the individual items were calculated. These values ranged from .122 (i23,“I’m worried about having debts”; domain: material well-being) to .822 (i44, “I feel good about myself”; domain: emotional well-being). The lowest mean item-total value was found in the interpersonal relations domain (M = .457) and the highest in the rights domain (M = .713). Items were considered for removal if they had correlation values below the cut-off of .300. Only one item did not meet this criterion: i23 demonstrated a value of .122 and was deleted from the scale. Third, item-factor loadings based on the EFA were examined. Using principal axis, items loading lower than .40 were identified and deleted one-by-one. This resulted in the removal of 3 additional items across two domains: i3 (“My friends consider me to be someone they can count on”; domain: interpersonal relations), i11 (“I act responsibly towards others”; domain: interpersonal relations), and i35 (“I feel comfortable when I am alone”; domain: emotional well-being). This item reduction process resulted in a scale containing 78 unique items across eight domains, with nine to twelve items per domain (Table 2). For the final structure of the QOLYSS, highest means loadings (Table 3) were observed in the rights domain (M = .751) and the lowest in the interpersonal relations domain (M = .545). Individual item loading values ranged from .409 (“I get along with other students at school”; domain: interpersonal relations) to .896 (“I feel good about myself”; domain: emotional well-being). Table 2 Overview of Item Elimination After Field-Testing the QOLYSS 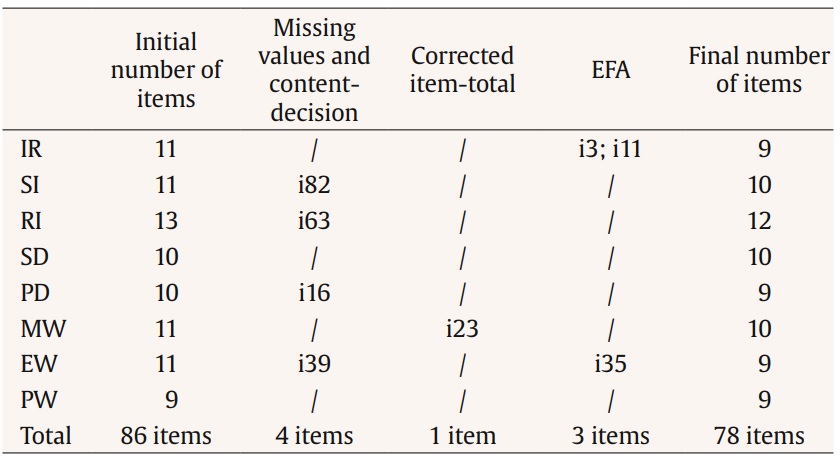 Note. IR = interpersonal relations; SI = social inclusion; RI = rights; SD = self-determination; PD = personal development; MW = material well-being; EW = emotional well-being; PW = physical well-being. Table 3 Final Results From Dimension Reduction via EFA 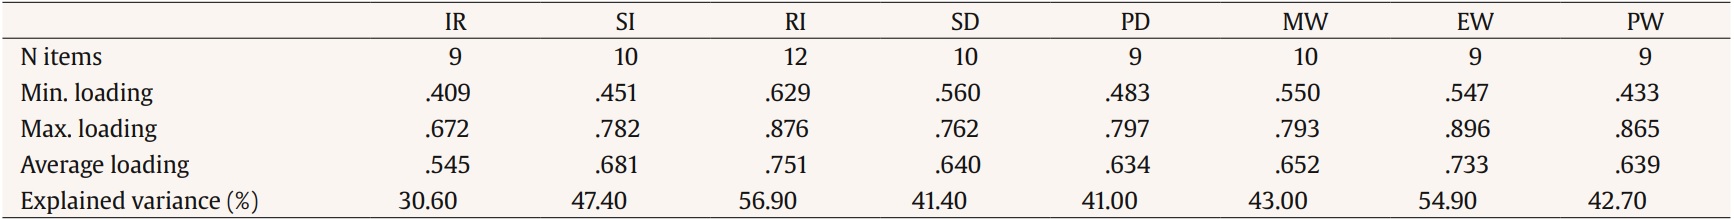 Note. IR = Interpersonal relations; SI = Social inclusion; RI = Rights; SD = Self-determination; PD = Personal development; MW = Material well-being; EW = Emotional well-being; PW = Physical well-being. Construct Validity Internal Structure (CFA) Table 4 presents the comparative measures of fit of the three a priori specified measurement models. Results show that the eight-factor model without constraints in correlations (model 3) provides the best fit to the data. Table 4 Comparative Measures of Fit of the Three Measurement Models  Because AIC and BIC are only of value in comparing models, the actual fit of the correlated eight-factor model was further examined by exploring the absolute and incremental fit indices RMSEA, CFI and TLI. To do so, the null model was first tested in order to investigate the usefulness of the incremental fit indices. For the data in this study, the RMSEA of the baseline model was .146, making it unlikely to reach CFI and TLI values of above .90, and subsequently, making it not informative to rely on these indices. The correlated eight-factor model based on full cases (n = 134) revealed the following fit properties: RMSEA = .060, 90% confidence interval [.056, .064]; CFI = .834; TLI = .826. The RMSEA indicates a good fit, but – as expected – the incremental fit indices failed to reach the accepted threshold of .95 (Hu & Bentler, 1999). Convergent Validity To evaluate convergent validity, the correlations between subscales are considered. Table 5 provides the estimated model-based inter-scale correlations based on model 3. Table 5 Estimated Correlations Between the Factors  Note. IR = interpersonal relations; SI = social inclusion; RI = rights; SD = self-determination; PD = personal development; MW = material well-being; EW = emotional well-being; PW = physical well-being. Because scale scores rather than factor scores are used in daily practice, the correlations between the estimated factor scores and the scale scores (i.e., average score per subscale) are first examined. The correlations between factor scores and scale score per subscale are all well above .75, with the lowest value found in the personal development domain (.864) and the highest in the rights domain (.940). Second, the observed correlations between subscales are investigated in addition to correlations between factor scores. The findings (Table 6) reveal that all eight subscales are positively correlated with all other subscales, but vary in magnitude. The highest observed correlation is found between the physical well-being subscale and the emotional well-being subscale (r = .794); the lowest between the social inclusion and material well-being subscales (r = .446). Table 6 Observed Correlations (Triangle Below Diagonal) and For Attenuation Corrected Correlations (Triangle Above Diagonal) of the Scale Scores on the Eight Domains, and Cronbach’s Alpha (Diagonal) 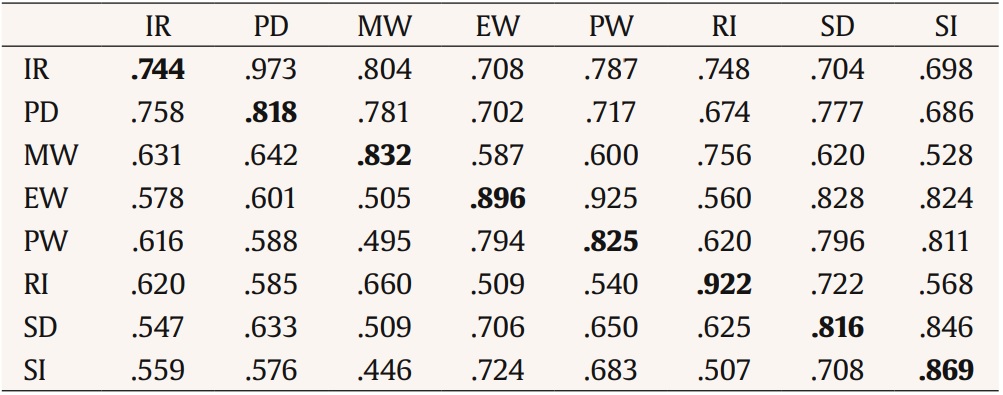 Note. IR = interpersonal relations; SI = social inclusion; RI = rights; SD = self-determination; PD = personal development; MW = material well-being; EW = emotional well-being; PW = physical well-being. Reliability Internal Consistency The Cronbach’s alpha and ordinal alpha of the field test and the final version are presented in Table 7. All subscales of the final scale showed good to excellent reliability (> .80 or > .90), except for the interpersonal relationships domain which had an acceptable value (α = .744, ordinal α = .791) Table 7 Comparison of Internal Consistency (Cronbach’s Alpha and Ordinal Alpha) of the Field Test Version and the Final Version of the QOLYSS 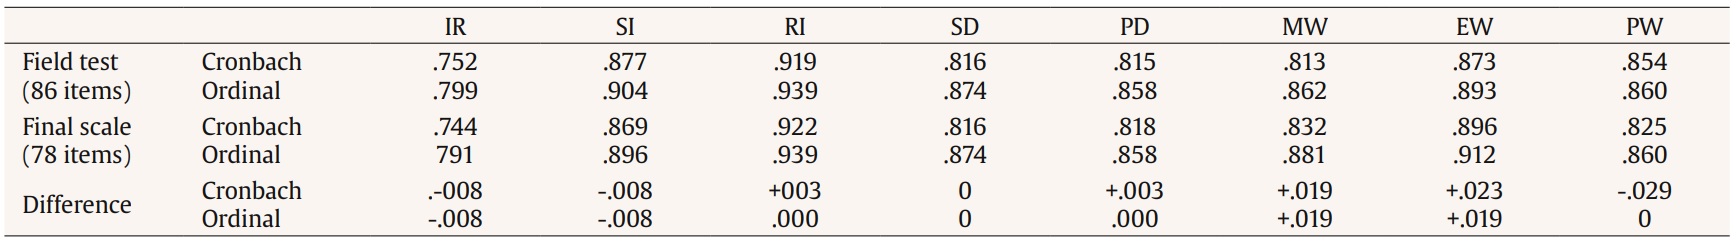 Note. IR = Interpersonal relations; SI = Social inclusion; RI = Rights; SD = Self-determination; PD = Personal development; MW = Material well-being; EW = Emotional well-being; PW = Physical well-being. Furthermore, correlations between each of the 78 items and the eight scale scores were computed to explore item-discriminant validity. Higher correlations are expected between items and their associated subscale than with other subscales. The results demonstrate that this criterion is met for 75 items (96.15%). Only three items have a slightly higher observed correlation with another scale: PW_i51 (“I can go to a doctor if I need to”) has a value of .45 for its associated physical well-being domain and .59 for the rights domain; SI_i84 (“Other people ask me for help or advice”) has a value of .47 for its associated social inclusion domain and .50 for the self-determination domain; and SD_i75 (“My needs, wishes and preferences are taken into account in the supports I receive”) has a value of .62 for its associated self-determination domain and .65 for the rights domain. Test-Retest Reliability Test-retest reliability was estimated for the eight subscale scores and the total score between two administrations (n = 21). The interval between administrations ranged from 16 to 29 days. Results show excellent test-retest reliability for the total score (.908) and acceptable to good reliability for the eight subscales: interpersonal relations (.798), personal development (.817), material well-being (.691), emotional well-being (.868), physical well-being (.849), rights (.760), self-determination (.809), and social inclusion (.816). The present study examined the suitability and psychometric properties of the QOLYSS in a sample of 271 adolescents in youth care in Flanders and provides evidence for its reliability and validity. Item analysis procedures and factor analyses reduced the QOLYSS from an 86-item field test to a final 78-item version (9.3% of the items omitted). Various statistical procedures have been used to guide the selection of items, while always considering the content of individual items. As shown in the results section, evidence of strong reliability of the QOLYSS was provided. All associated estimates exceeded the recommended threshold values (Gaderman et al., 2012), except for the test-retest value of the material well-being domain which closely approached the threshold (.691). Item-discriminant analysis further revealed no floor or ceiling effect, which is favorable for the potential longitudinal or evaluative validity of the QOLYSS (Terwee et al., 2007). Analyses also showed high correlations between the different subscales of the QOLYSS. This was especially the case between the two well-being subscales (emotional and physical), and between interpersonal relations and personal development. When two subscales have a strong relationship, the issue of amalgamation of scales may arise. However, strong correlation does not necessarily imply that subscales actually measure the same. Combining scales could compromise the face validity of the instrument (Fayer & Machin, 2007). Multidimensional scales, such as the QOLYSS, are in fact designed to measure the same overarching construct (i.e., QOL) – thus, higher correlations are expected and can be considered indicative for convergent validity. Still, future research should investigate the convergent validity of the QOLYSS further, by comparing the subscales of the QOLYSS with subscales in other well-established instruments that are intended to measure related constructs (Fayer & Machin, 2007). This would provide more and stronger evidence of the construct validity of the QOLYSS. A noteworthy finding from the analyses was that the eight-intercorrelated-factor model (Schalock & Verdugo, 2002) had the best fit to the data, which is consistent with previous studies on QOL scale development that adopt the same measurement framework (Gómez et al., 2016; Gómez et al., 2020; Verdugo et al., 2014). Although more research is recommended, this finding provides evidence for the multidimensional character of QOL, and it also supports the notion that the adopted model may be a promising way to capture the concept of QOL in a broad array of youth services. The model adopted in the QOLYSS reflects a clear and sound theoretical and methodological framework (Claes et al., 2010) that aligns with Wallander and Koot’s (2016) recommendation to focus on a fundamental composition of QOL that is shared across people. Though the number and naming of domains may differ, the eight QOL domains resonate well with other QOL and subjective well-being frameworks adopted in scholarly work with children and adolescents (e.g., Cummins & Lau, 2005; Ravens-Sieberer, Herdman, et al., 2014; The Children’s Society, 2021; Wood & Selwyn, 2017). The model adopted in this study has the strength of upholding a non-health-related and comprehensive lens to grasp critical components of life. In doing so, it also covers issues that are not always identified points of interest in QOL research among youngsters. When talking about QOL models, one immediately wonders how to best operationalize the concept for adolescents in youth care. In this respect, it has been previously argued that the concerns of youngsters in care situations are not always adequately addressed in measures for the general population (Wood & Selwyn, 2017). The study by Selwyn et al. (2017) explored the components that looked-after youngsters in England deemed important to their well-being and whether these were similar to children in the general population. They concluded that a number of domains were in fact common to the two groups, which is in line with other qualitative QOL research among adolescents in youth care (Swerts et al., 2019). However, previous research has also reinforced the idea that the distinctive context of youngsters in youth care brings forth particular challenges and experiences that should be taken into account (Quarmby et al., 2019). Selwyn et al. (2017) found that looked-after youngsters identify other significant components in life and place a different emphasis in shared domains. For instance, the rights domain was viewed as a critical shared building block of well-being for all youngsters, referring to elements such as ‘the importance of being listened to’ or ‘having choices in life’. However, looked-after youngsters appeared to place greater emphasis on specific issues such as ‘having a say’ and being able to participate in important decisions when compared with youth in the general population. Discussing how to best conceptualize the concept of QOL goes hand-in-hand with the topic of how to go about measuring QOL (generic versus specific), which has been an area of debate for many years (Wallander & Koot, 2016). We know that the way QOL assessment is developed and applied depends highly on the underlying purpose of the work (Solans et al., 2008). The QOLYSS has been designed as a population-specific instrument, tailored to meet the characteristics of adolescents in youth care. While it includes a lot of generic components relevant to all youngsters, it also covers areas that are probably of lesser concern to youth in the general population (e.g., having wishes and preferences taken into consideration in support provision, having people around them advocating for their rights, being informed properly about decisions taken for them, getting a second chance after making a mistake, and so on.). The primary goal of this work, however, was to develop an instrument that was properly adapted to the concerns, needs, and challenges experienced by youngsters in youth care. In this light, we view QOL assessment not merely for its merit for research purposes (Schalock et al., 2018), but also for its advantages in developing and implementing person-centered actions addressing QOL enhancement in daily practice (Alborz, 2017). However, we do acknowledge that pursuing the notion of comparability can also be highly relevant to social policy-making and practice. Comparing the QOL of youngsters in youth care with the QOL of those in the general population has the potential of pinpointing and better understanding critical QOL determinants and protective factors (Llosada-Gistau et al., 2019), which places organizations and policy-makers in a better position to drive change and create opportunities to enhance the lives of youngsters in care. Moreover, studies have previously emphasized that these youngsters’ future opportunities may be limited compared to the general youth population (Lou et al., 2018). Yet, not every youngster in youth care will end up living permanently in difficult circumstances (Tausendfreund et al., 2016). Comparative research may help to uncover positive trends. As such, it may have the power to make a substantial contribution to overcoming the persistent belief that youngsters in youth care are inherently and inevitably vulnerable or worse-off than other youth (Llosada-Gistau et al., 2019; Swerts, van Wolvelaer et al., 2022). Consequently, investigating ways to use the scale in the broader population could be a valuable path to pursue in future research. One of the most critical guiding principles in QOL assessment is the involvement of children and adolescents in both the development and the use of the measures (Wallander & Koot, 2016). The development of the QOLYSS is characterized by a strong collaboration with adolescents in youth care (Swerts, Gómez et al., 2022). Starting from the lived experiences of youngsters, and placing them at the heart of decision-making processes, is also a critical element of relational youth care (Munford, 2022; Naert, 2019). However, this process is not self-evident, as these youngsters have often been denied a meaningful voice in the development and planning of services (Polvere, 2014; ten Brummelaar et al., 2018). In line with the recommendation of UNICEF (2016), this study is grounded in the belief that youngsters are best placed to provide insight, critically discuss, and decide upon what needs to be part of a new tool that inquires into their own lives. In doing so, the voices of youngsters are perceived as a significant change agent (Fattore et al., 2016). That being said, we also recognize the added value of information retrieved from collateral sources such as parents or professional caregivers. Although these perspectives can never be taken as a valid substitute for youngsters’ own perspectives (Casas, 2016), obtaining their viewpoints can yield additional information. For example, this approach may uncover significant discrepancies in evaluations, which can be used to further open the dialogue between adolescents and parents about critical issues in youngsters’ lives (Davis et al., 2013). Limitations Some limitations of the study should be taken into consideration when interpreting the results. First, youth participation was contingent on organizations agreeing to participate in the study. Though a fairly high number of youngsters were involved, this purposive sampling procedure limits the generalizability of the findings. This study focused on youngsters involved in the more specific and protective youth care services, although youth care is known to span a wider array of interventions (Roose et al., 2014). Second, more adolescents from residential settings than home-based services participated in the study. Although the focus on youth care has a clear advantage in terms of sensitivity to changes through support interventions (Schalock et al., 2018), more research is needed to investigate whether the content and satisfactory psychometric properties also hold in the broader group of adolescents involved in youth care (e.g., low-threshold preventive services, kinship care, foster care) and in the general population. Third, analyses on construct validity might have been affected by substantially lower sample sizes due to missing values. These analyses should be repeated in other larger datasets to provide further evidence for the eight-correlated domain model. Fourth, due to the cross-sectional design of the study, no information could be presented on the scale’s responsiveness, a measure of longitudinal or evaluative validity. Future research should examine the QOLYSS’s ability to capture changes over time, which should coincide with examining the interpretability or what constitutes meaningful change (Terwee et al., 2007), with particular attention to the viewpoint of the respondents involved. Finally, despite the availability and testing of a multitude of scales in the field of social and behavioral sciences, what is considered an adequate sample size for pre-testing a new scale remains unclear (Beatty & Willis, 2007). Instead of trying to achieve a ‘large enough sample’ in terms of numerical totals, we followed Willis’ (2016) suggestion to aim for heterogeneity. While we managed to ensure variation in terms of gender, age, and living situation, we did not collect information on the respondents’ levels of understanding and communication. For future research, it is recommended to identify and overcome potential problems in applying the QOLYSS among youngsters with more complex language and communication needs. Conclusion Adhering to contemporary QOL scale development guidelines (Claes et al., 2010), a comprehensive and methodologically sound instrument, with satisfactory validity and reliability evidence, was designed. The development of the QOLYSS is a step forward in increasing our knowledge of, and insight into, the QOL of adolescents in youth care services. This is one way to give voice to youngsters on critical matters that influence their lives, to better understand their lives and circumstances, and to further develop support with a clear focus on enhancing their QOL. The scale can be used for descriptive research to obtain insight into how adolescents in youth care evaluate their QOL and to identify potential QOL determinants for this population. It can also be applied as a practical tool to assess the QOL of youngsters in youth care settings, as it can be used to create an open dialogue with youngsters and make more well-informed and shared decisions on priorities in providing daily support. Conflict of Interest The authors of this article declare no conflict of interest. Acknowledgements The authors would like to thank all youngsters for their participation in this study and (members of) the organizations for their commitment. Funding: C.S. is the recipient of a Special PhD Fellowship from the Flemish Fund for Scientific Research (FWO-Vlaanderen), project number: 1900722N. Cite this article as: Swerts, C., Lombardi, M., Gómez, L. E., Verlet, D., Debeer, D., De Maeyer, J., & Vanderplasschen, W. (2023). A tool for assessing the quality of life of adolescents in youth care: Psychometric properties of the QOLYSS. Psychosocial Intervention. Psychosocial Intervention, 32(1), 21-31. https://doi.org/10.5093/pi2022a17 |
Cite this article as: Swerts, C., Lombardi, M., Gómez, L. E., Verlet, D., Debeer, D., Maeyer, J. D., & Vanderplasschen, W. (2023). A Tool for Assessing the Quality of Life of Adolescents in Youth Care: Psychometric Properties of the QOLYSS. Psychosocial Intervention, 32(1), 21 - 31. https://doi.org/10.5093/pi2022a17
Correspondence: chris.swerts@ugent.be (C. Swerts).Copyright © 2026. Colegio Oficial de la Psicología de Madrid


 PDF
PDF e-PUB
e-PUB CrossRef
 JATS
JATS Print
Print Send
Send