Children’s Pictorial Representation of Their Interactions with Teachers
[Las representaciones gráficas de los niños sobre su interacción con los maestros]
Anna S. Bombi, Eleonora Cannoni, Francesco Gallì, and Anna Di Norcia
Sapienza University of Rome, Italy
https://doi.org/10.5093/psed2020a14
Received 14 October 2019, Accepted 10 May 2020
Abstract
In this article we use children’s drawings to discover which pupil-teacher interactions are represented as positive or negative by boys and girls of different school grades. We also explore whether there is a correspondence between these representations and teachers’ evaluation of the relationship with their pupils. Participants were 245 primary school pupils (from 2nd to 5th grade, 7-11 years of age) and their teachers. Each child did two drawings (P and N, positive and negative situations) of him/herself with their teacher. Teachers compiled the Italian version of the Student-Teacher Relationship Scale (STRS). The four categories identified in the drawings were subjected to non-parametric tests. Scores in the STRS were subjected to analyses of variance, in which the independent variables were the drawings categories. The results confirm the usefulness of drawing to access the point of view of pupils about their interactions with teachers, and demonstrate some convergence with teachers’ point of view.
Resumen
En este artículo se utilizaron dibujos de niños para descubrir qué interacción alumno-maestro se representa como positiva o negativa por niños y niñas de diferentes niveles educativos. Además, exploramos si existía correspondencia entre las representaciones gráficas de los alumnos y la evaluación realizada por los profesores de su relación con los alumnos. Los participantes fueron 245 alumnos de primaria (2º a 5º de primaria, 7-11 años) y sus maestros. Cada niño elaboró dos dibujos (P y N, situación positiva y negativa) de él o ella con su maestro. Los profesores compilaron la versión italiana de la Student-Teacher Relationship Scale (STRS). Las cuatro categorías identificadas en los dibujos fueron analizadas con pruebas no paramétricas. Los resultados del STRS se sometieron a un análisis de varianza en el cual las variables independientes eran las categorías de los dibujos. Los resultados de este estudio confirman la utilidad de los dibujos para entender el punto de vista de los alumnos sobre su interacción con el maestro, demostrando, a su vez, la confluencia de las representaciones gráficas de los niños con el punto de vista de los profesores.
Palabras clave
InteracciĂłn alumno-maestro, Escuela primaria, DibujoKeywords
Student-teacher relationship, Primary school, DrawingCite this article as: Bombi, A. S., Cannoni, E., Gallì, F., & Norcia, A. D. (2020). Children’s Pictorial Representation of Their Interactions with Teachers. PsicologĂa Educativa, 27(1), 13 - 20. https://doi.org/10.5093/psed2020a14
anna.dinorcia@uniroma1.it Correspondence: anna.dinorcia@uniroma1.it (A. Di Norcia).In this paper we analyze children’s thematic drawings as a way for pupils to represent their positive and negative interactions with primary school teachers. We want to determine whether these representations differ according to children’s gender and school grade, and if they correspond in any way to the teachers’ evaluations of their relationship with each student. Drawing is a convenient method for exploring young students’ ideas on these matters. In fact, besides their well-known use as an assessment tool in clinical settings (see Oster & Gould Crone, 2004 for an overview) children’s drawings have been shown to be reliable sources of information about a variety of topics, such as stereotypes (e.g., Räty et al., 2012), prejudice (e.g., Campbell et al., 2010), person perception (e.g., Yedidia & Lipschitz-Elchawi, 2012), emotions (e.g., Misailidi et al., 2011), emotionally laden experiences such as war (e.g., Ben-Asher, 2016), peer relationships of various types (e.g., Cannoni & Bombi, 2016), and social relationships in general (de Rosa, 2014). Some of these drawing-based studies also addressed the school world, proposing that children undertake a variety of pictorial tasks. Some studies posed wide-ranging requirements, such as drawing “something about school” (Dockett & Perry, 2015), “experience of the first year at school” (Einarsdottir et al., 2009) or “your classroom” (Longobardi et al., 2017). Other drawings proposed a specific task, such as portraying only the teacher (Ahi et al., 2016; Arslan-Cansever, 2017; Martikainen, 2019) or teacher and pupil (Bombi & Scittarelli, 1998; Harrison et al., 2007; McGrath et al., 2017). However, to our knowledge, few scholars asked children to compare and depict school situations with opposite valence (Maxwell, 2015; Pinto & Di Prospero, 2000). Pinto and Di Prospero (2000) asked 100 children (age 6 to 10 years) to produce two drawings, one of “harmony” and one of “disharmony” between themselves and one of their teachers. The authors scored the drawings with PAIR (Bombi et al., 2007), a method of analysis devoted to measure various qualities of depicted interpersonal relationships. Pinto and Di Prospero (2000) found a significant difference between drawings in terms of a higher number of pictorial indices of psychological distance in disharmony situations, possibly indicating a defensive need for a larger personal space. Maxwell (2015) asked 72 children (aged 9 and 10 years) to represent themselves in two school situations, one “happy” and one “unhappy”. The author adopted a phenomenological framework of analysis to generate categories of themes most representative of drawing contents; in this vein, he did not provide a statistical analysis but from the raw frequencies reported, one can determine clear differences in each of the four categories identified: scene location (happy: mostly outside; unhappy: mostly inside); setting (happy: mostly informal; unhappy: mostly formal); subject’s action (happy: equal frequency of active and passive; unhappy: mostly passive); presence of other people (typically peers in both situations, with teachers very rarely represented in the happy situations, and a little more frequent in the unhappy situations). Both studies we have just described confirmed the usefulness of drawing to explore children’s perception of contrasting situations in school life, but the topic remains insufficiently explored, especially if we consider the importance of hearing children’s voices on matters important to them, such as school (see reviews and critical issues in Blaauw, 2016; Hall, 2017; Pearce & Wood, 2019). In particular, pupils’ opinions about the relationship with teachers can be different from those expressed by the teachers themselves, providing valuable contributions to those who care about children’s wellbeing. In the present study, similarly to Maxwell (2015), we describe the pictorial contents used by children to represent positive and negative school situations. However, our strategy of data collection was substantially different because the simple request to depict “school situations”, as Maxwell did, does not guarantee that children would include the teacher in their drawings, as indeed happened in his study. For this reason, we followed a research plan similar to that of Pinto and Di Prospero (2000), requiring that our subjects not only draw instances of positive and negative experiences, but also that they include the figures of themselves and the teacher; moreover, we explained that with his/her drawings each child would have to make us understand what it meant for him/her to relate to their teacher. This focused task, complemented by the explanation of our research interest, is in line with Burkitt’s (2017) suggestion that clarity of communication enhances the richness of information we obtain from children’s drawings. As Burkitt (2017, p. 221) writes: “When communicating how they feel about themselves and other people, children alter the literal and abstract aspects of their drawings when they are explicitly instructed that an audience will need to understand whether they feel positively or negatively towards a drawn figure.” We then expected that children would have drawn situations in which positivity and negativity depended directly on teachers’ actions towards the pupil, or the reverse, or both. In the present paper, we compare the categories potentially found with respect to school grade and gender. It is likely that children would change their perception of school when they move from lower to upper grades, since subjects to be studied become more difficult (Bennett, 2019) requiring increased commitment, which inevitably modifies the balance between pupils motivation and school reality (Sa’di, 2001; Schwinger et al., 2016). The relationships with teachers also change, especially because in the upper grades of primary school pupils are approaching adolescence with the associated changes in interpersonal needs (Heatly & Votruba-Drzal, 2019). Moreover, in Italy, given the prevalent policy of looping in primary schools, teachers usually remain with the same class from one grade to another: this creates a long-term relational history that can evolve – for better or worse – over time (Hill & Jones, 2018). Finally, gender would also be a source of differences in children’s perspectives. Nowadays, girls are generally more successful in school (Spinath et al., 2014) and, according to a recent meta-analysis, their superiority in academic results also extends to traditionally male fields, such as informatics (Siddiq & Scherer, 2019). This difference is at least partly related to gendered achievement goals: boys appear to be most interested in comparing their results with those of peers; girls instead seem to be more intrinsically motivated (Jones & Mueller, 2017). Italy is no exception to this scenario, with boys showing higher dropout rates (Colombo, 2015) and poorer relationships with teachers, marked by lower affection and higher conflict (Molinari, 2009). Furthermore, Italian schools have been “feminized” (Pak, 2012; Ministero della Pubblica Istruzione, 2007) for almost a century enrolling an increasingly higher percentage of women as teachers. This is a world-wide phenomenon which has promoted a number of studies on the differential impact of the teacher’s gender on boys’ and girls’ school success, with uncertain results: in fact some studies found an advantage of gender-match, at least for girls (Lim & Mee, 2017), while other studies on the contrary did not confirm this advantage (Spilt et al., 2012; Puhani, 2018). Notwithstanding the explorative nature of the present study, we have certain reasonable expectations about the results, based on the literature summarized above. In their everyday school life, children experience both positive and negative interactions; hence, a range of different scenarios should emerge from the two drawings. We also expect that school grade and gender would affect children’s pictorial choices, given the different school experience related to these factors, described above. Finally, we expected to find some consistency between the quality of the pupil-teacher relationship assessed by the latter and pictorial choices of the child, but we were unable to outline more specific expectations in the absence of a pertinent reference literature. Participants A total of 15 classes of primary school from 2nd to 5th grade were involved, with 245 students (117 girls and 128 boys, from 7 to 11 years of age). Based on their parents’ occupations and education, the participants can be considered mostly middle-class and lower middle-class. Participant teachers had, on the average, 20 years of service (range 7-30 years); their mean age was 47.5 years (range 33-60 years). In the Italian primary school, which is regulated by a nation-wide system, two or more teachers share the teaching hours allocated to the group of pupils in each class (varying from 15 to 30 children). We will call “principal teacher” the one with whom pupils spend most of their school time. It is also important to note that in Italy the common practice is that students remain with the same group of teachers throughout their primary years. After receiving approval from the first author’s university ethics commission, the aim of the study was presented to the school principal and to the teachers, who then informed children’s families. A written consent was then obtained from school authorities and teachers, and from the parents of participating children. Children’s consent was obtained orally. Measures Children were asked to make two drawings, one of a positive and one of a negative relational situation with their principal teacher (P and N drawings). Teachers filled, for each student, the Student-Teacher Relationship Scale (Pianta, 1992) in the Italian version validated by Molinari and Melotti (2010). In this version, the scale comprises five dimensions, two of which (Affection, with 5 items, and Conflict, with 6 items) correspond quite strictly to two dimensions of the original scale (Closeness and Conflict), while the other three are partly different. In fact, the original Dependency dimension of Pianta (1992) splits into two components: Dependency (6 items), in which the search for proximity is combined with jealousy and relational difficulties and is in fact a form of conflicted attachment, and Insecurity (5 items), in which affection is accompanied by a lack of autonomy. The fifth dimension emerging in the Italian study includes 3 items about teacher stress and feelings of frustration plus a reversed item of closeness; this fifth dimension was then labeled Teacher difficulties by Molinari and Melotti (2010). Procedure After a presentation to the entire class, children were divided into small groups with tables wide spaced to avoid copying. One of the authors explained that we would like to know how each child was getting along with his\her teacher, and that he\she could let us know this by drawing him\herself with the principal teacher at different moments. Then the experimenter gave each child two sheets, with these titles: “Myself and my teacher [name of the principal teacher] when we feel good together” and “Myself and my teacher [name of the principal teacher] when we are not feeling good together”. Children did not receive time limits, but to avoid exceeding the 30’ allowed by the school, only paper and pencil drawings were required, without coloring; all participants completed the drawings within 20’. At the moment of data collection, children were asked to indicate which figure represented the teacher, if it was not already evident from the figures’ proportions and actions. Each principal teacher received the STRS questionnaire in a sealed envelope with the request to return it to us within a few days. Data Analysis In order to generate the appropriate categories of situations, the first author examined the contents of 30 P drawings and as many N drawings, each P and N pair made by one boy and one girl from each of the 15 participating classes. The indices taken into account were derived from verbalizations in balloons (e.g., teacher’s praises or reprimands; child’s protests or apologies; expressions of affect), written contents (e.g., grades on notebooks, right or wrong result of exercises on the blackboard), gestures (e.g., a hug, a finger pointing to the door), mimics (e.g., smile, pout, tears, frown, open mouth) and setting (e.g., a tree and a bench, school furniture and materials). From this pilot analysis, four nominal categories emerged. The category Ordinary Activity was assigned to P or N drawings portraying the teacher near the blackboard or desk, sometimes proposing an exercise, and the child sitting at his/her place or standing in front of the teacher for an exam; this particular kind of scene had no specific indication of positive or negative quality in the ongoing interaction between pupil and teacher. The other three categories (Special Moment, School Result, Interpersonal Exchange) also applied to both P and N drawings, but with respect to situations of opposing qualities. For example, the Special Moment category included representations of extra-academic activities and events (often outdoors), but which were easy and happy in the P drawings (e.g., playing in the school garden, going to a school trip) while bothering and sad in the N drawings (e.g., visiting the cemetery, being hurt while playing in the garden, sitting in class but not working). School Result always included school activities and/or evaluations in which P drawings typically reported successful performances and positive grades, while N drawings reported failures and bad grades. Finally, the Interpersonal Exchange category was represented by expressions of affection or shared joy in the P drawings as opposed to reprimands, bad behavior, shared sadness, or upsetting emotions (teacher’s anger vs. child’s sadness) in the N drawings. Figure 1 A Boy’s (4th grade) Drawings.  P drawing (left): Ordinary Activity; Teacher: “What is subjective mode” N drawing: Interpersonal Exchange; Child: “Teacher, you are not kind”; Teacher: “Kris, stop talking.” Another author then scored all the drawings. Agreement with the first author on 30 cases was 96.6% for the 30 P drawings and 93.3% for the 30 N drawings. Discrepancies were resolved by discussion. Categories of situations were then submitted to various non parametric analyses in order to compare the absolute frequency of categories, their comparative presence in the drawing pair, and the effect of school level and gender. The scores in each of the five STRS dimensions were compared with separate variance analyses in which the four P categories were used as independent factors; the same type of analyses were repeated with the N categories as independent factors. Post hoc comparisons were conducted with Duncan’s test. Results A preliminary analysis of the distribution of boys and girls by school grades confirmed that the distribution was balanced, χ2(4) = 4.51, p = .342. χ2 applied separately to the distributions of P and N categories (see marginal totals of Table 1) showed significant differences in both cases, P: χ2(3) = 32.93, p < .001; N: χ2(3) = 105.91, p < .001. The most frequent P situations were obtaining a good grade (category 3) and having a pleasant interpersonal exchange, such as words of affection or shared positive emotions (category 4). In N drawings only one category (category 4) was largely dominant; it includes reprimands for bad behavior and\or a negative emotional climate, such as the teacher’s angry face or a sad face of the student, or unhappy expressions of both. Table 1 Cross-tabulation of Categories in Positive and Negative Situations 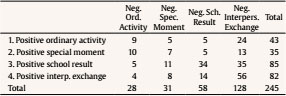 Figure 2 A Boy’s (2nd grade) Drawings. 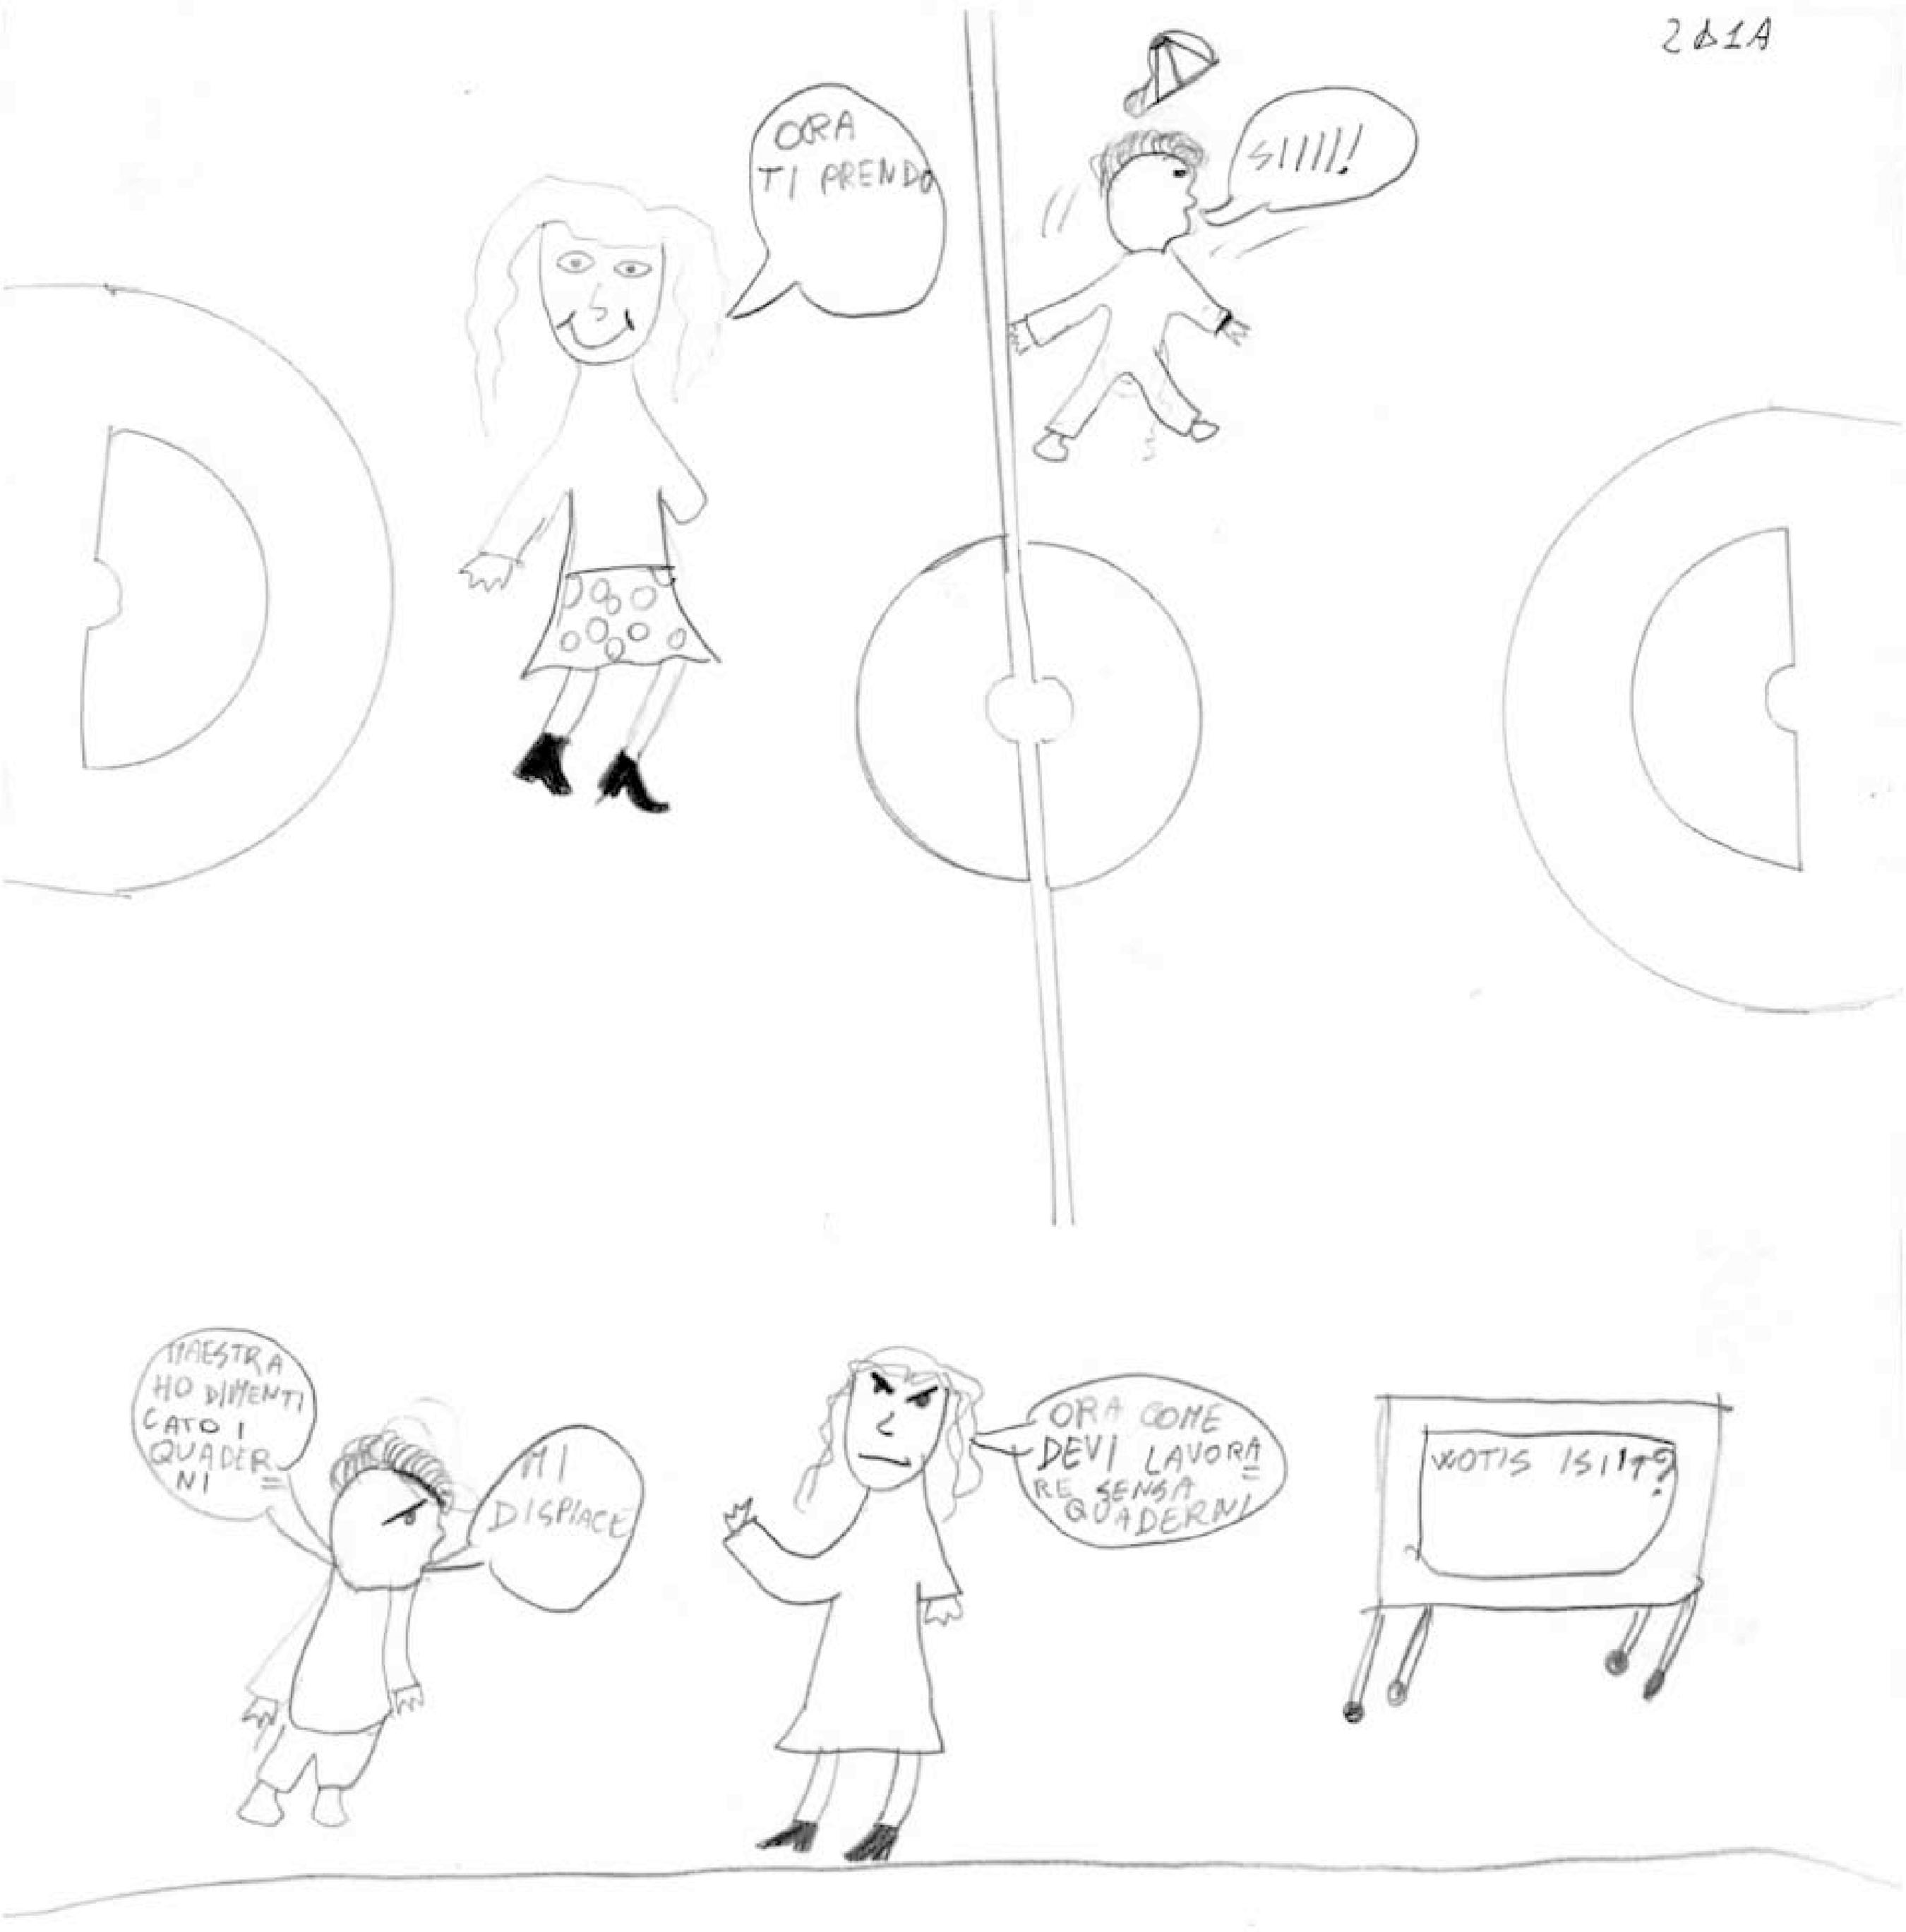 P drawing (left): Special Moment; Teacher “Now I will catch you”; Child: “Yesss! N drawing: Interpersonal Exchange; Child: “Teacher, I forgot the notebooks”; Teacher: “Now you have to work without the notebooks”; Child: “I’m sorry.” The contingency coefficient, calculated on the data of Table 1, was significant (0.38, p < .001). In fact, in 106 cases (43%) children chose to contrast a negative and a positive version of the same situation, especially school success in P and failure in N (category 3) or exchange of affection in P and reproach in N (category 4). However, there were many exceptions (as also evident in Table 1):
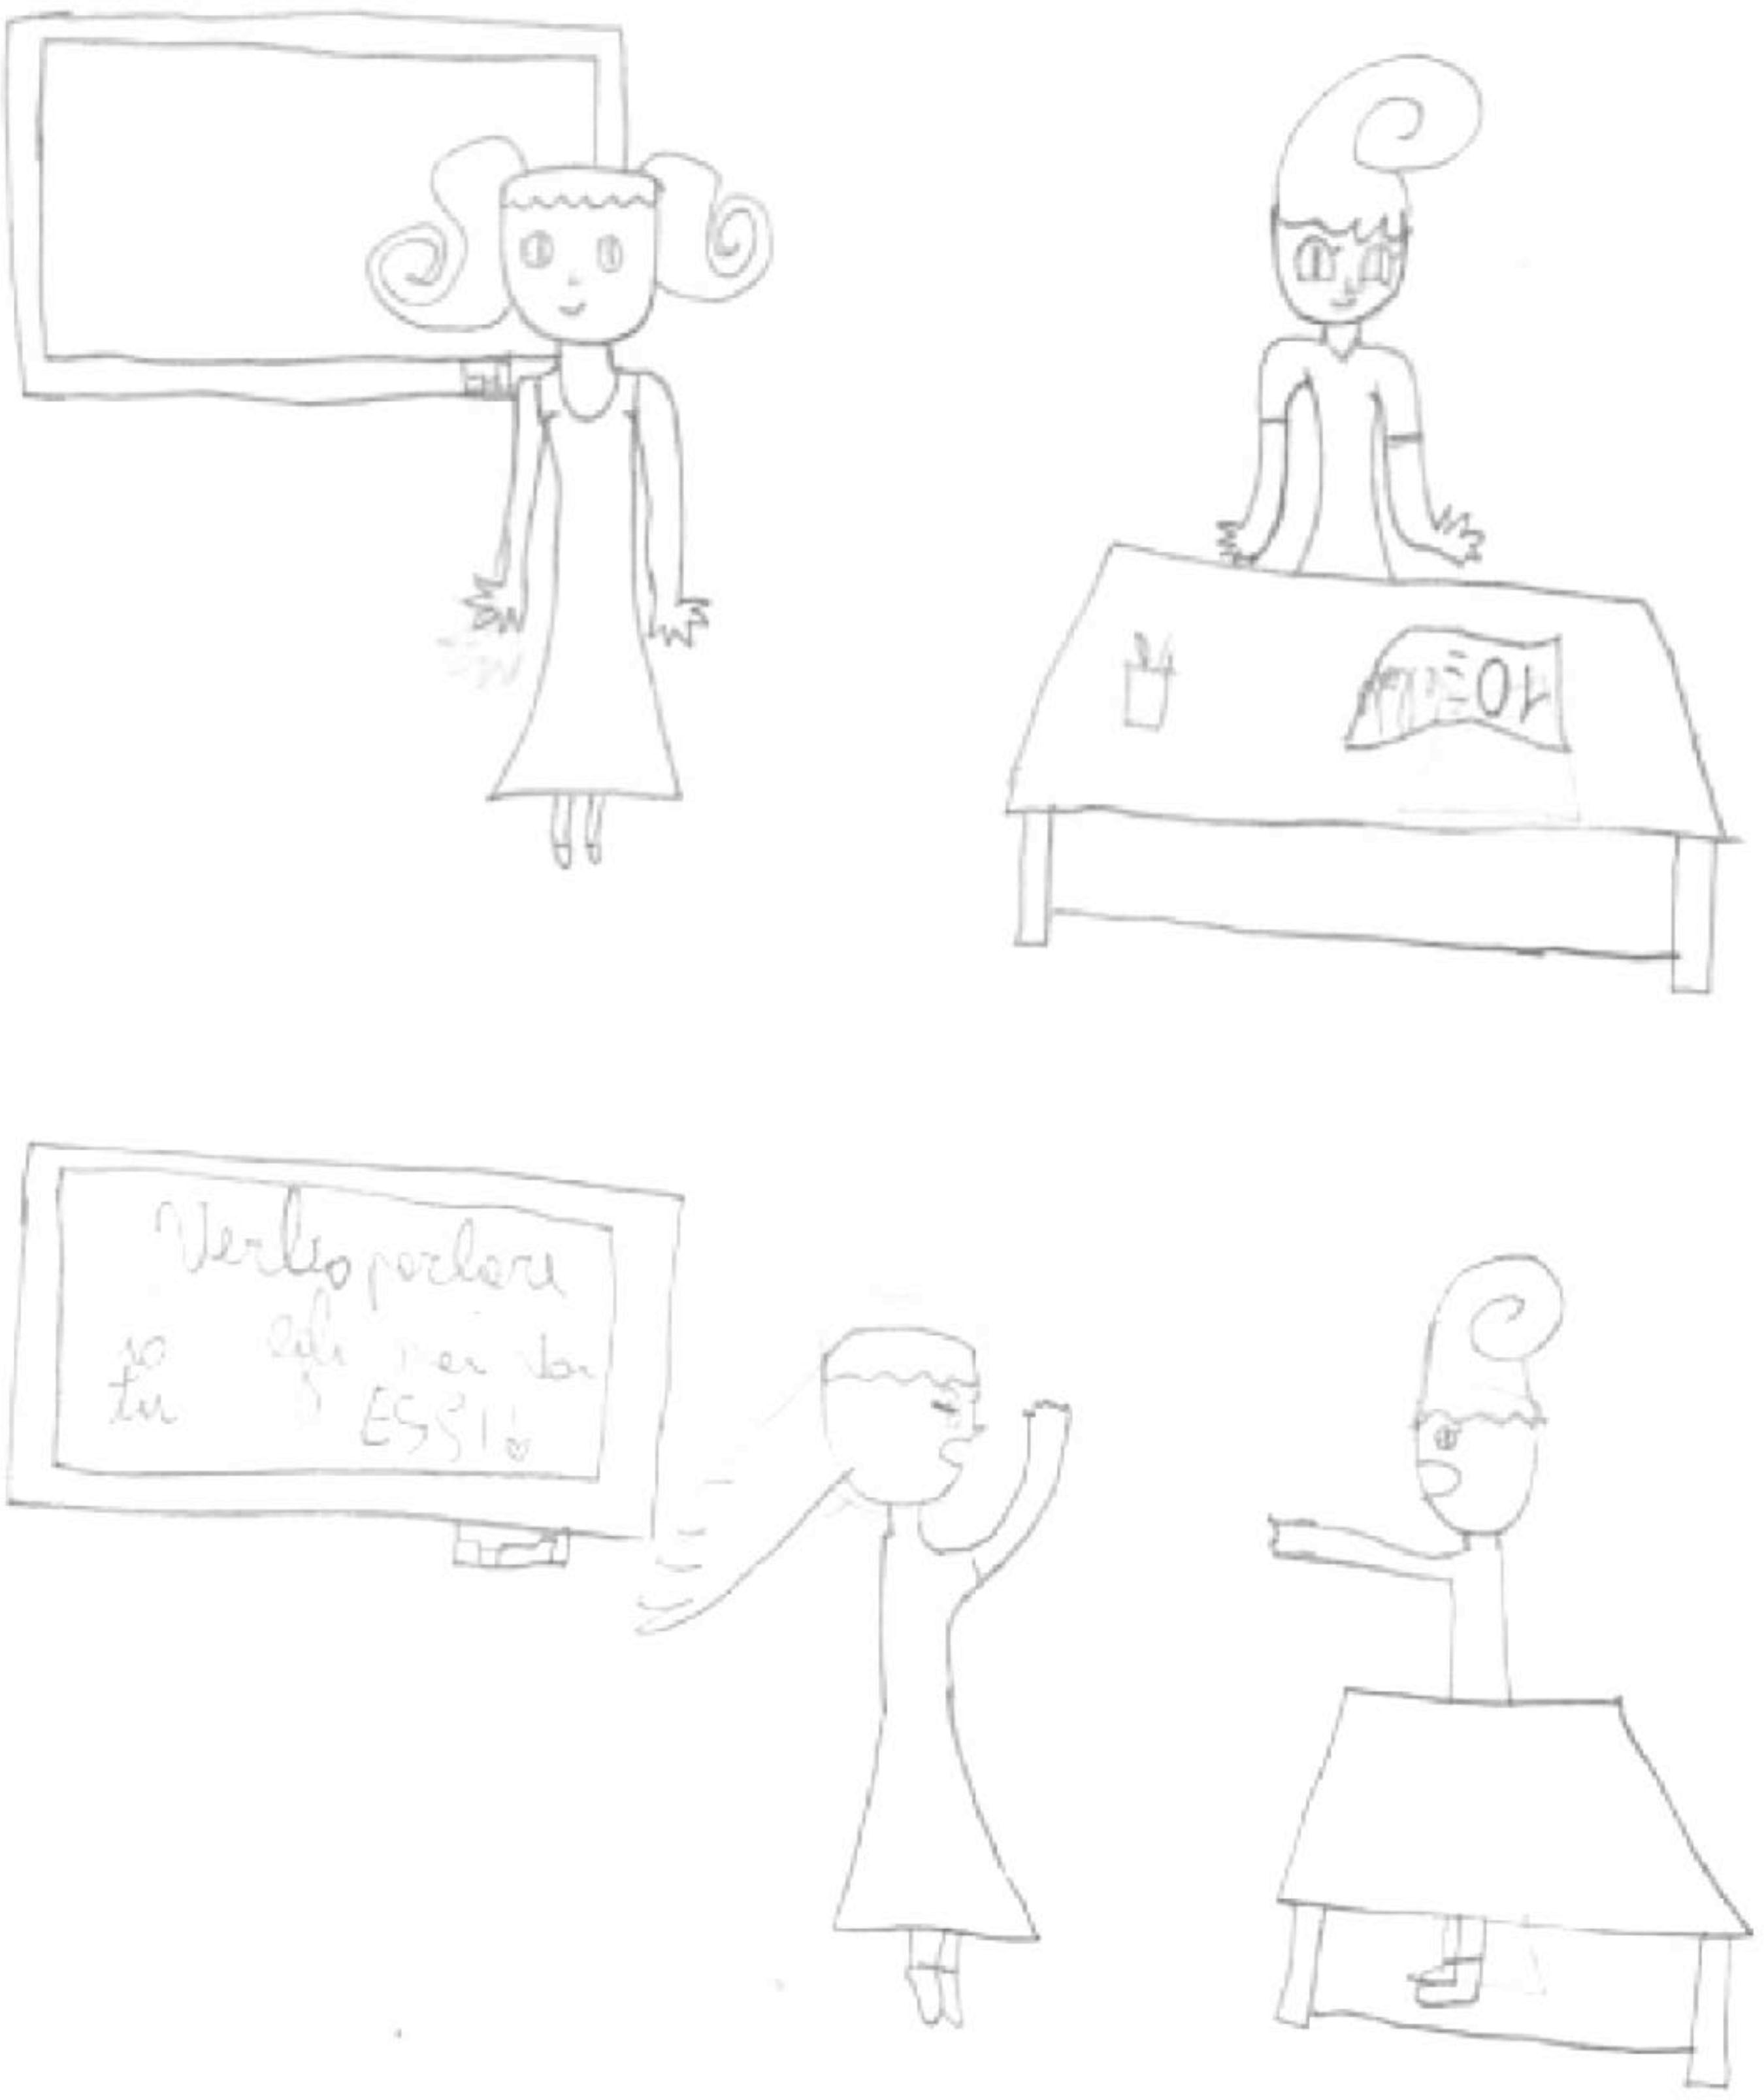
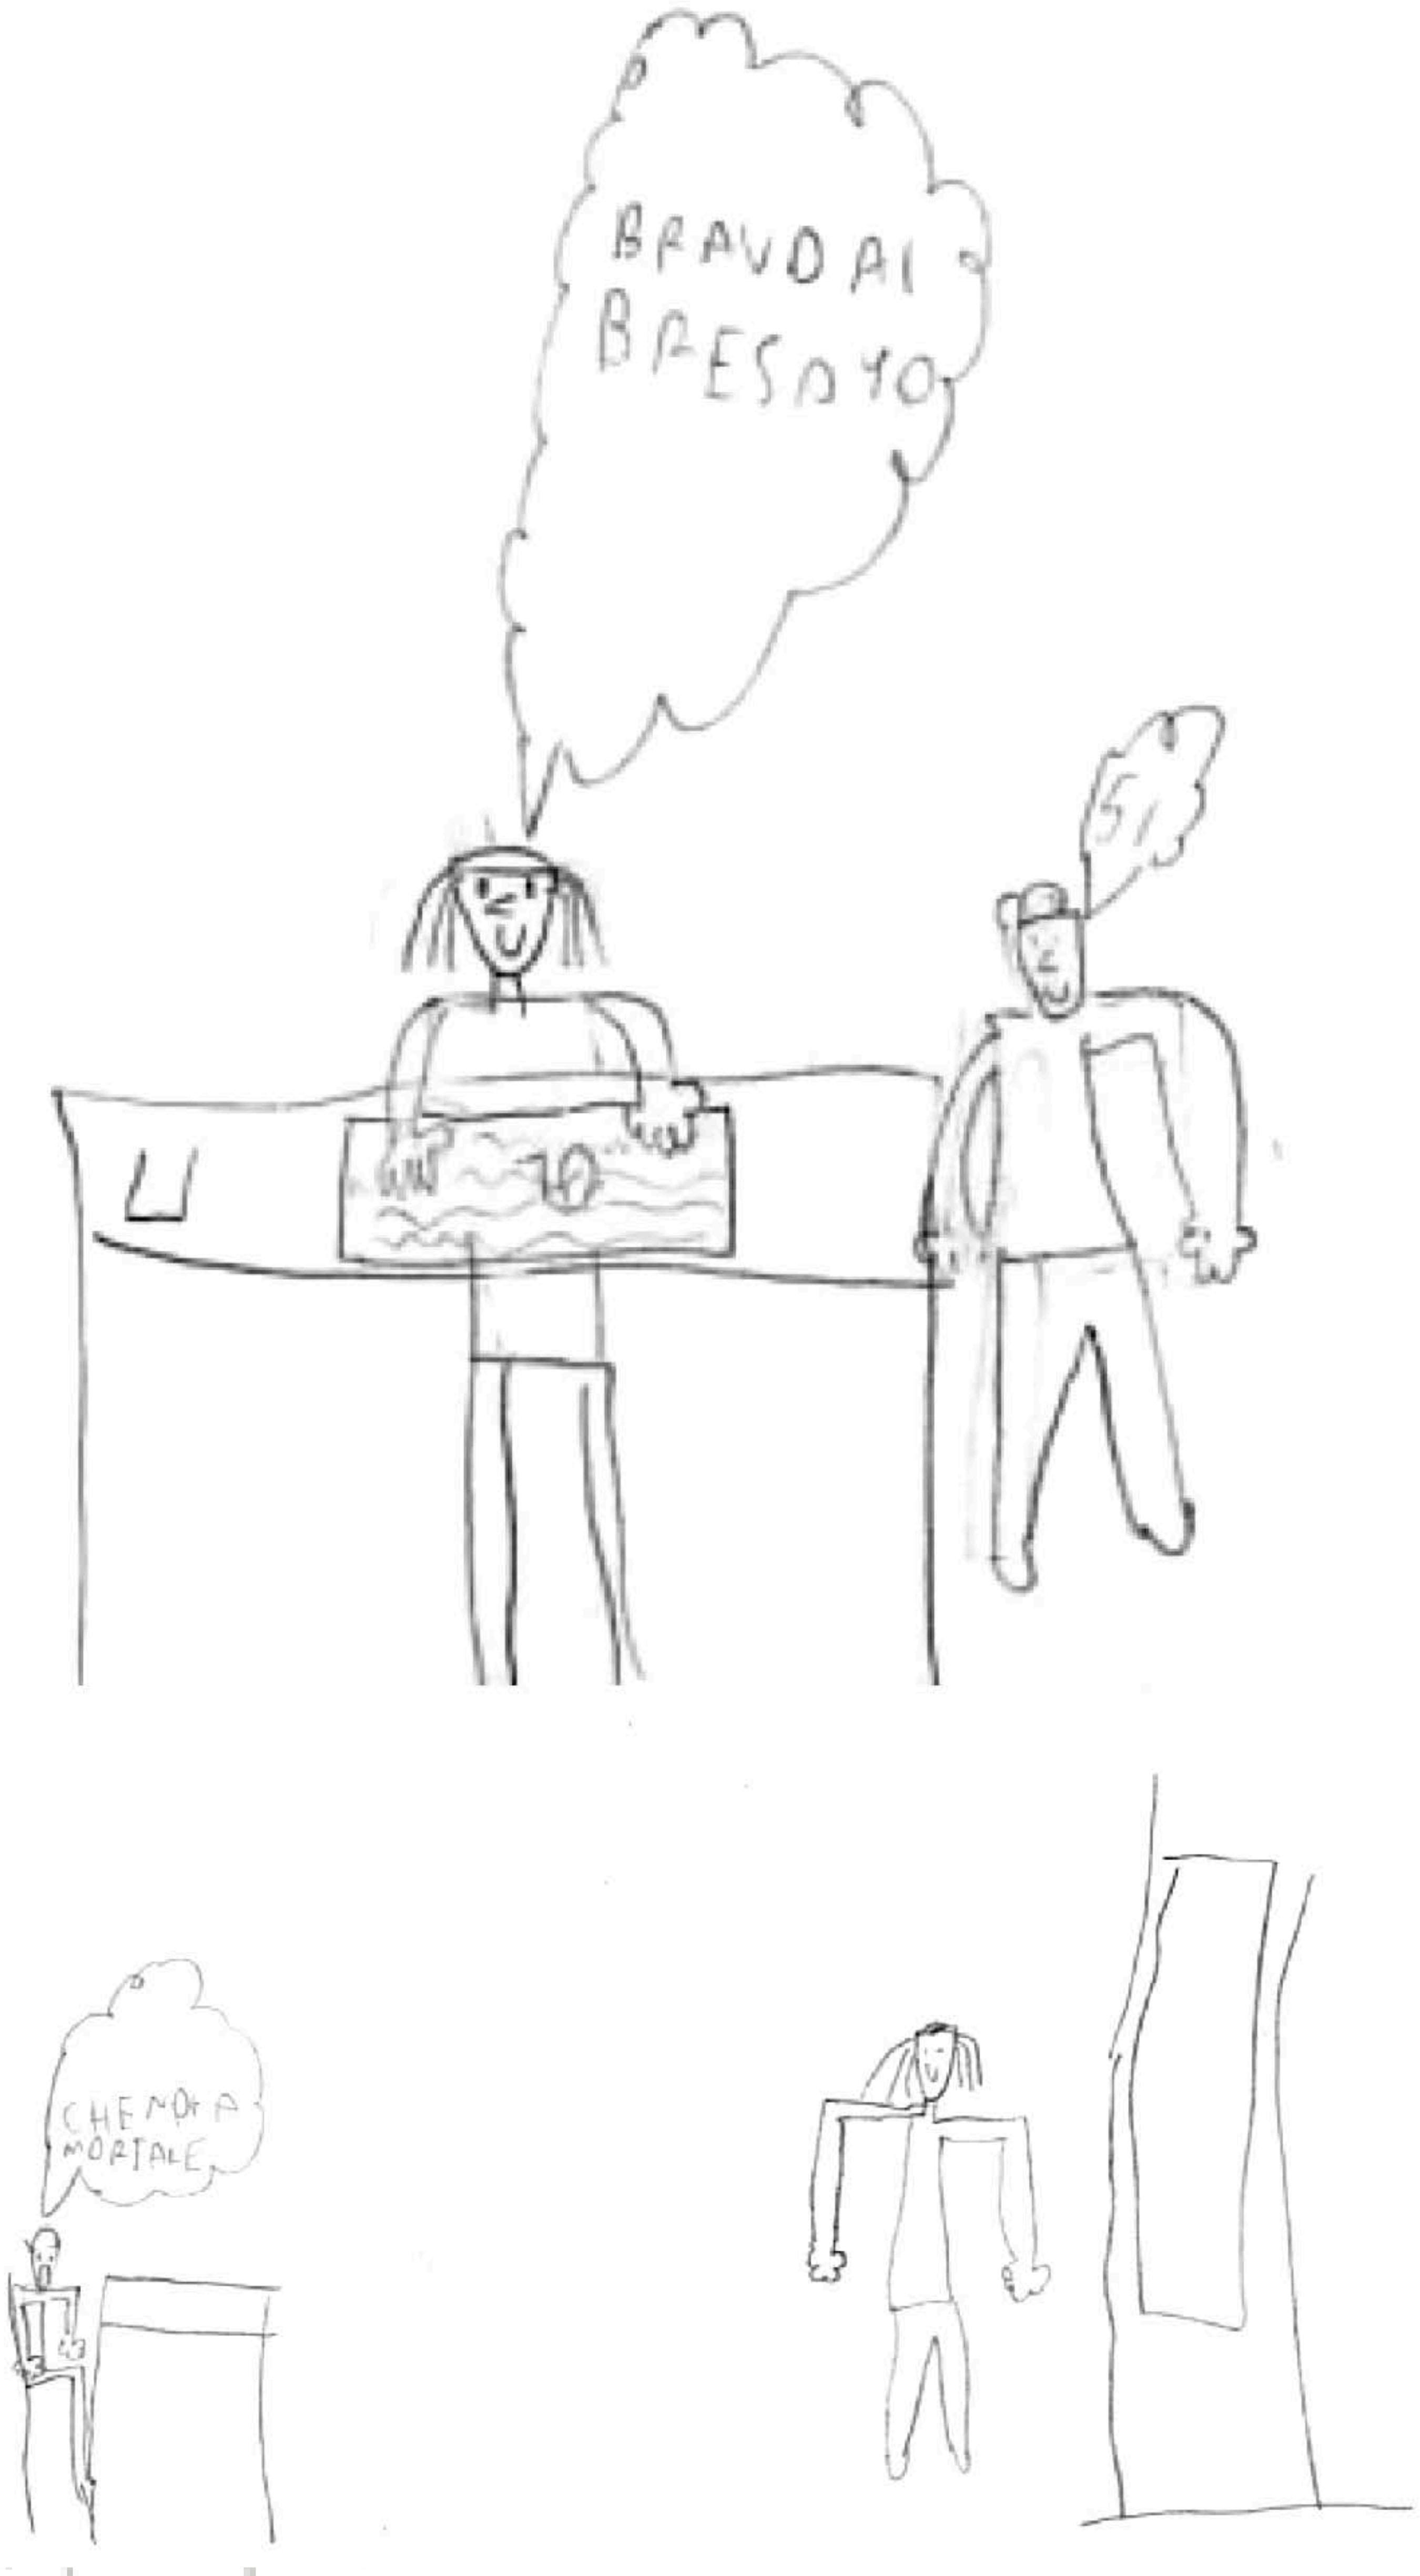
The frequencies of the categories in the P and N drawings were compared by gender and by school grade, combining the participants into two groups (lower grades = 2nd and 3rd grade; upper grades = 4th and 5th grade) to avoid small numbers per cell. Significant differences of gender emerged in P drawings, gender: χ2(3) = 13.35, p = .004, in which boys represented a successful School Result more often than girls; these latter, on the contrary, portrayed a warm Interpersonal Exchange more often than boys (see Figures 6 and 7). In the N drawings, instead, boys and girls alike concentrated on difficult Interpersonal Exchanges, gender: χ2(3) = 1.11, p = .775. Figure 6 A Girl’s (2nd grade) Drawings  P drawing: Interpersonal Exchange; Child: “You are very beautiful”; Teacher: “Thanks, you too” N drawing: School Result; Teacher: “Get out the door; Child: “OK I go” Teacher’s figure on the right in P and on the left in N drawing. Figure 7 A Boy’s (4th grade) Drawings.  P drawing (left): School results; Teacher: “Very good”; Child: “Teacher, I’ve learned the hieroglyphics.” N drawing: Interpersonal Exchange; Teacher: “Ettore, you’re getting punished because you gave coffee to the hamster. Also for school grade significant differences emerged only in P drawings, school grade: χ2(3) = 13.69, p = .003, in which positive School Result became prominent for children in the upper grades, at the expense of all other categories, especially joyful Special Moments. In N drawings of children from all grades, the most frequently expressed worry was about a difficult Interpersonal Exchange, school grade: χ2(3) = 2.84, p = .418. The significant differences are shown in percentages in Figure 8 and Figure 9, to make these differences easier to understand. Figure 8 Percentages of Positive Situations by Gender. 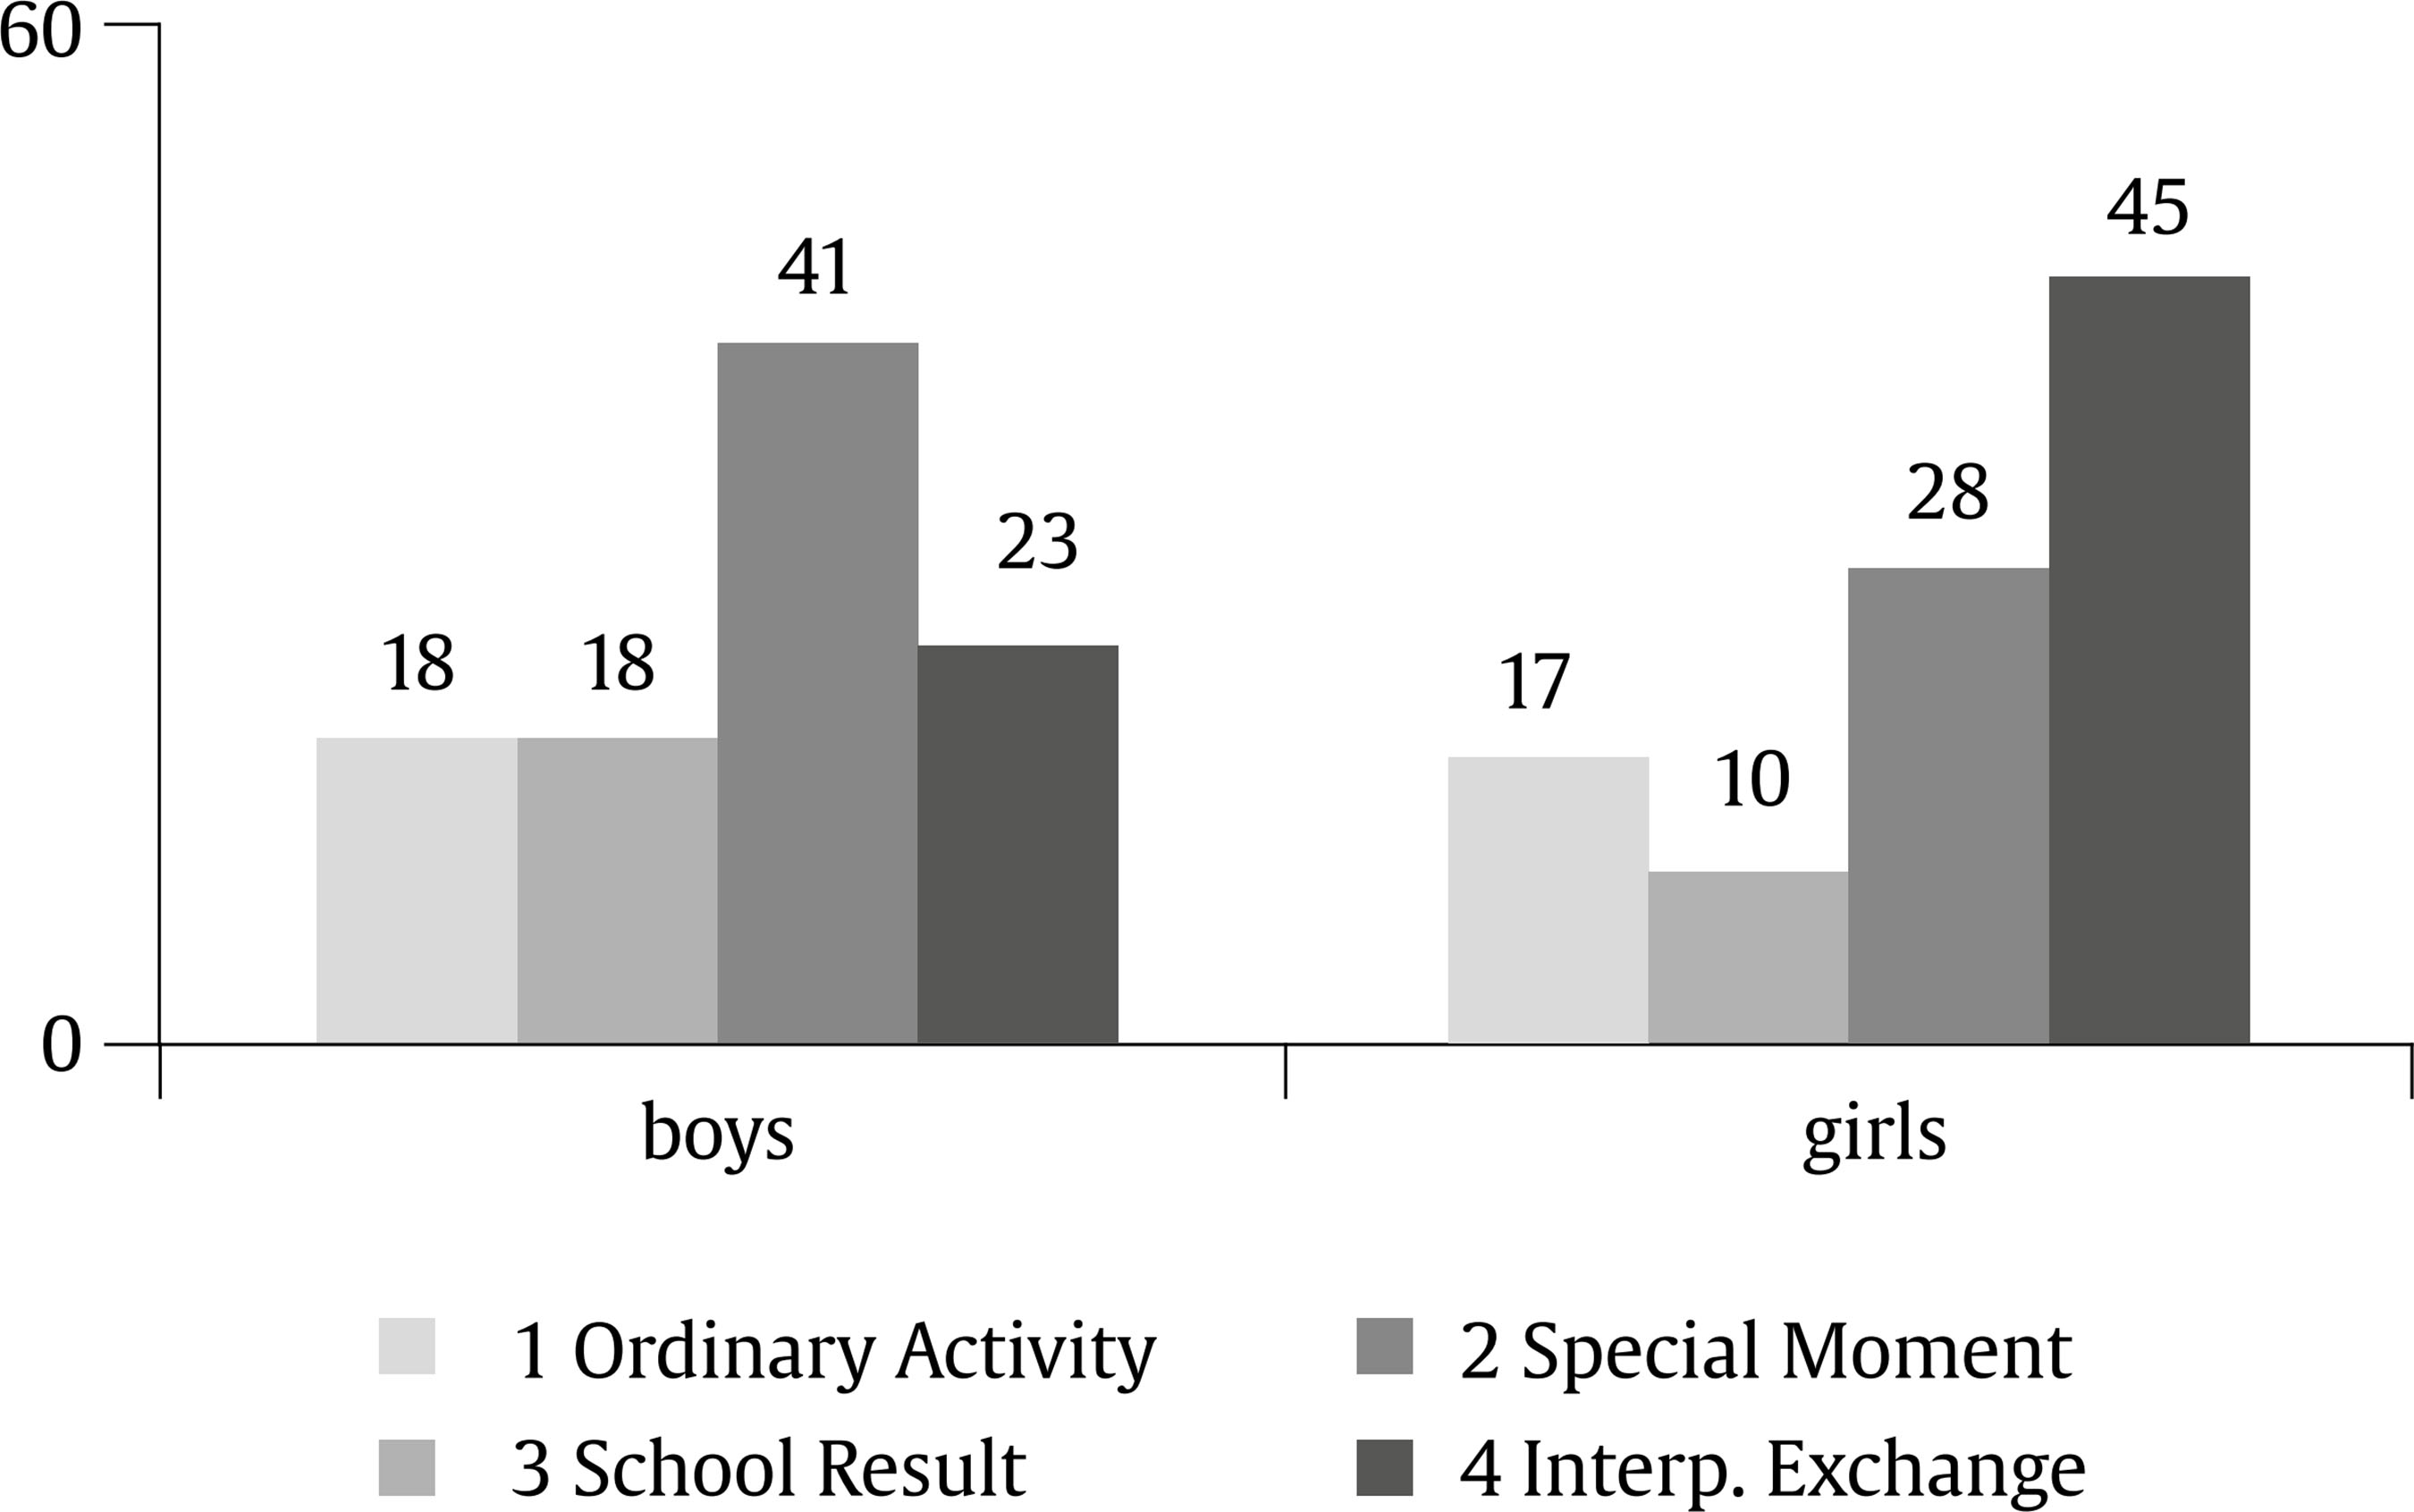 Figure 9 Percentages of Positive Situations by School Grades.  The analyses of variance conducted on the STRS dimensions by P categories yielded significant results in two cases: Affection, F(3, 241) = 3.31, p = .021, and Insecurity, F(3, 241) = 6.64, p < .001. The post-hoc comparisons of the Affection averages (Ordinary Activity = 3.72, Special Moment = 3.92, School Result = 3.94, Interpersonal Exchange = 4.18) showed that children who portrayed a P situation as involving a warm Interpersonal Exchange were perceived by teachers as having more Affection than children who represented an Ordinary Activity; children who represented a Special Moment or School Results received intermediate Affection scores. For Insecurity means (Ordinary Activity = 3.46, Special Moment = 3.57, School Result = 3.50, Interpersonal Exchange = 3.89) the post hoc comparisons showed that children who portrayed a P situation as involving a warm Interpersonal Exchange were perceived by teachers as more insecure than all the other children. Finally the analysis of variance on the STRS dimensions by N situations showed a significant difference only in the Dependency scores, F(3, 241) = 2.69, p = .046. Post hoc comparisons on these means (Ordinary Activity = 1.68, Special Moment = 1.27, School Result = 1.58, Interpersonal Exchange = 1.57) showed that children who portrayed a negative Special Moment were perceived by teachers as less dependent than all the other children. The drawings collected for this study were clearly informative about those positive and negative child-teacher interactions that occurred most often. It was not surprising that the most frequent category of positive situations was that in which the pupil received a good grade (category 3): after all, learning and receiving confirmation of success is what school is for. However, the need for a positive relationship with the teacher (category 4) was even more stressed by participants: not only was the representation of affectionate interactions almost as frequent as that of good grades, but also more than half of the negative situations were precisely difficulties in this relationship, while bad grades were depicted far less often. We think that the contrastive procedure, in conjunction with the task presentation as a means of communication with the adult experimenter, helped children to focus on relevant instances of their relationship with the teachers with whom they spend more hours in school. This procedure is suggested as a basis for a valid use of drawing in quantitative research (Burkitt, 2017) and confirmed as very useful also in different theoretical frameworks such as that adopted by Maxwell (2015). In fact, in our study, only 9 children failed to differentiate the P and N drawings, representing both as merely an Ordinary Activity, that is, without any specific indication of the quality of their ongoing relationship with the teacher such as children sitting at their tables (as in the N drawing of Figure 4) or standing in front of the teacher for an oral test (as in the P drawing of Figure 1). In the other 97 cases in which two drawings of the same category were produced, the portrayed situations had opposing qualities. In P drawings, we found joyful Special Moments like a birthday celebration or a field trip (P drawing in Figure 4); excellent School Results (P drawing in Figure 3); smiling faces, words or gestures of affection in the Interpersonal Exchanges (P drawings in Figures 6 and 7). In N drawings, we found, respectively, upsetting Special Moments, such as a pupil complaining about extreme boredom (N drawing in Figure 5), failures or bad grades in School Results, Interpersonal Exchanges characterized by unhappy or angry faces (N drawings in Figures 2 and 3). Juxtaposition of different categories can be revealing as well. Presentation of an Ordinary Activity as positive, combined with a negative Interpersonal Exchange, seems to say “I’m usually feeling fine at school, except when the teacher is angry with me, or disappointed”. Instead, when an Ordinary Activity is proposed as an instance of a bad situation, while the positive example is a Special Moment, the child seems to be saying “I’m feeling fine with my teacher only when we are NOT in class”. Another intriguing result is the combination of a successful School Result with one or another of two different negative instances: unsuccessful School Results or negative Interpersonal Exchange. It is as if children are saying “There are two reasons for feeling bad at school: bad grades and reprimands for bad behaviors, but there is only one reason for feeling well, i.e., receiving good grades. Good behavior is not openly acknowledged by our teacher.” Gender and school grade had a significant influence on the representation of positive situations. Girls represented more often than boys a positive Interpersonal Exchange, in line with the literature that documents their better school adaptation (Spinath et al., 2014). The fact that participants’ teachers were all women, as is common in the Italian school (Ministero della Pubblica Istruzione, 2007), could have had a certain effect on this result. In fact, even if gender-match does not seem to impact on academic results, it does affect interpersonal exchanges between teacher and pupil, with girls entertaining a more affectionate relationship (Molinari 2009). Boys stressed much more their personal success, possibly because receiving good grades allows them to assume a winning position among their peers (Jones & Mueller, 2017). The shift of older children from all other categories toward that of School Result can be explained by the increasing “seriousness” of school life (Bennett, 2019). This means, on the one hand, less space for both untroubled Ordinary Activity and joyful Special Moments in order to concentrate on learning; on the other, the pressure for learning can lead to a decrease in the warmth of interpersonal relationships as evidenced by the reduced number of positive Interpersonal Exchanges. In N drawings a single category prevailed, for boys and girls alike, without changes linked to school grades: Interpersonal Exchanges. This interesting asymmetry between P and N drawings sheds more light on the results discussed insofar. The lesser frequency of boys’ representation of Interpersonal Exchanges does not mean that the relationship with teachers is not relevant for them. Even if not receiving or expressing positive feelings as girls do, they suffer in similar ways for reprimands and negative comments on their behavior. The kinds of situations in which teachers are angry or dissatisfied by the child’s behavior did not increase in the last years of primary school, and this can be seen as an encouraging result; however, the same result can be read also in the opposite direction, as an early perception of school as a place in which one can be the target of frequent reproaches. Teacher’s perception of their relationships with their students, as measured by the STRS, showed some interesting concordance with children’s representations. High scores of Affection and Insecurity were obtained by children who represented positive situations as those in which a warm Interpersonal Exchange is taking place. This is self-evident for Affection, which is a measure of closeness between child and teacher; but also Insecurity measures a need for proximity, maybe even more than Affection, given the lack of autonomy of insecure children. Less obvious is the lack of concordance between Conflict or Teaching difficulties with the representation of negative Interpersonal Exchanges. However, one should remember that the contrastive task forced all children, independently of the actual quality of their relationship with the teacher, to find instances of negative moments, even if rare for them. Only Dependency showed some relationship with children’s pictorial choices in the representation of negative situations, being particularly low for those children who depicted a negative Special Moment. In other words, children who drew an out-of-school situation or a suspension of academic activities (category 2) were perceived as less dependent than those who drew an interactive exchange with the teacher (category 4), an evaluation outcome (category 3) or an ordinary school moment (category 1). Perhaps this pictorial choice was more common in disengaged children than in dependent children, but it is not at all clear why the same pattern did not occur in the case of Affection and Insecurity. The use of drawings adds to other sources of information about school life, giving voice to young students with an open instrument, yet more economic in terms of data collection than individual interviews. The differences by school grade and gender are in line with previous research, while offering a fresh perspective that complements the information about the quality of student-teacher relationships gathered through synthetic measures. The descriptive approach allowed us to discover what joys and concerns are typically experienced by young students. Future research could extend to school grades immediately following primary school, whose pupils are still at the age in which drawing tasks are welcomed, and could provide an enhanced perspective on some aspects of the adolescent’s school life. The role of family conditions, in terms of education and income, could also be explored, since children’s perception of their relationship with teachers could be influenced to a certain degree by parents’ opinions and expectations. Also, it could be interesting to compare the present data with those of children in other countries, with different school systems (e.g., teachers who change yearly). Drawing, in fact, is an excellent means for cross-cultural comparisons. Of course, this study has limitations, the more obvious of which is the lack of children’s verbal information. In consideration of the large variability of pictorial data, the number of participants is another important limitation; among other things, this prevented a joint examination of the two drawings, since the 4 x 4 matrix gives rise to 16 possible categories, some of which occurred infrequently. Conflict of Interest The authors of this article declare no conflict of interest. Cite this article as: Bombi, A. S., Cannoni, E., Gallì, F., & Di Norcia, A. (2020). Children’s pictorial representation of their interactions with teachers. Psicología Educativa. 27(1), 13-20. https://doi.org/10.5093/psed2020a14 References |

Cite this article as: Bombi, A. S., Cannoni, E., Gallì, F., & Norcia, A. D. (2020). Children’s Pictorial Representation of Their Interactions with Teachers. PsicologĂa Educativa, 27(1), 13 - 20. https://doi.org/10.5093/psed2020a14
anna.dinorcia@uniroma1.it Correspondence: anna.dinorcia@uniroma1.it (A. Di Norcia).Copyright © 2026. Colegio Oficial de la Psicología de Madrid


 PDF
PDF e-PUB
e-PUB CrossRef
 JATS
JATS Imprimir
 Enviar
ALERTA POR E-MAIL
La Revista de Psicología Educativa está distribuida bajo una licencia de Creative Commons Reconocimiento-NoComercial-SinObra Derivada 4.0 Internacional.com