Testing a Model for the Monitoring of Worked-out Algebra-Problem Examples: From Behaviours to Outcomes on a Math Task
[La validación de un modelo para el control de la comprensión de problemas de álgebra resueltos: de los comportamientos a los resultados en una tarea de matemáticas]
Vicente Sanjosé, Carlos B. Gómez-Ferragud, José J. Verdugo-Perona, and Joan J. Solaz-Portolés
University of Valencia, Spain
https://doi.org/10.5093/psed2021a25
Received 6 May 2020, Accepted 14 June 2021
Abstract
This study aimed at testing an extension of a theoretical model for the metacognitive monitoring mechanism implied in the detection of inconsistencies when the information provided includes abstract symbols in addition to plain text. Ninety-four postgraduates of STEM specialities were asked to read a worked-out algebra-problem example and to report any incoherence, inconsistency, or error detected in the statement or in the solving procedure. A set of model-inspired indexes was defined to describe participants’ behaviour along the task. The Read & Answer software was used to record online individual processing data and participants’ reports. Results supported model predictions. Indexes correctly predicted participants’ outcomes in the task with high accuracy. Specific students’ behaviours could be associated to observed task outcomes with sufficient reliability within the limitations of the study. In addition, algebra processing was compared with plain text processing.
Resumen
Este estudio tiene como objetivo probar una extensión de un modelo teórico para el mecanismo de control metacognitivo que sirve para la detección de inconsistencias cuando la información proporcionada incluye símbolos abstractos además de texto natural. Se pidió a 94 postgraduados de especialidades STEM que leyeran un ejemplo resuelto de un problema de álgebra y que informaran sobre cualquier incoherencia, inconsistencia o error detectado en el enunciado o en el procedimiento de resolución. A partir de un modelo teórico se definió un conjunto de índices para describir el comportamiento de los participantes a lo largo de la tarea. Se utilizó el software Read & Answer para registrar online los datos de procesamiento individual y los informes de los participantes. Los resultados confirman las predicciones del modelo. Los índices predicen correctamente los resultados de los participantes en la tarea con gran precisión. Los comportamientos específicos de los alumnos podrían asociarse a los resultados observados de la tarea con suficiente confiabilidad dentro de las limitaciones del estudio. Además se ha comparado el procesamiento del álgebra con el procesamiento del texto natural.
Palabras clave
Modelos psicológicos, Aprendizaje de matemáticas, Control de la comprensión de problemas resueltos, o c Asociación comportamiento-resultado, Datos onlineKeywords
Psychological models, Math learning, Monitoring worked-out examples, Behaviour-outcome association, Online dataCite this article as: Sanjosé, V., Gómez-Ferragud, C. B., Verdugo-Perona, J. J., & Solaz-Portolés, J. J. (2022). Testing a Model for the Monitoring of Worked-out Algebra-Problem Examples: From Behaviours to Outcomes on a Math Task. PsicologĂa Educativa, 28(2), 141 - 149. https://doi.org/10.5093/psed2021a25
vicente.sanjose@uv.es Correspondence: vicente.sanjose@uv.es (V. SanjosĂ©).Mechanisms explaining how the human mind operates while doing complex tasks are needed to consistently improve teaching and learning so as to avoid trial-and-error attempts. Teachers could have the possibility of more effective interventions if they knew what piece of a mental mechanism is causally associated to certain students’ difficulties. Students’ behavioural data along a task have been obtained in prior studies using modern devices (Cerdán et al., 2011; Mañá et al., 2017; Salmerón et al., 2017; Sánchez & García-Rodicio, 2013). Behavioural data can thus be causally related to the observed task outcomes. The present study is in line with these studies. Among the different factors statistically associated to school learning (Wang et al., 1993), metacognitive knowledge and skills have proven to be strong predictors of academic success (Hartman, 2001; Koçak & Boyaci, 2010; Young & Fry, 2008). The relationship between metacognitive knowledge and skills, and deep approach of learning has been highlighted by García et al. (2015). There is an agreement on the benefits of improving students’ metacognitive skills by explicit instruction (Desoete & De Craene, 2019), but the mental mechanisms explaining the success of these instructional approaches are poorly known. Interesting advances arise from the field of artificial intelligence. Different architectures for models of metacognition incorporate human characteristics, as does, for instance, the CLARION cognitive architecture (Sun et al., 2006) or the MIDCA dual-cycle model (Cox et al., 2016). However, human mind processing is not based on strict “If-Then” rules (Otero et al., 2008), the basic underlying mechanism in most of these architectures, but on flexible distributed processing which is being revealed in recent research (Qiu et al., 2018; Yeung & Summerfield, 2014). Among other findings, neural deep research has shown that metacognitive skills are, in part, domain specific and their effectiveness depend on the task being performed (Morales et al., 2018). This suggests using tasks associated with specific subjects to study metacognitive skills. In mathematical education, some studies devoted to increase students’ metacognitive competence have been developed (Baten et al., 2017; Desoete & De Craene, 2019), using a variety of math tasks as addition and subtraction (Throndsen, 2011), proportional reasoning (Modestou & Gagatsis, 2010), or problem solving (Cornoldi et al., 2015; Lucangel et al., 2019; Özsoy & Ataman, 2017). However, most studies conducted in the classroom lack a clear theoretical basis. Some models of psychological nature have been also proposed to explain students’ metacognitive behaviour in particular school tasks, as the PREG model by Otero and Graesser (2001) or the obstacle-goal model by Otero (2009) (see also Sanjosé & Torres, 2014). Otero and Kintsch (1992) proposed a mechanism to account for monitoring comprehension of textual information based on Kintsch’s (1998) Construction-Integration model, one of the best-known models for comprehension. Aims and Overview The present study aimed at testing an extension of a theoretical model for the metacognitive monitoring mechanism, the one proposed by Otero and Kintsch (1992), when the information to be monitored is a worked-out algebra-problem example. This kind of learning material, as others in math education, includes abstract symbols in addition to plain text. To achieve this objective, different actions were performed:
In addition, and in the limited scope of this study, we assessed the ability of the extended model to infer the probable cause of monitoring failure when worked-out algebra problem examples are processed. In the long term, the present study would aim at modestly contributing to help teachers infer specific (unobserved) students’ behaviours from their observed task outcomes. Monitoring Worked-out Examples Worked-out examples, in the form of fully solved problems, are considered important instructional tools in mathematical education (Renkl, 2014), physics education (Docktor & Mestre, 2014; Smith et al., 2010), and chemistry education (Crippen & Earl, 2004; Seery, 2013). Educational approaches based on worked-out examples have been shown to be more effective than other approaches in teaching problem solving to novice students (McLaren et al., 2016) due to its lower cognitive load (Sweller, 2006; van Gog & Rummel, 2010). In teaching their students, teachers often solve and explain a set of interrelated problems (worked-out examples) and then pose new problems that share some characteristics with worked examples (Gómez-Ferragud et al., 2013). While studying worked-out examples, students crucially depend on their own monitoring to detect learning obstacles. A detrimental illusion of understanding and overconfidence could arise if students superficially processed the examples or did not process them till the end (Mihalca et al., 2015). This incomplete processing can happen when the process of understanding the worked-out examples is poorly monitored. Monitoring has been assessed in calibration studies using worked-out examples (Baars et al., 2014, 2017; Boekaerts & Rozendaal, 2010), problem-solving (Nelson & Fyfe, 2019), or ill-structured problems such as a chess endgame (De Bruin et al., 2005). The reported main cause of students’ poor monitoring was the overestimation of their own performance. In addition to calibration, error detection (Baker, 2002) is also considered a suitable technique to assess students’ monitoring (Dehaene, 2018). In an exploratory study on monitoring in mathematics conducted with high school students, different errors were deliberately embedded in different locations of solved examples. These errors sought to hinder students’ elaboration of a mental representation of the problematic situation described in the statement, or the translation into algebra of the statement ideas, or the navigation in the problem space (Gómez-Ferragud et al., 2016). In general, students showed poor monitoring, as only 15 percent reported difficulties associated to embedded errors. However, the highest percentage of error detection (25 percent) was observed when the error hindered the algebraic translation process. A Model for Inconsistency Detection when Processing Worked-out Algebra-Problem Examples Kintsch (1998) proposed the Construction-Integration (CI) model for text comprehension, based on propositions as meaning units, and processing cycles due to the limitations of the human working memory. From this model, Otero and Kintsch (1992) generated a mechanism explaining mental processes involved in comprehension monitoring when reading texts. They were able to simulate the observed human failure to detect inconsistencies in a text. According to this mechanism, the processing behaviour yielding to the detection of an inconsistency necessarily involves:
Failures Detecting Inconsistencies in Worked-out Algebra-Problem Examples Otero and Kintsch (1992) simulated failures detecting inconsistencies using a subject’s prior knowledge or beliefs as excitatory factors activating one of the contradictory propositions and inhibiting the other one (a kind of priming). In the present study we expected that failures detecting inconsistencies in a worked-out example of algebraic nature could be caused by two main factors different from priming: inappropriate construction of propositions and working memory overloading, and both might be associated with readers’ overconfidence. First, in the case of worked-out algebra-problem examples two different languages, plain language and mathematics, are implied and have to be interconnected. Meaning construction from the statement sentences (plain text) allows a reader to elaborate a Situation Model (SM). The Problem Model (PM) is built from algebraic equations relating important quantities. “The translation process” (Jupri & Drijvers 2016) requires connecting SM with PM: the general and abstract meaning of (some) algebraic expressions has to be particularized or instantiated according with the SM. This can be a source of obstacles for novice students. Secondly, monitoring the necessary PM-SM connection can overload a reader’s working memory because it demands combining two languages while checking for coherence. Information in both languages must be run in the working memory, increasing the probability of overloading. To avoid overloading, a reader could reduce the number of propositions running at once in their working memory. This reduction could decrease the number of links among different propositions. To compensate for this reduction, a reader must generate additional processing cycles to deliberately link text and algebra information units. Otherwise, decreasing the number of links would decrease the probability of inconsistency detection. Finally, as found in previous studies, a reader’s overconfidence can cause careless processing generating both types of obstacles: poor meaning construction and lack of links among propositions. Participants Ninety-four Spanish students, 30 women and 64 men, participated in this study. They all were graduates in different STEM specialities: industrial engineering (41), environmental (11), telecommunications (8), electrical and electronics (15), and architecture and civil engineering (19). They were enrolled in a master’s degree to become secondary teachers. All of them were informed on the educational purpose and procedures of the research and requested for voluntary participation. Although there was no sampling procedure, these students did not show any special feature compared to those in the corresponding population in Spain. Participants were expected to have sufficient knowledge and experience in problem solving. Therefore, their potential obstacles in a monitoring-for-understanding task should be mainly due to failures in monitoring and not poor understanding. This should simplify data analysis. Instruments Two experimental problems were used in this study. They had different statements, but the same quantities and the same relationships between them (i.e., both had the same algebraic structure). Statements and the full solving procedure were segmented in information units, i.e., complete sentences or equations, as shown in Table 1 (text units were translated from Spanish into English). A ‘reversal mistake’ (Cooper 1986; González-Calero et al., 2015) was embedded in equation R1, causing this equation to be wrong, i.e., inconsistent with unit S1 (see footnote in Table 1). Table 1 Information Units in the Experimental Problems  Note. 1These equations contain the embedded error. The correct ones are: R1’: 29 * P = A; R1’: 29 * C = W. Data collection was done using the Read & Answer software (Vidal-Abarca & Cerdán, 2013). The software shows information units on the computer screen in a masked, unreadable way, but their ordered sequence is evident. When clicking on a unit, this unit becomes full readable, but the others are (re)masked and thus only one unit can be read at once. Read & Answer allows the readers to read the units in the order they want, and as many times as they need. Pressing a button, participants can move from problem screen to response screen, and the other way round. In the response screen there is a blank space to write the answer to the task. The answer can be modified as many times as needed. Read & Answer records the full sequence of actions taken by each participant and the time devoted to each action: unmasking information units, moving from one screen to the other, reading the task, or writing/modifying the answer. In an error detection study, Otero et al. (1992) found participants who detected embedded incoherencies but did not report them. Hence, a brief individual questionnaire was used in the present study to detect participants with inappropriate regulation. In the questionnaire, the embedded error was revealed, and then several questions were asked to know whether or not a) a participant detected the embedded error during the task and b) reported this detection, and c) if the experimental error was detected but was not reported, what was the reason why. Variables and Measures According to their written reports (i.e. written responses given to the proposed task), participants were classified as reporters or non-reporters of the embedded error. Inspired by the assumed theoretical model, a set of indexes were defined to describe participants’ monitoring behaviour in the task. These indexes are shown and related to the assumed theoretical model in Table 2. Table 2 Indexes Associated to the Process of Detecting and Reporting the Embedded Error 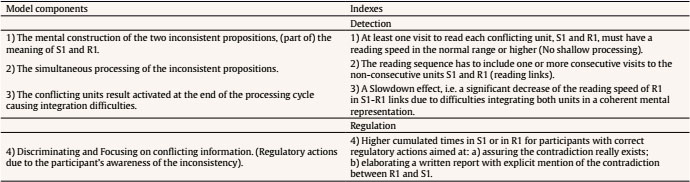 The indexes were computed as follows:
In addition, and because of regulatory actions done (i.e., re-readings to be sure of detection and re-readings to elaborate the report), reporters were expected to make a greater processing effort in S1 and R1 than non-reporters. In the present study, the “processing effort” for a unit uj was defined as the ratio between the reading time cumulated in uj, and the time needed to read uj once at normal speed. Therefore, individual differences in reading speed were taken into account to obtain comparable and unbiased values. Predictions The model assumed suggested the following predictions for the designed task:
Procedure Each participant completed the task in one of the experimental problems, randomly assigned to the computers in a specific room. The instructions explicitly included the purpose of the study, the task, and a brief explanation of the Read & Answer software. The task proposed to the students in the instructions was: “Judge the understandability of a completely solved algebra problem and report in writing anything you think is incorrect, nonsensical, inconsistent, or unintelligible. Try to clarify the location and reason for each reported issue, if any.” We tried to avoid a ‘seek for the error’ task that can skew student performance due to an increased awareness. A practice task was conducted using a worked-out example, similar to the experimental ones. This practice was useful to train participants in the use of the Read & Answer software and to clarify the task. Next, participants completed the experimental task at their own pace without any additional help. The task lasted less than 30 minutes. Immediately after this task, participants individually completed the questionnaire in a separated room. Responses to the questionnaires were used to increase the reliability of the classification of participants as reporters or non-reporters: some participants could show wrong regulation, i.e., they detected the embedded error but did not mention it. Task Outcomes: Participants’ Reports Forty-seven out of 94 participants (50.0 percent) correctly reported the embedded error as located in R1: “La primera ecuación de la resolución está mal. La correcta sería A = 29P. Por tanto, la solución final está mal” [“The first equation in the solution is incorrect. The correct one would be A = 29P. Therefore, the final solution is incorrect”] (student xxx66 AC); “El problema está mal resuelto (…). Sería al revés, es decir, A = 29C, por lo que C = 20 ml” [“The problem is poorly resolved ... It would be the other way around, that is, A = 29C, so that C = 20 ml”] (xxx86 AMM). Table 3 Percentages (and Number) of Reporters and Non-reporters Satisfying Behavioural Indices  Forty-seven students did not mention the error embedded in R1 and were called non-reporters. Some of them did not report any obstacle: “No he encontrado nada incorrecto, y creo que el enunciado del problema se entiende perfectamente” [“I have not found anything wrong, and I think the problem is perfectly understood”] (xxx46 PT). Others reported obstacles different from the embedded error (spurious obstacles): “Para mi hay 2 obstáculos: el primero es leer los números en letras; el segundo es que faltan imágenes” [“For me there are 2 obstacles: 1st, reading the numbers as letters; 2nd, missing images”] (xxx61 Pr22). We also analysed the responses given by non-reporters to the questionnaire and we did not find any participant detecting and non-reporting the embedded error. Here on, non-reporters were considered non-detectors of the embedded error. Figure 1 Processing Effort in the Conflicting Units S1and R1 for Reporters and Non-reporters, Compared to the Effort Made in the Remaining Textual or Algebraic Units. 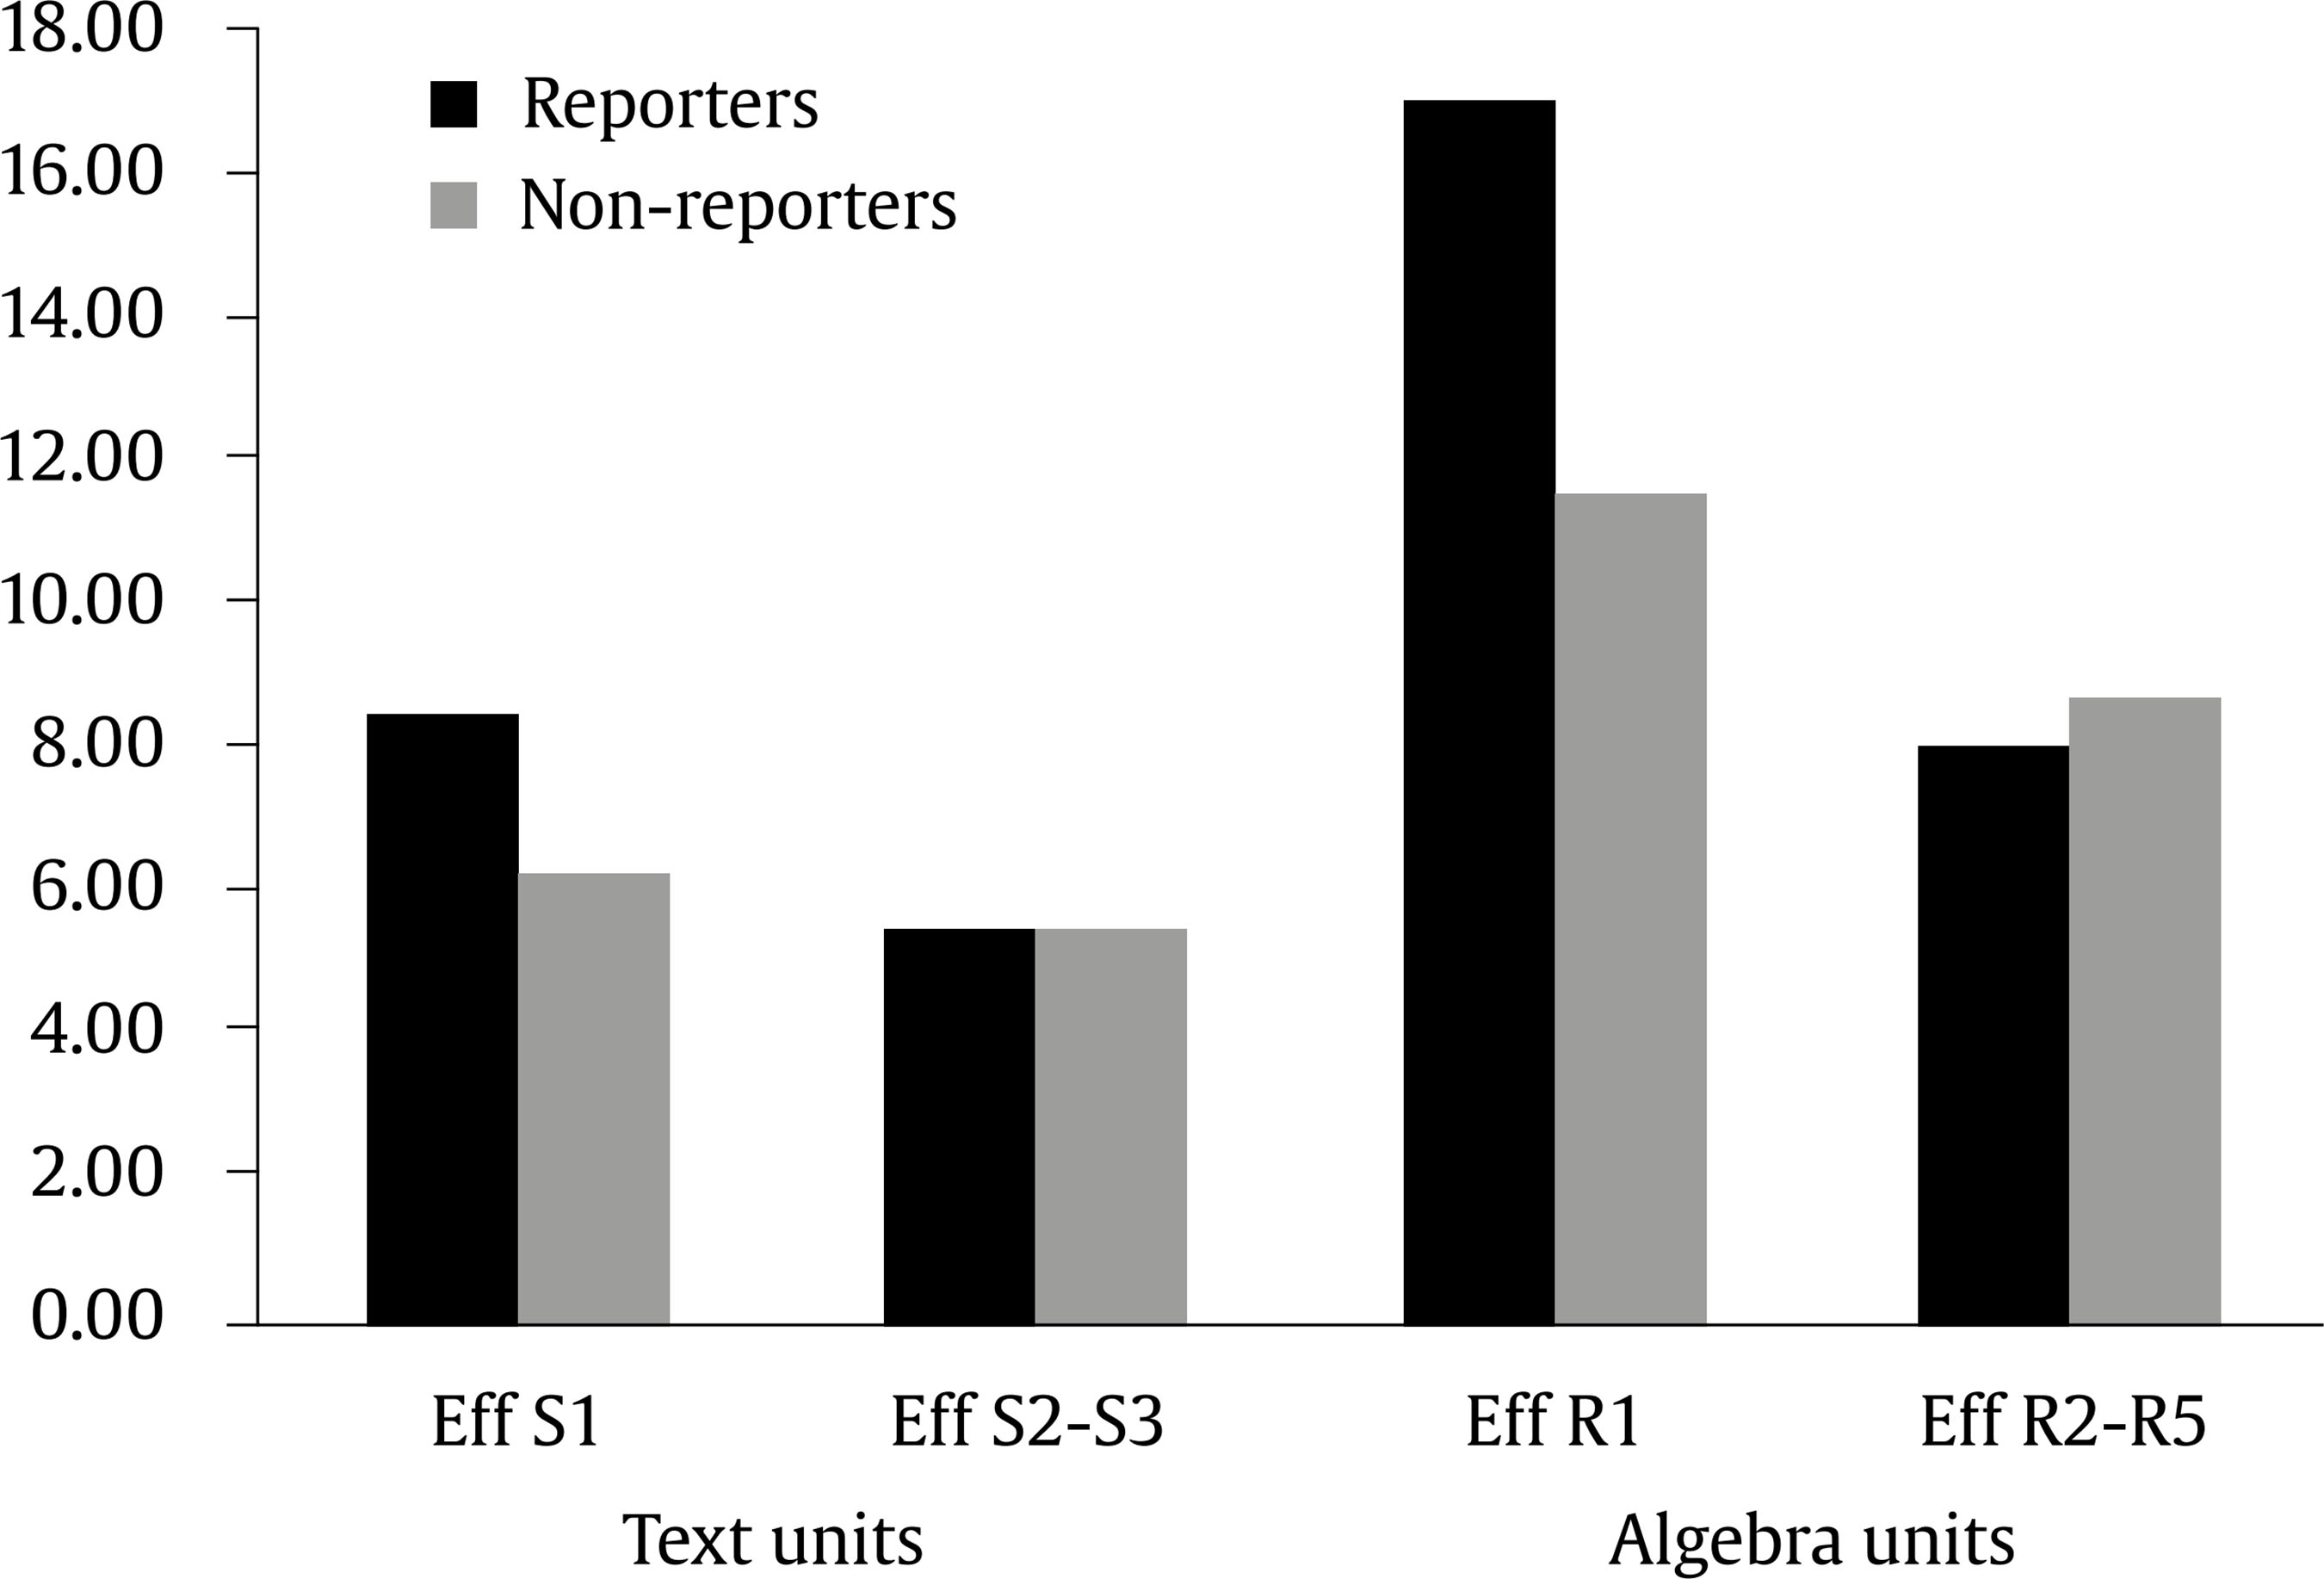 Behavioural Indexes for Reporters and Non-reporters Table 3 shows the percentages of reporters and non-reporters who satisfied defined behavioural indexes. Table 4 Main Data of the Logistic Binary Regression 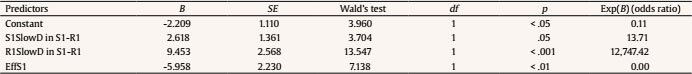 All the participants, reporters and non-reporters, read S1 and R1 at a normal pace at least once (index 1 in Table 2). Thus, fast reading was not the cause of monitoring difficulties. Reading links between S1 and R1 (index 2 in Table 2) were made at least once by 95.7 percent of reporters and 36.2 percent of non-reporters. Slowdowns in R1 in S1-R1 links (index 3) were observed in 95.7 percent of reporters, but only in 8.5 percent of non-reporters. Therefore, index 3 showed a high capacity to discriminate reporters from non-reporters. As the distribution of the processing effort concerns (index 4), a percentage of 76.6 percent of reporters made higher effort in both units, R1 and S1, than in the corresponding statement or algebra units averaged. This only happened in 29.8 percent of non-reporters. Therefore, index 4 did not show a high discriminating capacity. However, when mean values for reporters or non-reporters were considered, some differences appeared in the distribution of the processing efforts. Figure 1 shows these mean values. Predicting Correct or Poor Reporting from the Behavioural Indexes In order to evaluate the power of the set of defined indexes to correctly predict a correct reporting or not, a binary logistic regression was conducted for the dependent variable (reporters/non-reporters) taking the behavioural indexes as predictors: the existence or not, and the number of explicit S1-R1 links, the existence or not of slowdowns in R1 in S1-R1 links, the existence or not of slowdowns in S1 in S1-R1 links, the efforts made processing units S1, R1, S2-S3 (two units averaged), Sol, and R2-R5 (four units averaged). The efforts in the different units were transformed using the log function. In this way, these variables turned to be normal (K-S, p > .200 in all cases). When considered alone, these predictors were significant except the effort in S2-S3 and the effort in R2-R5. When a backward stepwise procedure was run, some important predictors were redundant and were left out (existence and number of S1-R1 links, effort in R1). Only the existence or not of slowdowns in S1 in S1-R1 links (S1SlowD in S1-R1), the existence or not of slowdowns in R1 in S1-R1 links (R1SlowD in S1-R1), and the effort in S1 (EffS1) remained in the equation. The model significantly fit the data: omnibus test: χ2(3) = 105.83, p < .001. Together, these three variables explained a large percentage of the variance of the dependent variable (-2 log likelihood = 24.48, Cox & Snell R2 = .68, Nagelkerke R2 = .90) and a global 94.7 percent of cases were correctly classified. Table 4 shows the relevant data of the binary logistic regression. The existence or not of slowdowns in R1 in S1-R1 links was the most important predictor (Nagelkerke R2 = .84), and the existence or not of slowdowns in S1 in S1-R1 links was the less important one (adding 2 percent points to R2). The effort in S1 obtained a negative coefficient in the regression. However, since the effort in S1 has a positive coefficient when considered alone, this is merely a mathematical effect to correct an overprediction obtained with the other two variables. Table 5 shows the observed and predicted result in the task (reporter/non-reporter). Table 5 Observed versus Predicted Number of Reporters and Non-reporters after the Binary Logistic Regression  As can be observed in Table 5, the probability of being a reporter when the predicted behaviour was performed (according to the predictors in the resulting logit regression), was .94. The probability of being a non-reporter when the expected behaviour was not performed was .96. Conversely, the observed product of the task (correct reporting of the embedded error/failed reporting) could be used to infer a participant’s probable behaviour when processing the information provided. The probability of performing the predicted processing behaviour when a correct report was observed was .96, since behavioural indexes were satisfied by 95.7 percent of the (observed) reporters. Only two anomalous reporters did not behave as predicted by model-based indexes. These cases will be analysed in the Discussion section below. In addition, the probability of any of the predicted processing actions was not performed when a failed reporting was observed reached .94, since 93.6 percent of the observed non-informants did not meet at least one of the behavioral indexes. Finally, the accuracy of the prediction made by the binary logistic regression was .95. Predictions for reporters were fulfilled in a high proportion of cases. In addition, the results obtained suggested different behavioural patterns for competent or poor monitors in the task, as described by behavioural indexes. Model-Predicted Behaviour for Reporters All the reporters but two (95.7 percent) fitted the predictions of the theoretical model, according to defined behavioural indexes. All of them processed R1 and S1 in a non-superficial way, and 95.7 percent showed a slowdown in R1 in some S1-R1 link. Longer times when reading conflicting units, compared to non-conflicting units, have also been observed in previous experiments (Van der Schoot et al. 2012). Using refutation texts Mason et al. (2019) observed delays in response times attributed to participants’ inhibition of a prior knowledge inconsistent with the text. However, two anomalous reporters appeared. One of the unfitting reporters (participant xxx94 BdT) did not explicitly link R1 to S1 in his reading sequence (index 2). He detected the absurd numerical result from his prior knowledge about usual schools, but he probably assumed that it was due to a letter-switch mistake and not to a translation error. Therefore, he initiated a backwards processing from R4 to R1 searching for the first time A and P were reversed. In this way he did not need to re-read S1, and then no links appeared between S1 and R1. The other anomalous reporter (participant xxx58 LF) did not show any slowdown in R1 associated to S1-R1 links (index 3), but she satisfied indexes 2 and 4 and made slowdowns in R1 out of S1-R1 links. This participant was probably able to carry part of the meaning of S1 (‘there is more students than teachers in a school’), well-known information, over several cycles to link it with R1 in an implicit, unobservable manner. Model-based Behavioural Indexes for Non-reporters In addition to the model-based predictions for reporters, 91.5 percent of non-reporters (43 participants out of 47) did not show any reading slowdown in R1 in S1-R links (index 3). Only 8.5 percent of non-reporters (n = 4) showed at least a slowdown in R1 in a S1-R1 link. This suggests that these students had difficulties integrating S1 and R1. However, they reported spurious errors in the monitoring task attributed to R1. Hence, they probably built some inappropriate meaning for R1 (poor construction of propositions), causing integration difficulties different from the predicted one. Among non-reporters without any slowdown in R1 in S1-R1 links, 63.8 percent (n = 30) did not make any S1-R1 link. This alerts to a possible lack of metacognitive skills in adult students. Long time ago Vosniadou et al. (1988) observed that most children were unable to detect inconsistencies in a text because they had difficulties to re-activate preceding propositions to be processed with other subsequent contradictory propositions. When the two contradictory propositions were simultaneously (re)activated, children detected the contradiction. In terms of the CI model (Kintsch, 1998), this suggested that children’s difficulties appeared in the construction phase, but not in the integration phase once the construction of the propositions was appropriate. In our study, if those non-reporters had processed S1 and R1 together making deliberated S1-R1 reading links, they probably would have detected the contradiction. As the translation of the units into the same language is an overloading process, carrying previously read information over several cycles can be difficult. Thus, the absence of explicit reading links between S1 and R1 could cause monitoring failures in these students. Changes in the reading sequence, as reading back to link distant pieces of information, have also been observed using eye tracking techniques when people process inconsistent or difficult information (Hyönä et al., 2003). When comprehension fails, readers try to overcome comprehension obstacles by re-reading previous text segments to re-establish coherence. Rinck et al. (2003) used texts with embedded temporal inconsistencies in separated sentences. Readers could report any comprehension obstacle they found. Specific differences between reporters and non-reporters were obtained in (a) the number of reading regressions linking both contradictory propositions in the text and (b) the reading speed in the 2nd contradictory proposition after the regressions. When regressions to re-read were impeded, readers had additional difficulties and comprehension was greatly compromised (Schotter et al., 2014), even in normal reading (Rayner et al., 2016). The remaining 27.7 percent (n = 13) of non-reporters made S1-R1 links without any slowdown in R1. Thus, they seemed to integrate S1 and R1 without special difficulties. According to the assumed theoretical model, this lack of integration difficulties could be due to a suppression of one of the two inconsistent propositions (for instance, the part of R1 meaning that there would be more teachers than students at that school) or to the incorrect or poor construction of any of the inconsistent propositions (for instance, when a student accepted the reversal error in R1 as correct). A detailed analysis showed that 10.7% (5 students) reported spurious errors caused by poor construction of meaning; 4.2% (2 students) agreed with the offered resolution accepting the reversal error in R1 as correct, probably due to poor construction of propositions as well; 12.8% of non-reporters (6 students) reported that something was wrong in the resolution without any mention of the error in R1. These participants seemed unable to find the embedded error in R1 despite searching for it, probably due to the suppression or one of the inconsistent propositions (for instance, the part of R1 meaning that there were more teachers than students at that school). In sum, and according to the theoretical model, 23.4 percent of non-reporters seemed to show poor or wrong construction of propositions (mainly R1), 63.8 percent achieved low levels of coherence in their mental representations mainly due to lack of reading links in an overloading task, and 12.8 percent probably suppressed one of the inconsistent propositions when they processed them together. In addition, reporters seemed to focus their processing effort on the conflicting units more than non-detectors in average. However, index 4 by itself did not properly discriminate regulatory actions made by reporters or non-detectors. Regulation can be a complex process (Chinn & Brewer, 1993), and additional work is needed to validate well-articulated models for regulation. A specific combination of behavioural indexes 4 and 3, given by a binary logistic regression, correctly discriminated reporters from non-reporters in a 94.7 percent of the cases. The observed competent monitoring could be correctly associated to the model predicted processing behaviour in 95.7 percent of the reporters, and the poor monitoring could be correctly associated to a failure in the expected behaviour in 93.6 percent of non-reporters. Additional Data In the experimental task used in the present study, participants showed global poorer monitoring than expected according to their education level (postgraduate engineers). This poor monitoring ability has been found in academic problem-solving (Baars Van Gog et al., 2014, 2017; García et al., 2016; Nelson & Fyfe, 2019). In these studies participants showed poor calibration due to extra confidence although they were strategic in their help-seeking decisions. Low levels of monitoring in secondary students were also reported in a reading-for-answering monitoring task by Sanjosé et al. (2010). In their experiments only about 46 percent of participants were able to reject a ‘matching words’ strategy, i.e., selecting inappropriate information made of the same words as present in questions asked, to elaborate incorrect answers. In addition to overconfidence, the low level of achievement in the present study could also be due to the difficulty of the monitoring task, which was harder than expected for the participants. This conjecture is supported by the low mean reading speed obtained in the present study for textual units, 106 words per minute, compared to the values of 200-400 words per minute obtained in other studies for adult normal reading (Rayner et al., 2016). Regarding algebra units, only few studies reported reading speeds. Andrà et al., (2015) obtained a mean value of about 240 ms/symbol for students’ average fixation times reading algebraic expressions. This mean value is very similar to the mean value obtained if experts’ data obtained by Jansen et al. (2007) is applied to units R1-R5 of the experimental problem used in the present study. However, in the present experiment participants’ mean reading speed was clearly slower, 536 ms/symbol (SD = 335), or 112 algebra symbols per minute. The great difference with previous studies can be explained by the different tasks to be performed: reading for comprehension and checking for coherence in the present study, or only reading algebraic expressions in previous studies. Limitations The present study has limitations caused by different factors. First, varied monitoring tasks and experimental working-out examples should be used in future studies. Second, participants had algebra knowledge and problem-solving expertise higher than secondary students. These last students would probably show cognitive in addition to metacognitive difficulties when doing a task as the proposed here. Therefore, the present study should be conducted with secondary students to increase reliability of results. Conclusions The theoretical model used in the present study—an extension of Otero and Kintsch’s (1992) mechanism of inconsistency detection to worked-out examples of algebraic nature—suggested specific predictions for reporters’ (competent monitors’) behaviours in the monitoring task. These behaviours were characterized by a set of process-based indexes. The predicted behaviour was observed in a high percentage of competent monitors, with only two exceptions. Beyond the model prediction, the defined process-based indexes were also tested in their power to correctly discriminate competent from poor monitors’ behaviour. A binary logistic regression for the reporters/non-reporters variable correctly classified a very high percentage of cases from a specific combination of behavioural indexes. Probabilities for the association of the observed outcome in the task (correct reporting or not) with the predicted processing behaviour reached high values. Therefore, if these results were replicated in a variety of situations and worked-out examples, a student’s observed competency or poor monitoring in this task should be associated with a specific processing behaviour with high reliability and teachers could help them in a more specific, accurate way. For instance, teachers could assume with a low risk that observed students’ poor monitoring could be mainly due to an insufficient effort devoted to attain high global coherence in their mental representations or to great difficulties to construct some important propositions (for instance, the meaning of R1 in the present study). Second, teachers must expect students’ reading speeds of worked-out examples as low as those reported here (about 106 words and 112 symbols per minute, i.e., about three times slower than students’ reading speeds for usual texts) when studying worked-out examples carefully. Faster reading (or fast explanations!) will probably be associated to shallow processing. Conflict of Interest The authors of this article declare no conflict of interest. Acknowledgement Authors thank members of “ERI-Lectura”, University of Valencia, Spain, for providing them with the Read & Answer software. Cite this article as: Sanjosé, V., Gómez-Ferragud, C. B., Verdugo-Perona, J. J., & Solaz-Portolés, J. J. (2021). Testing a model for the monitoring of worked-out algebra-problem examples: From behaviours to outcomes on a math task. Psicología Educativa, 28(2), 141-149. https://doi.org/10.5093/psed2021a25 References |
Cite this article as: Sanjosé, V., Gómez-Ferragud, C. B., Verdugo-Perona, J. J., & Solaz-Portolés, J. J. (2022). Testing a Model for the Monitoring of Worked-out Algebra-Problem Examples: From Behaviours to Outcomes on a Math Task. PsicologĂa Educativa, 28(2), 141 - 149. https://doi.org/10.5093/psed2021a25
vicente.sanjose@uv.es Correspondence: vicente.sanjose@uv.es (V. SanjosĂ©).Copyright © 2026. Colegio Oficial de la Psicología de Madrid


 PDF
PDF e-PUB
e-PUB CrossRef
 JATS
JATS Imprimir
 Enviar
ALERTA POR E-MAIL
La Revista de Psicología Educativa está distribuida bajo una licencia de Creative Commons Reconocimiento-NoComercial-SinObra Derivada 4.0 Internacional.com