FoCo: A Shiny App for Formative Assessment using Cognitive Diagnosis Modeling
[FoCo: una aplicaci├│n Shiny para la evaluaci├│n formativa usando modelos de diagn├│stico cognitivo]
Susana Sanz1, Rodrigo S. Kreitchmann1, 2, Pablo Nájera1, José David Moreno1, José Ángel Martínez-Huertas3, and Miguel A. Sorrel1
1Universidad Aut├│noma de Madrid, Spain; 2IE University, Madrid, Spain; 3Universidad Nacional de Educaci├│n a Distancia, Madrid, Spain
https://doi.org/10.5093/psed2022a14
Received 18 March 2022, Accepted 27 October 2022
Abstract
Combining formative and summative evaluations could improve assessment. Cognitive diagnosis modeling (CDM) has been proposed as a tool for diagnosing students’ strengths and weaknesses in formative assessment. However, there is no user-friendly software to implement it. For this reason, a Shiny app, FoCo, has been developed (https://foco.shinyapps.io/FoCo/), to conduct CDM and classical test theory analyses. The responses from 86 undergraduate students to a research methods course examination were analyzed. Students’ strengths and needs were diagnosed concerning their dominance of the syllabus contents and the first three competencies in Bloom’s taxonomy. The validity of the results was analyzed. The exam showed acceptable about evaluating students’ knowledge, as students with similar scores showed different strengths and weaknesses. Additionally, these attributes were found to predict different relevant criteria. It is expected that FoCo’s easiness to use promotes the employment of CDM in real educational settings.
Resumen
La combinación de evaluaciones formativas y sumativas podría mejorar la evaluación. El modelado de diagnóstico cognitivo (MDC) se ha propuesto para diagnosticar fortalezas y debilidades de estudiantes en la evaluación formativa. Sin embargo, ningún software permite implementarlo fácilmente. Así, se ha desarrollado FoCo (https://foco.shinyapps.io/FoCo/), permitiendo realizar análisis MDC y teoría clásica de tests. Se analizaron respuestas de 86 estudiantes de grado a un examen de métodos de investigación, diagnosticándose sus fortalezas y necesidades en cuanto a su dominio de los contenidos de la asignatura y las tres primeras competencias de la taxonomía de Bloom y se analizó la validez de los resultados. El análisis ha sido informativo, ya que para estudiantes con puntuaciones similares ha sido posible detectar diferentes fortalezas y debilidades. Además, se encontró que estos atributos predicen criterios relevantes. Se espera que FoCo facilite el uso de MDC en contextos educativos.
Palabras clave
Evaluaci├│n formativa, Aplicaci├│n inform├ítica, Modelado de diagn├│stico cognitivo, ├Źtems de opci├│n m├║ltipleKeywords
Formative assessment, Computer application, Cognitive diagnosis modeling, Multiple-choice itemsCite this article as: Sanz, S., Kreitchmann, R. S., Nájera, P., Moreno, J. D., Martínez-Huertas, J. Á., & Sorrel, M. A. (2023). FoCo: A Shiny App for Formative Assessment using Cognitive Diagnosis Modeling. Psicolog├şa Educativa, 29(2), 149 - 158. https://doi.org/10.5093/psed2022a14
Correspondence: rschames@faculty.ie.edu (R. S. Kreitchmann).Educational evaluation has been traditionally linked to the scoring or grading of students’ tests or assignments (Fraile et al., 2017). This practice, known as “summative assessment”, might be of great utility for various purposes, such as providing an estimation of a student’s level of proficiency or ranking students’ curriculums for college admissions or scholarship grants (de la Torre & Minchen, 2014). However, summative assessment constitutes a small portion of educational assessment, which should focus not only on students’ levels of knowledge but also on the educational process itself (e.g., García-Martín & García-Sánchez, 2018). Thus, matters like providing individualized feedback to improve learning and self-regulation, analyzing whether the teaching practices are being effective, or deciding whether to proceed with the course syllabus or to go over a difficult topic, should also be considered part of the definition of educational assessment, as it can increase students’ motivation and to enhance their perception about their learning processes and basic competencies acquisition (Cerezo et al., 2019; Marchesi & Martín, 2014; Santos & Matas, 2007). Assessments that are concerned with these matters, usually referred to as “formative assessments”, have been demanded for a long time. However, this assessment is still underused in many educational programs and should be aligned with a summative assessment to guarantee its effectiveness (Bennett, 2011). Thus, aiming to increase the accessibility to some components of formative assessment, an increasing number of research has been conducted in the field of “cognitively diagnostic assessment” (CDA) in the last few years. CDA refers to the identification of students’ strengths and weaknesses to provide diagnostic information that can be used to provide detailed feedback, design remediation classes, and guide subsequent teaching efforts (de la Torre & Minchen, 2014; Fan et al., 2021; Sessoms & Henson, 2018). CDA is closely related to formative assessment and might be considered one of its pillars (Paulsen & Svetina, 2021). Among the different strategies used to obtain students’ diagnostic information, “cognitive diagnosis models” (CDMs), also known as diagnostic classification models, have become the most appealing approach. Since their early conceptualization (Tatsuoka, 1983), interest and developments in CDM have increasingly grown (von Davier & Lee, 2019). The main feature of CDMs is their ability to determine whether an examinee masters or not a series of narrowly defined, discrete “attributes” (i.e., skills, cognitive processes, competencies; Sorrel et al., 2016). In other words, CDMs classify examinees in “attribute profiles” based on their responses to test items. When the examinee has answered correctly enough responses related to the attribute and based on the response patterns and the estimated item parameters, the posterior probability can be obtained and considered if the examinee masters the attribute. These attributes are selected by the teacher or lecturer and are usually related to the particular subject and decided before writing the items of the test. The first step in CDM applications is usually the construction of the so-called “Q-matrix” (Tatsuoka, 1983). Q-matrix is a content specification matrix of dimensions J items × K attributes in which each cell adopts a value of either 1 or 0 depending on whether item j measures attribute k or not, respectively. Table 1 provides an example of a Q-matrix with three attributes and J items. As it can be seen, it is necessary to master attribute A to correctly answer item 1, whereas item 2 requires attributes A and C. Table 1 Sample Q-Matrix 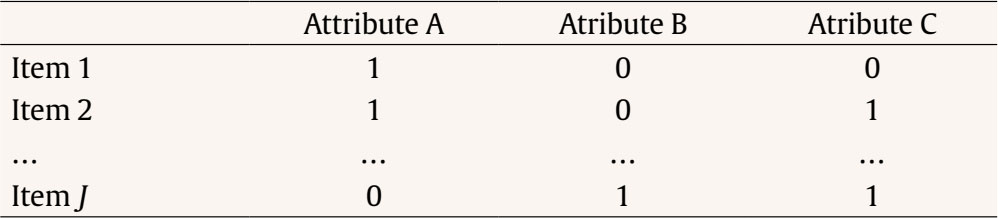 To construct a Q-matrix, it is common to rely on a panel of domain experts, who first provide their opinions and then discuss disagreements in subsequent steps until consensus is reached. Although still scarce, CDM applications have been gradually increasing together with recent theoretical developments. Sessoms and Henson (2018) revised CDM applied studies that included 36 papers from 2009 to 2018. The main topics addressed in the papers were math evaluation (47% of the papers; e.g., Bradshaw et al., 2014) and reading (39%; e.g., Chen & Chen, 2016). Other CDM applications have focused on assessing foreign language mastery (e.g., Fan et al., 2021), proportional reasoning (Tjoe & de la Torre, 2014), psychosocial research evaluation skills (Jurich & Bradshaw, 2014), or students’ competencies (Sorrel et al., 2016; Testa et al., 2018). Even though the studies usually have been done with very large samples (e.g., Bradshaw et al., 2014; Xu & von Davier, 2006), they can be conducted without those demanding sample size requirements. In this sense, some studies have shown the applicability of CDMs in classroom-level settings (Chiu et al., 2018; Jang et al., 2015). Previous simulation studies have shown that sample size has a relevant impact on parameters’ estimation reliability (e.g., Rojas et al., 2012; Sen & Cohen, 2020; Sorrel et al., 2021). However, it seems to have no impact on the precision of the attributes profile classification (Paulsen & Svetina, 2021). The “general deterministic, input, noisy and gate” model (G-DINA; de la Torre, 2011) is a popular, saturated CDM in which examinees’ probabilities of correctly answering an item linearly depend on the attributes (both main and interactions effects) mastered by them: where αij* is the reduced attribute profile of examinee i whose elements are relevant to solve item j; Kj* is the number of attributes required to solve item j; δj0 is the baseline probability of item j; δjk is the main effect due to ; αik is the interaction effect due to αik and αik' ; and δj12...K*j is the interaction effect due to αi1, ..., αik'. Note that αik is binary and represents whether examinee i masters attribute k(αik = 1) or not (αik = 0). From here, the likelihood of the date can be directly computed (Eq. 2), as well as the posterior probabilities of each examinee to have attribute profile l. where Xi is the response vector of examinee i, αl is attribute profile l among all possible attribute profiles, and P(Xij=1|αl) is the probability of correctly answering item j for examinee i given that he/she belongs to attribute profile l. Attribute profile classifications can be made with the maximum likelihood estimator, i.e., each respondent is assigned to the attribute profile that provides the highest L(Xi|αl), or using Bayesian methods. Regarding the latter, Bayesian estimation can be done using a “maximum a posteriori” (MAP) estimator, which assigns each examinee to its most probable attribute profile, or an “expected a posteriori” (EAP) estimator, which computes separately the examinee’s probabilities of mastering each of the attributes and then specifies their mastery or non-mastery of each attribute based on a threshold (e.g., .50). So, when the probability of mastering an attribute is higher than the value assigned to the threshold, it is considered than the examinee masters the attribute. Despite the growing number of research involving CDMs, applied studies are still scarce, especially for small-scale assessments. The application of CDMs at the classroom level in schools and universities is of special interest since formative and diagnostic assessments can be particularly beneficial in these contexts where feedback and remedial actions can be applied by the teacher. In this context, two of the few studies available to date are Ren et al. (2021) and Wu (2019). Wu showed in a quasi-experiment that students taking remedial instructions fed by CDM output performed better in a later phase compared to students receiving a traditional group-based remedial instruction. Similarly, Ren et al. (2021) illustrated how an intervention based on the output offered by CDMs led to better performance on the competencies assessed, compared to a control group where a general intervention not guided by CDMs was conducted. However, the revision of Sessoms and Henson (2018) noted that many empirical applications do not report relevant indicators, such as fit or reliability indices. This problem might be partially due to the lack of accessible and user-friendly software for CDM. Although different options are available, many of them are commercial software (e.g., Mplus and Latent Gold; Muthén & Muthén, 1998-2013; Vermunt & Magidson, 2013), and require some programming knowledge. This is even more pronounced in the Spanish-speaking context where, to the authors’ knowledge, no CDM empirical studies have been conducted. Given the above, the present study aims to introduce FoCo, a new, user-friendly online program to facilitate the incorporation of CDM in educational settings. For this purpose, we illustrate its usability through an empirical application with real data. FoCo is programmed in Shiny package (Chang et al, 2021) developed under the R software framework (R Development Core Team, 2021; version 4.1.0). FoCo helps to analyze multiple-choice questionnaires or tests and provides several classical test theory (CTT) indicators, including descriptive statistics, alpha (Cronbach, 1951) and omega (Green & Yang, 2009) reliability indices, and discrimination indices for distractors (Attali & Fraenkel, 2000). Additionally, if the user specifies a Q-matrix, FoCo estimates a CDM model via the GDINA package (Ma & de la Torre, 2020), and then provides model-fit and reliability indices, plus examinees’ attribute profile classifications. For large-scale assessments, empirical Q-matrix validation is also available (Nájera, et al., 2021). FoCo is currently written in Spanish. More technical information, as well as a brief tutorial, can be found in the FoCo user’s guide which can be downloaded from the program’s URL: https://foco.shinyapps.io/FoCo/. Participants The empirical illustration of the utilities of the FoCo app was conducted in a real context of evaluation with undergraduate students. Specifically, 87 undergraduate students from a public university in Spain were evaluated in a mandatory subject based on the main research methods for psychologists. Instruments A partial exam and a final exam designed to evaluate the learning of the syllabus contents of a research methods course were considered. The partial exam was composed of 20 multiple-choice items with three response options. Lastly, the final exam was composed of 40 multiple-choice items with three response options. The FoCo app illustration was conducted using the responses in the final exam. Procedure Two alternative Q-matrices were specified to diagnose students concerning 1) their mastery of the subject contents (Basic concepts, Descriptive methods, and Experimental methods), and 2) their mastery of the first three cognitive processes outlined by Bloom’s taxonomy (Knowledge, Comprehension, and Application; Bloom et al., 1956) to the course content. As proposed by Bloom, these cognitive processes follow a hierarchical structure (i.e., with each process requiring the mastery of the previous ones), which was incorporated in the specification of the Q-matrix and subsequent analyses. Accordingly, the hierarchical structure followed in the analyses was linear and explicit, and the restriction of the attribute profiles that cannot exist (e.g., mastering Application without mastering Knowledge) was imposed (Akay & de la Torre, 2020). It is considered that an examinee i mastered an attribute k (αik = 1) when the probability of mastery is higher than .50. Regarding the Q-matrix of course content domains (see Table 2), firstly, “basic concepts” referred to the general scientific concepts required when working with any type of research (type of variables, reliability, validity…). Secondly, “descriptive methods” are related to descriptive and qualitative methods, such as observational, interview, ethnographic, single case, and action research methods, and qualitative data analyses. Finally, “experimental methods” have to do with experimental between/within-subjects, factorial designs, quasi-experimental designs, and ex-post-facto designs. Regarding the Q-matrix specifying the cognitive domains of each item, firstly, “knowledge” refers to the recall of previously learned materials. Examinees that master this competence would be able to select the correct answer based on the memorized information, with little or no abstraction. Secondly, “comprehension” is related to abstract understanding. Examinees mastering this competence must be able to identify and interpret contents in applied situations, beyond the theoretical definition. Finally, “application” involves problem-solving through the employment of knowledge and techniques previously acquired in a different context. Examinees mastering this competence must be able to understand and generalize the knowledge acquired in the subject to new research situations, make correct decisions, and select the most adequate procedures. An expert task based on a Delphi method (Linstone & Turoff, 1975) was conducted along three phases to specify both Q-matrices. Five independent and trained experts used the above attribute definitions and the items of the exam to generate their Q-matrices. Fleiss’ (1971) kappa was calculated to estimate the multiple inter-rater agreements. Then, the five anonymized matrices and the agreement rate for each attribute were sent back to the experts to allow them to revise the matrices and make the modifications they considered appropriate after seeing the other experts’ matrices. With these revised Q-matrices, new values for kappa were calculated and sent back to the experts. In the final phase, the experts were gathered to discuss their Q-matrices, solve the final discrepancies and propose the definitive Q-matrices. Table 3 presents the inter-rater agreement of the Delphi method in each phase. As it can be seen, following Landis and Koch’s (1977) recommendations, the initial agreement was at least a substantial agreement in every domain, being higher for the matrix of content domains than the one for the cognitive domains. Both matrices showed agreement scores from substantial to almost perfect in phase 2. The total agreement was reached at phase 3. Complete Q-matrices for the 40-item test that resulted from the Delphi method process is in Table 2. Tabla 2 Q-Matrices 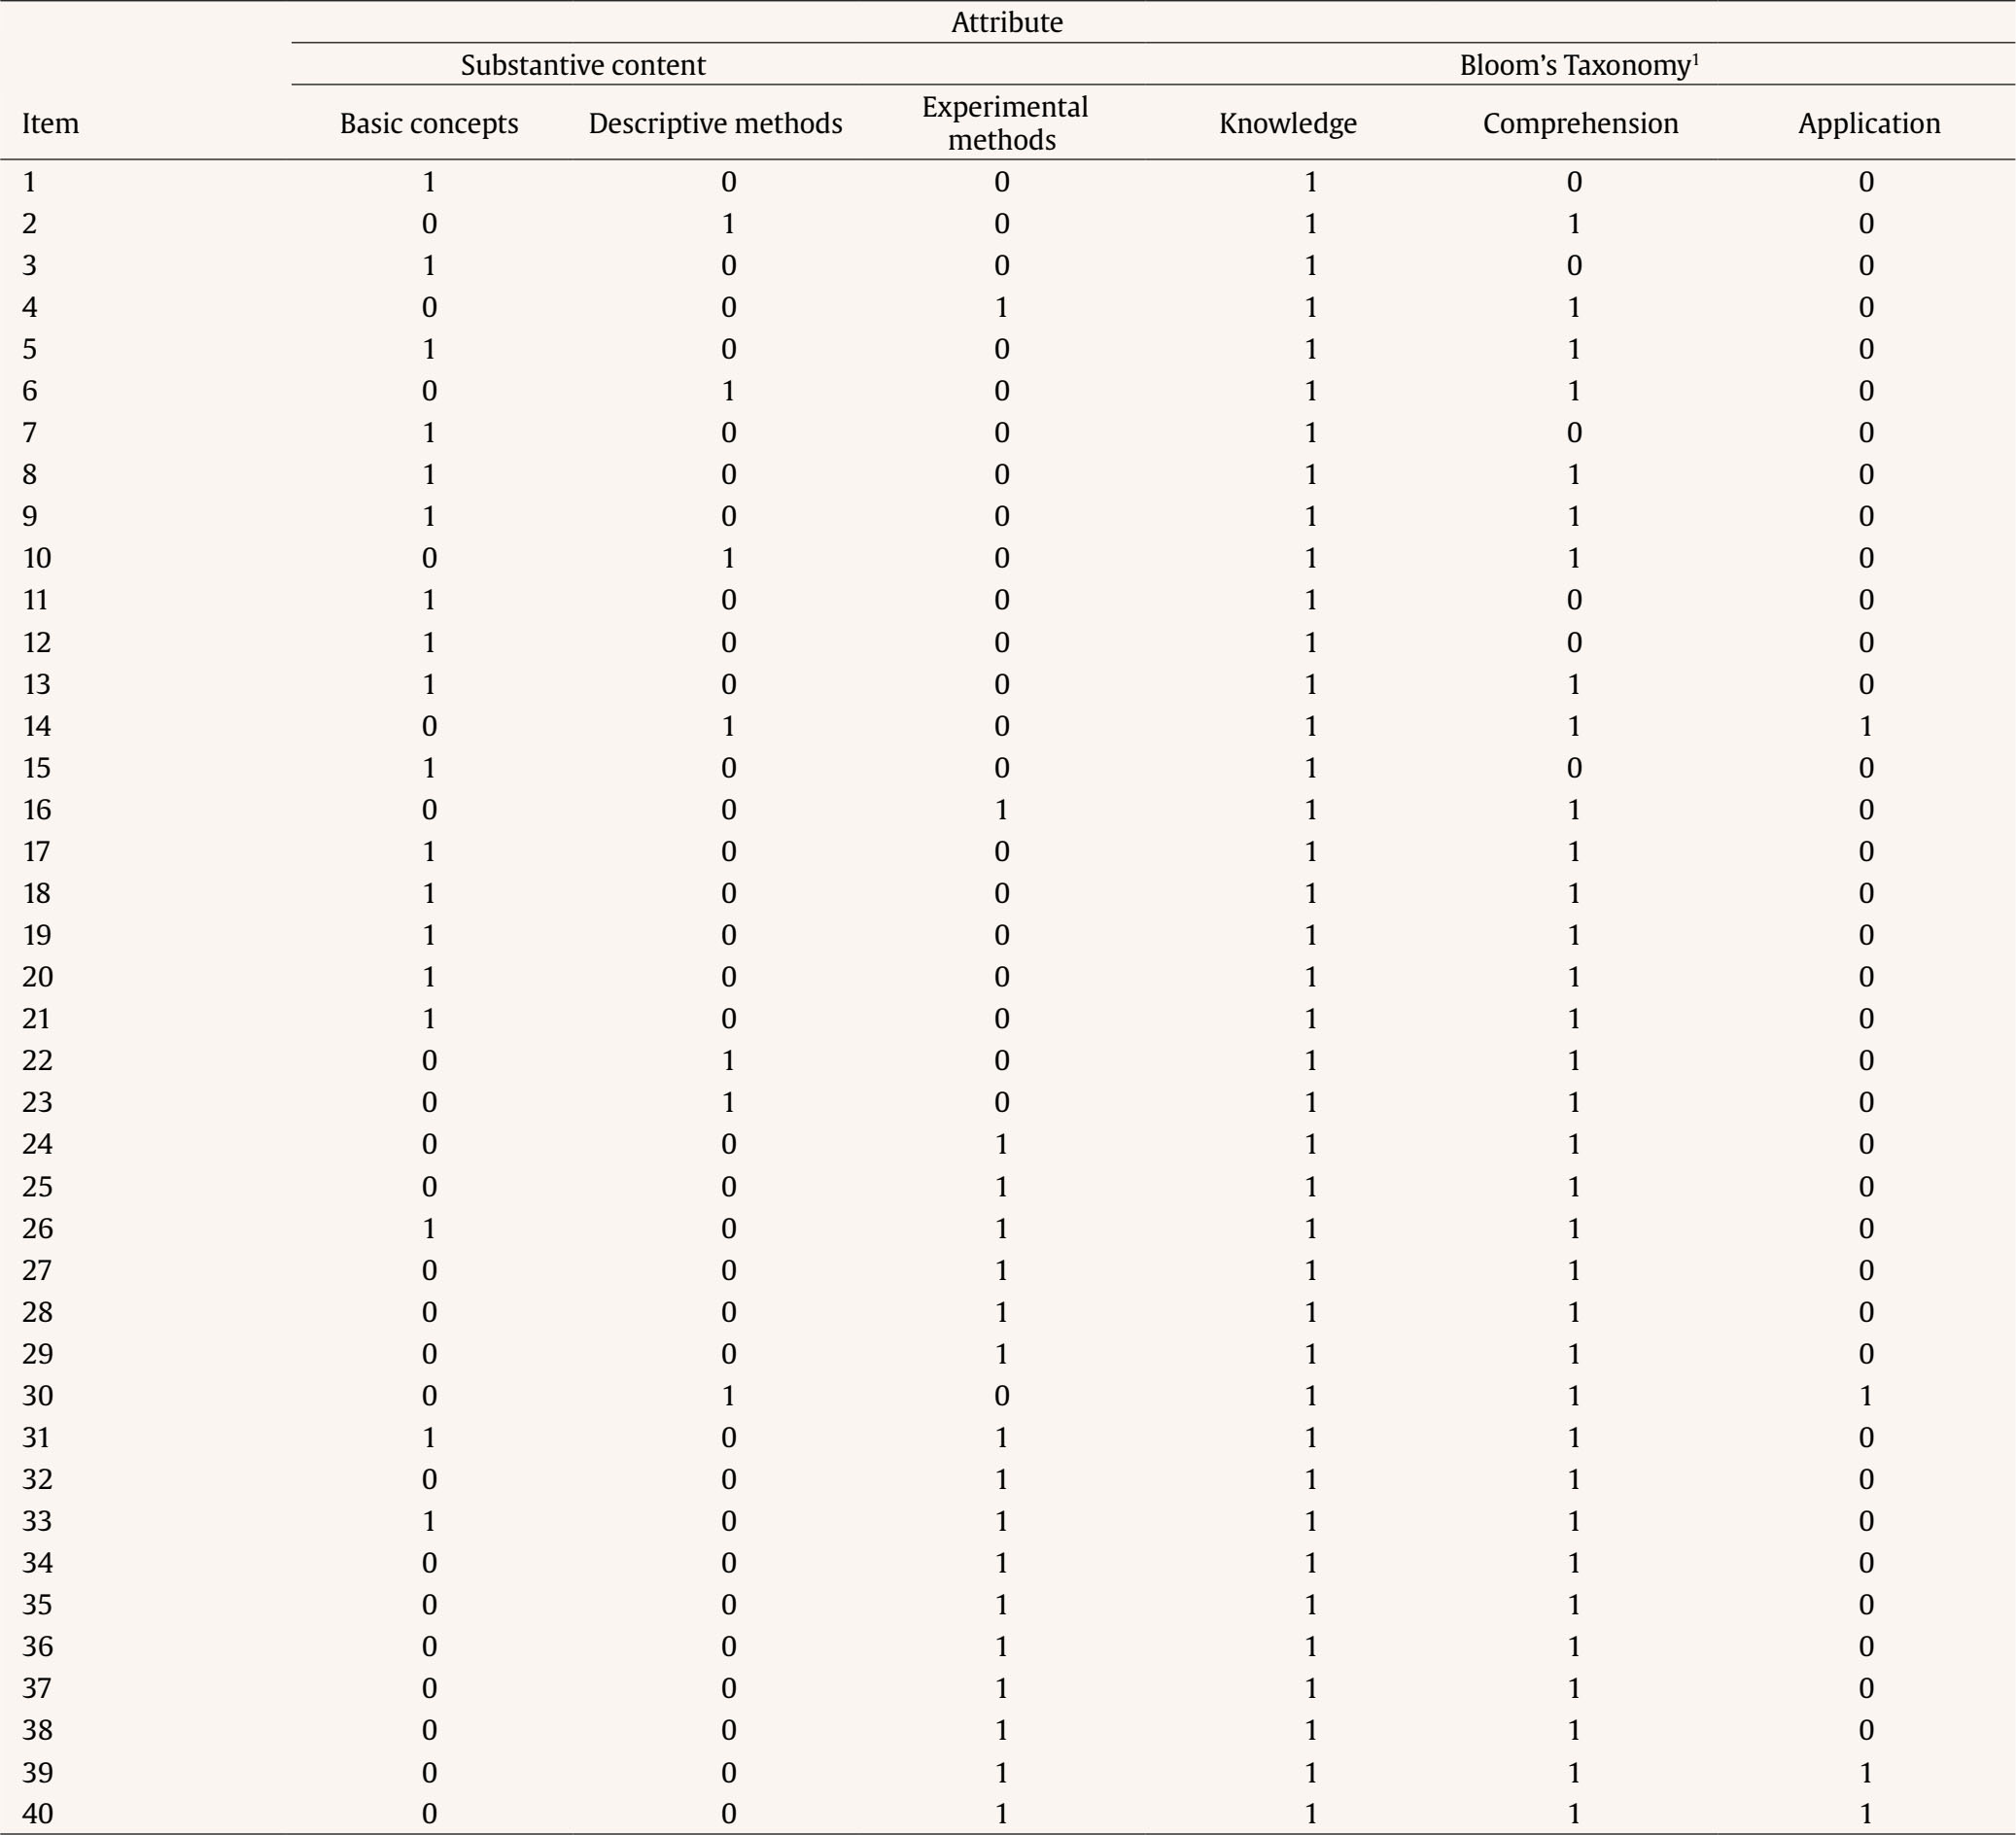 Note. 1 = the attribute is required to solve the item; 0 = the attribute is not required to solve the item. 1Bloom’s taxonomy Q-matrix was created and analyzed as explicit hierarchical to reflect the theoretical structure. Data Analysis The item responses of the final exam and the proposed Q-matrices were analyzed with the FoCo app. Firstly, different analyses were performed to assess the overall reliability of the sum scores and the item quality. Cronbach’s α and Green and Yang’s (2009) ω reliability indices were computed. Mean (and standard deviations) of item quality indicators in the complete test and by attributes were analyzed. Item difficulty, computed as the proportion of election of the correct answer, and item discrimination, considered as the degree to which the item is useful to differentiate between examinees with higher scores and students with lower scores, were also calculated. The item quality was graphically examined, and items were considered as functional if they fulfilled two criteria: difficulty between .20 and .90 and discrimination larger than .20 (Abad et al., 2011). Moreover, the quality of item distractors (Attali & Fraenkel, 2000) was considered for the assessment of items’ performance. Secondly, different analyses were performed using CDM. The two models (measuring content and cognitive domains, respectively) were estimated using the G-DINA model (Eq. 1). As previously indicated, the hierarchical constraints outlined in Bloom’s taxonomy (i.e., the mastery of each process requires the mastery of the previous/simpler ones) were set for modeling the cognitive domains. Model fit was evaluated for each Q-matrix, considering two different absolute fit statistics: Limited-information statistic M2, used in CDM models with dichotomous responses (Liu et al., 2016), as well as RMSEA2 (and its confidence interval). In the case of M2, the null hypothesis of good-of-fit is maintained when p > .050. RMSEA2 values below .030 indicate an excellent fit, and below .045 indicates a good fit (Liu et al., 2016). These results provide positive evidence for the appropriateness of the G-DINA model (Eq. 1) with these data. Table 3 Mean Inter-Rater Reliability through the Delphi Method Process 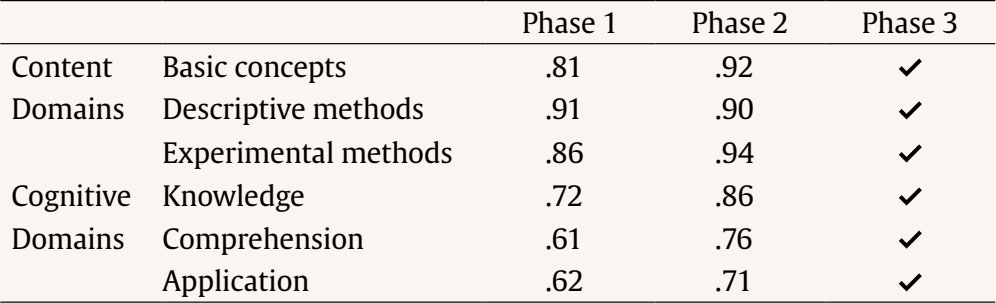 Note. Ôťö = total agreement was reached. For both content and cognitive domain models, the attribute profiles were computed using the MAP estimation method. That is, for each respondent, the estimated attribute profile was the one highest posterior probability, computed using the data likelihood (Eq. 2), and the estimated structural parameters (i.e., the expected proportion of each attribute profile in the population). The frequency of mastery of each attribute and the occurrence of each attribute profile were examined along with their corresponding reliability. (i.e., the expected proportion of correct classification, as considered in Wang et al., 2015). Additionally, different sources of validity evidence were investigated for the CDM results of FoCo. Firstly, joint frequencies of content and cognitive profiles were obtained to investigate the association between mastering the different course contents and cognitive processes. Secondly, aiming to investigate whether mastering more and more complex attributes was related to the overall course knowledge (i.e., overall scores in the partial and final exams), criterion validity was investigated. For this, a scatterplot was generated to depict the distribution of the partial and final exam scores in each attribute classification profile. Finally, students’ mean scores and their confidence intervals were obtained for the partial and the final exam among those students that mastered or not each attribute, so the mean difference contrasts between groups can be inferred. Classical Test Theory Analysis The total scale had a Cronbach’s α = .70 and Green and Yang’s ω = .67. These values of reliability can be considered acceptable, although they are in the lower limits (George & Mallory, 2003; Katz, 2006). In real contexts teachers and lecturers should be cautious and take this into account, but as the results have illustration purposes, we proceeded with the analyses. The average difficulty of the exam was .62, and the average item-rest correlation coefficient was .20. Table 4 presents the means and standard deviations of the item quality indicators in the test and the items of each attribute. The test average proportion of correct responses is within recommended values (ranging from .43 to .78), but discriminations are slightly low (ranging from .18 to .27). When these indicators were analyzed by content domains, the items addressing “experimental methods” were slightly more difficult. As it could be expected, when they were analyzed by cognitive domains, item difficulties were higher as they required more complex reasoning. Table 4 Mean (and Standard Deviation) of the Item Quality Indicators 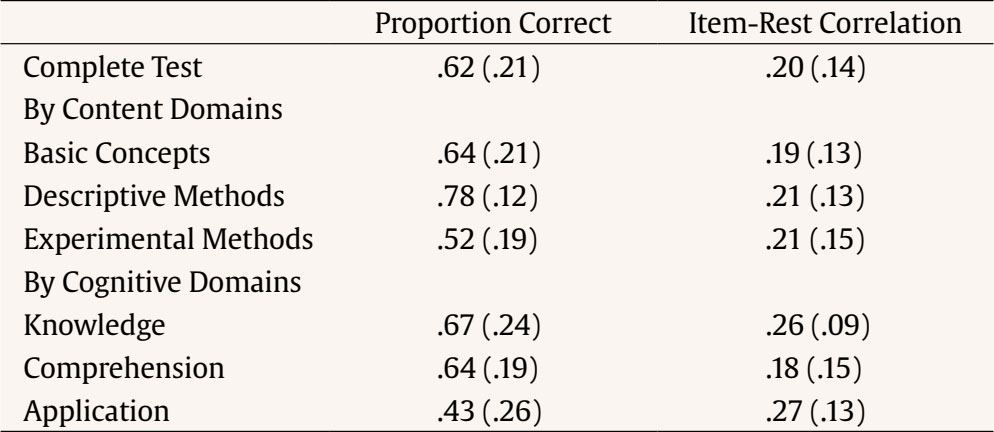 FoCo app provides a graphical representation of item quality based on the proportion of correct responses and discrimination (see Figure 1). Each of the items is represented in a two-axis graph that defines a desirable area for items with adequate psychometric properties (green shadow). The items that do not fall on this area are graphed with red and do not fulfil the difficulty and/or discrimination criteria, whereas the items graphed with green achieve both criteria. It is important to notice, 1) that the cutoffs selected are demanding to guarantee items’ quality, and 2) almost all the item-rest correlations are positive (except for items xxx6, xxx13, and xxx34). For instance, item xxx29 can be considered as a functional item as it presents a medium proportion of correct answers and large discrimination, while item xxx34 is non-functional as it presents negative discrimination (that is, students with higher scores have fewer probabilities of correctly answering it). FoCo app also provides additional analyses about item distractors that could help explain the item performances. In the case of item xxx29, the correct answer was selected by a large proportion of students (.82), while item distractors were less frequently selected (.16 and .02). The Attali and Fraenkel’s (2000) index shows that both item distractors had appropriate discrimination (i.e., negative values of -.18 and -.19). Similarly, the correct answer of item xxx34 was selected by a large proportion of students (.47), while the item distractors were less frequently selected (.19 and .34). However, the Attali and Fraenkel’s (2000) index shows that the first item distractor has appropriate discrimination whilst the second distractor has not (-.09 and .26, respectively). Figure 1 FoCo app results: Item-Level Indicators. 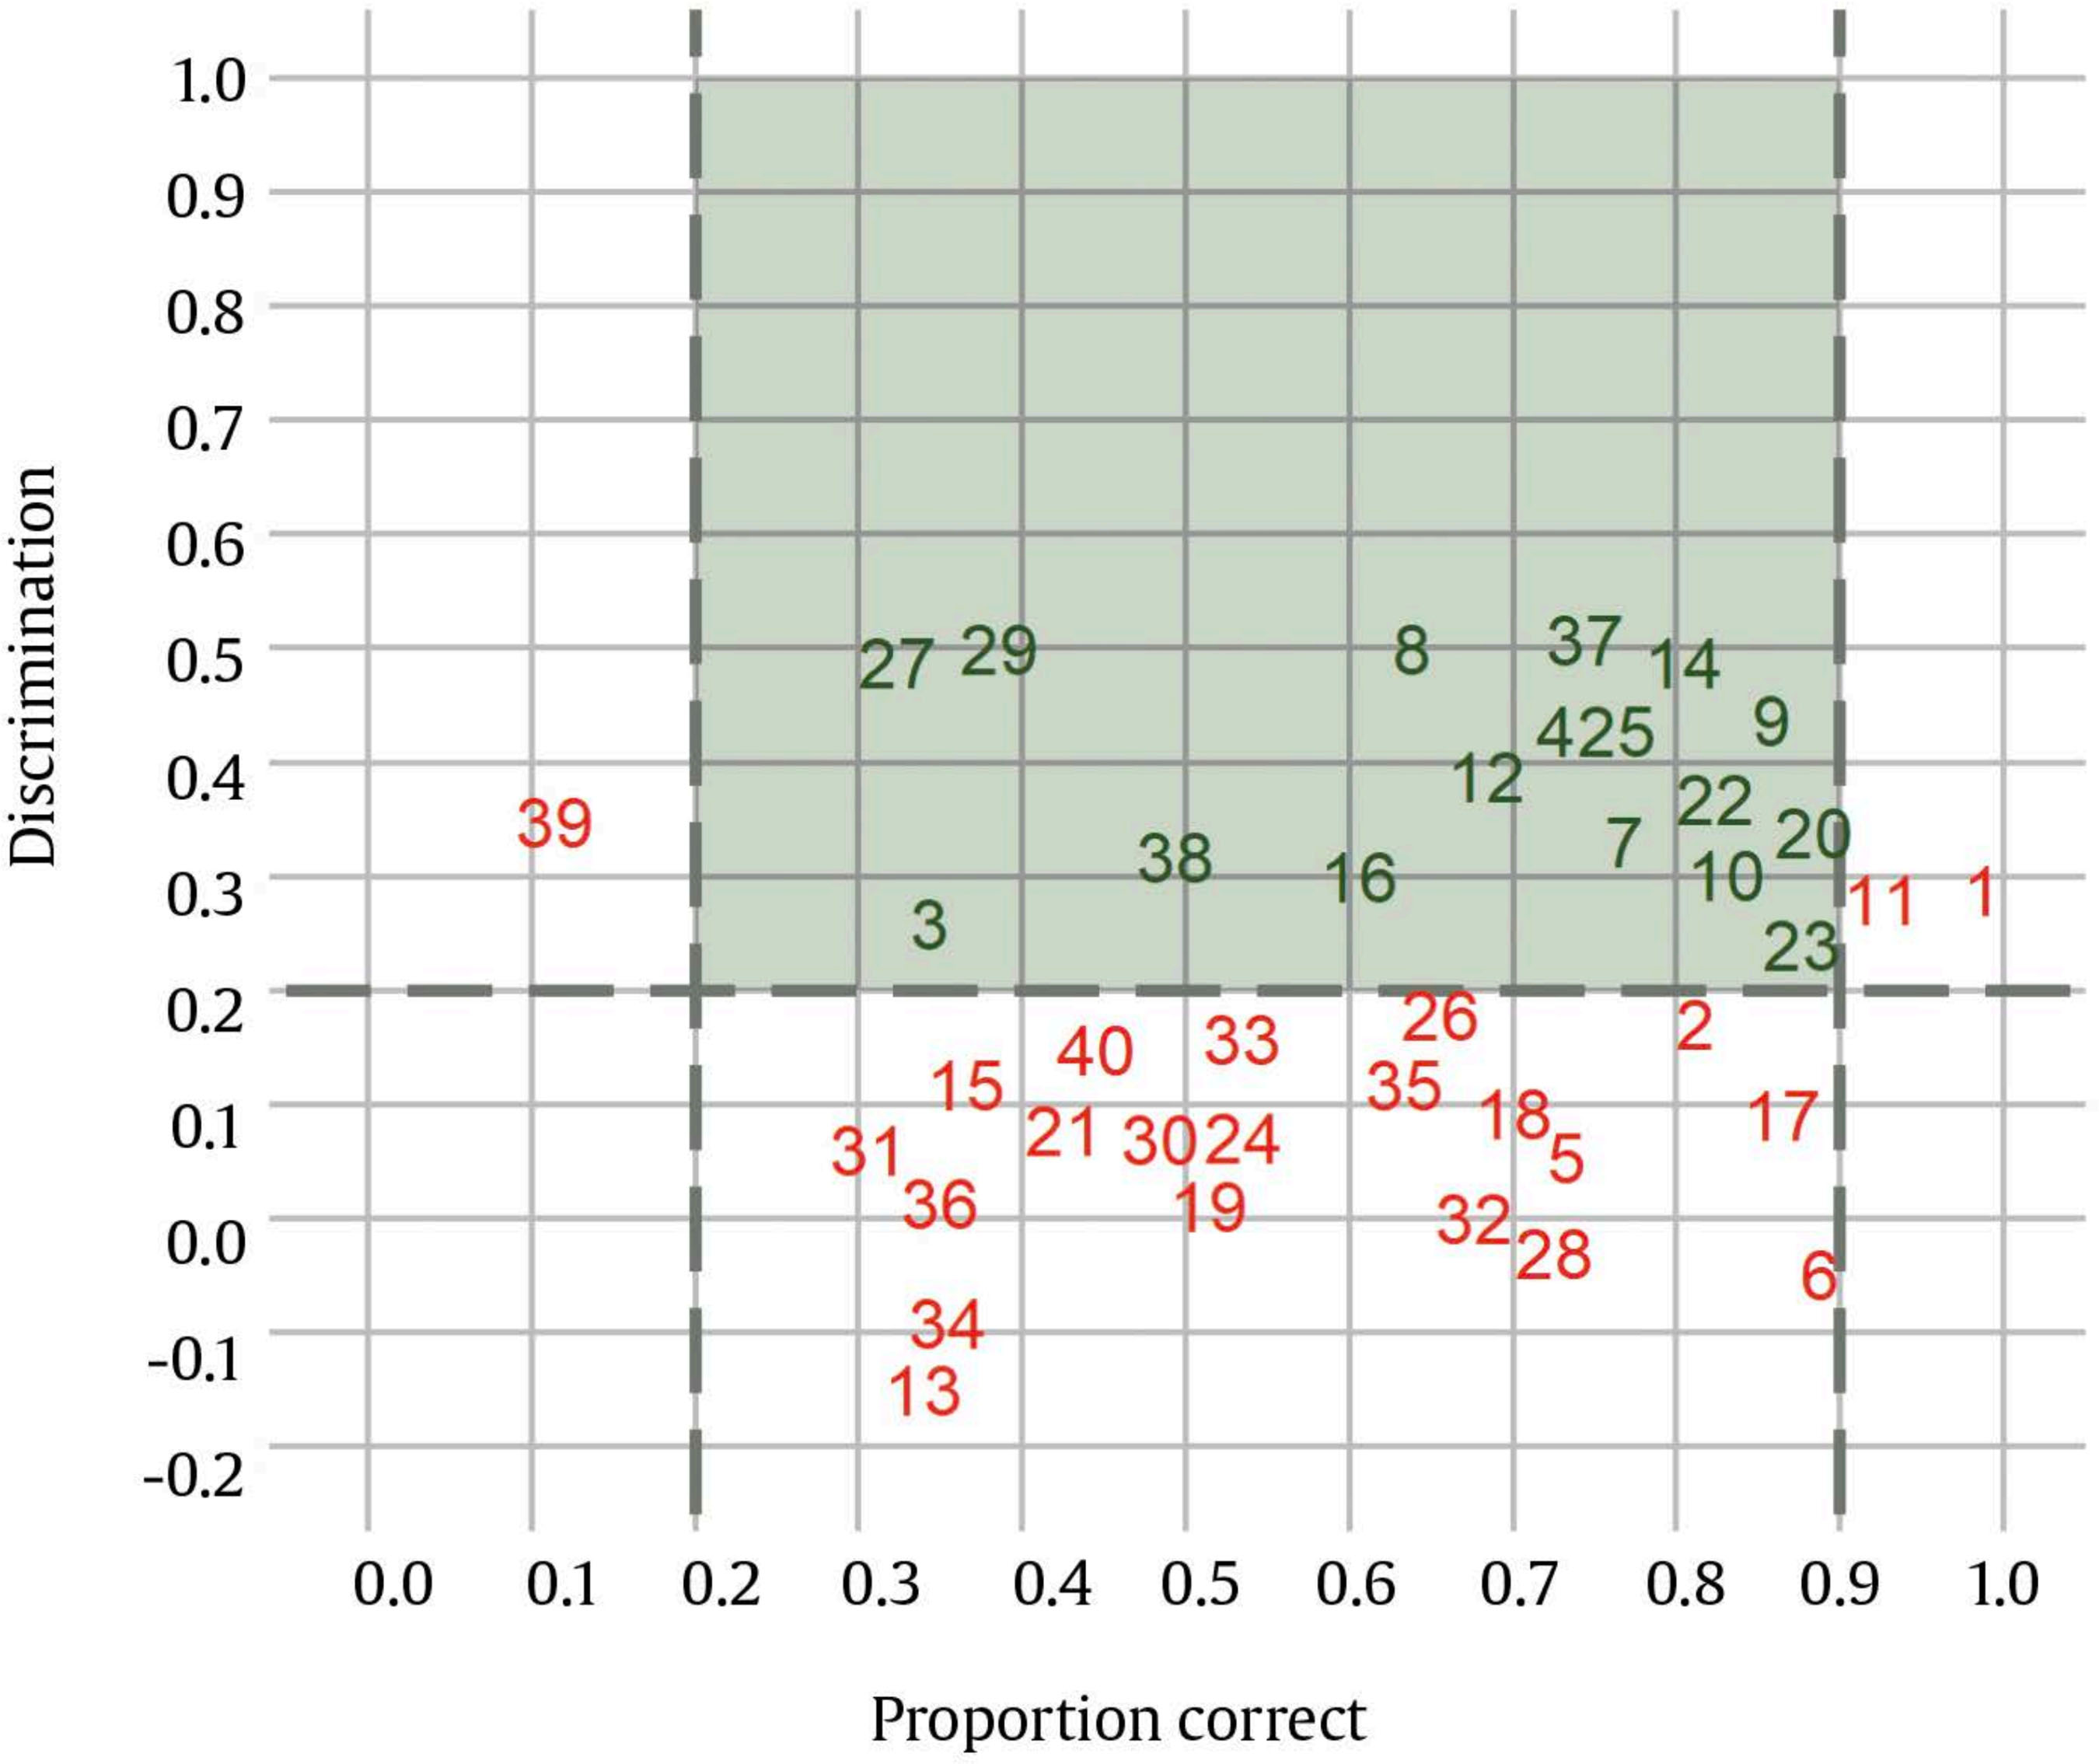 Note. To facilitate interpretation of the item-level indicators, two cutoffs are displayed: proportion of correct responses between .20 and .90 and discrimination larger than .20 criteria (Abad et al., 2011). These criteria should be revised according to what would be expected in the specific field of application. Cognitive Diagnosis Modeling Model Fit In this illustration, an adequate model fit is obtained for content domains, M2 (727) =734.749, p =.413; RMSEA2 = .011, 95% CIs [0, .035], and cognitive domains, M2 (699) = 729.327, p = .207; RMSEA2 = .22, 95% CIs [0, .040]. This means that the structure of both Q-matrices (i.e., number of attributes involved in the test and the item levels and their relations) seems to be appropriate. Attribute Prevalence Estimate and Classification Accuracy Figure 2 presents different graphical results of the FoCo app. Figures 2A and 2B present the attribute-level prevalence and classification accuracy, i.e., the estimated proportion of attributes that were correctly classified at the attribute-level (e.g., Kreitchmann et al., 2022; Templin & Bradshaw, 2013). The three content domains were acquired by more than 50% of the students, but the cognitive domains presented more differences. Almost all the students acquired the “knowledge” attribute (93%), but only a quarter acquired “comprehension” (28%), and very few, “application” (3%). The green colour of these figures indicates that all the attributes were measured accurately, and the exact classification accuracy regarding the scores around each attribute are included inside the corresponding column. Figure 2C presents the correlations between the content domains and, as it can be seen, large correlations between attributes were found, which can be an indicator of one-dimensionality. The correlations between the cognitive domains are not reported due to their hierarchical structure. Figure 2D presents the frequency and reliability of the profiles in the cognitive domains. It was found that half of the students only acquired the “knowledge” attribute (100), and that one-fifth of the students acquired the “knowledge” and “comprehension” attributes (110). On the contrary, fewer students acquired none or all the attributes (000 and 111, respectively). The green colour of these figures indicates that all the profiles present appropriate classification accuracy, except the last profile of the cognitive domains (111). This low accuracy can be explained by the fact that there is a very small number of examinees with this attribute profile (i.e., 3), and that the number of items measuring “application” is also small (i.e., 4). Figure 2 FoCo App CDM Results for the Two Q-matrices 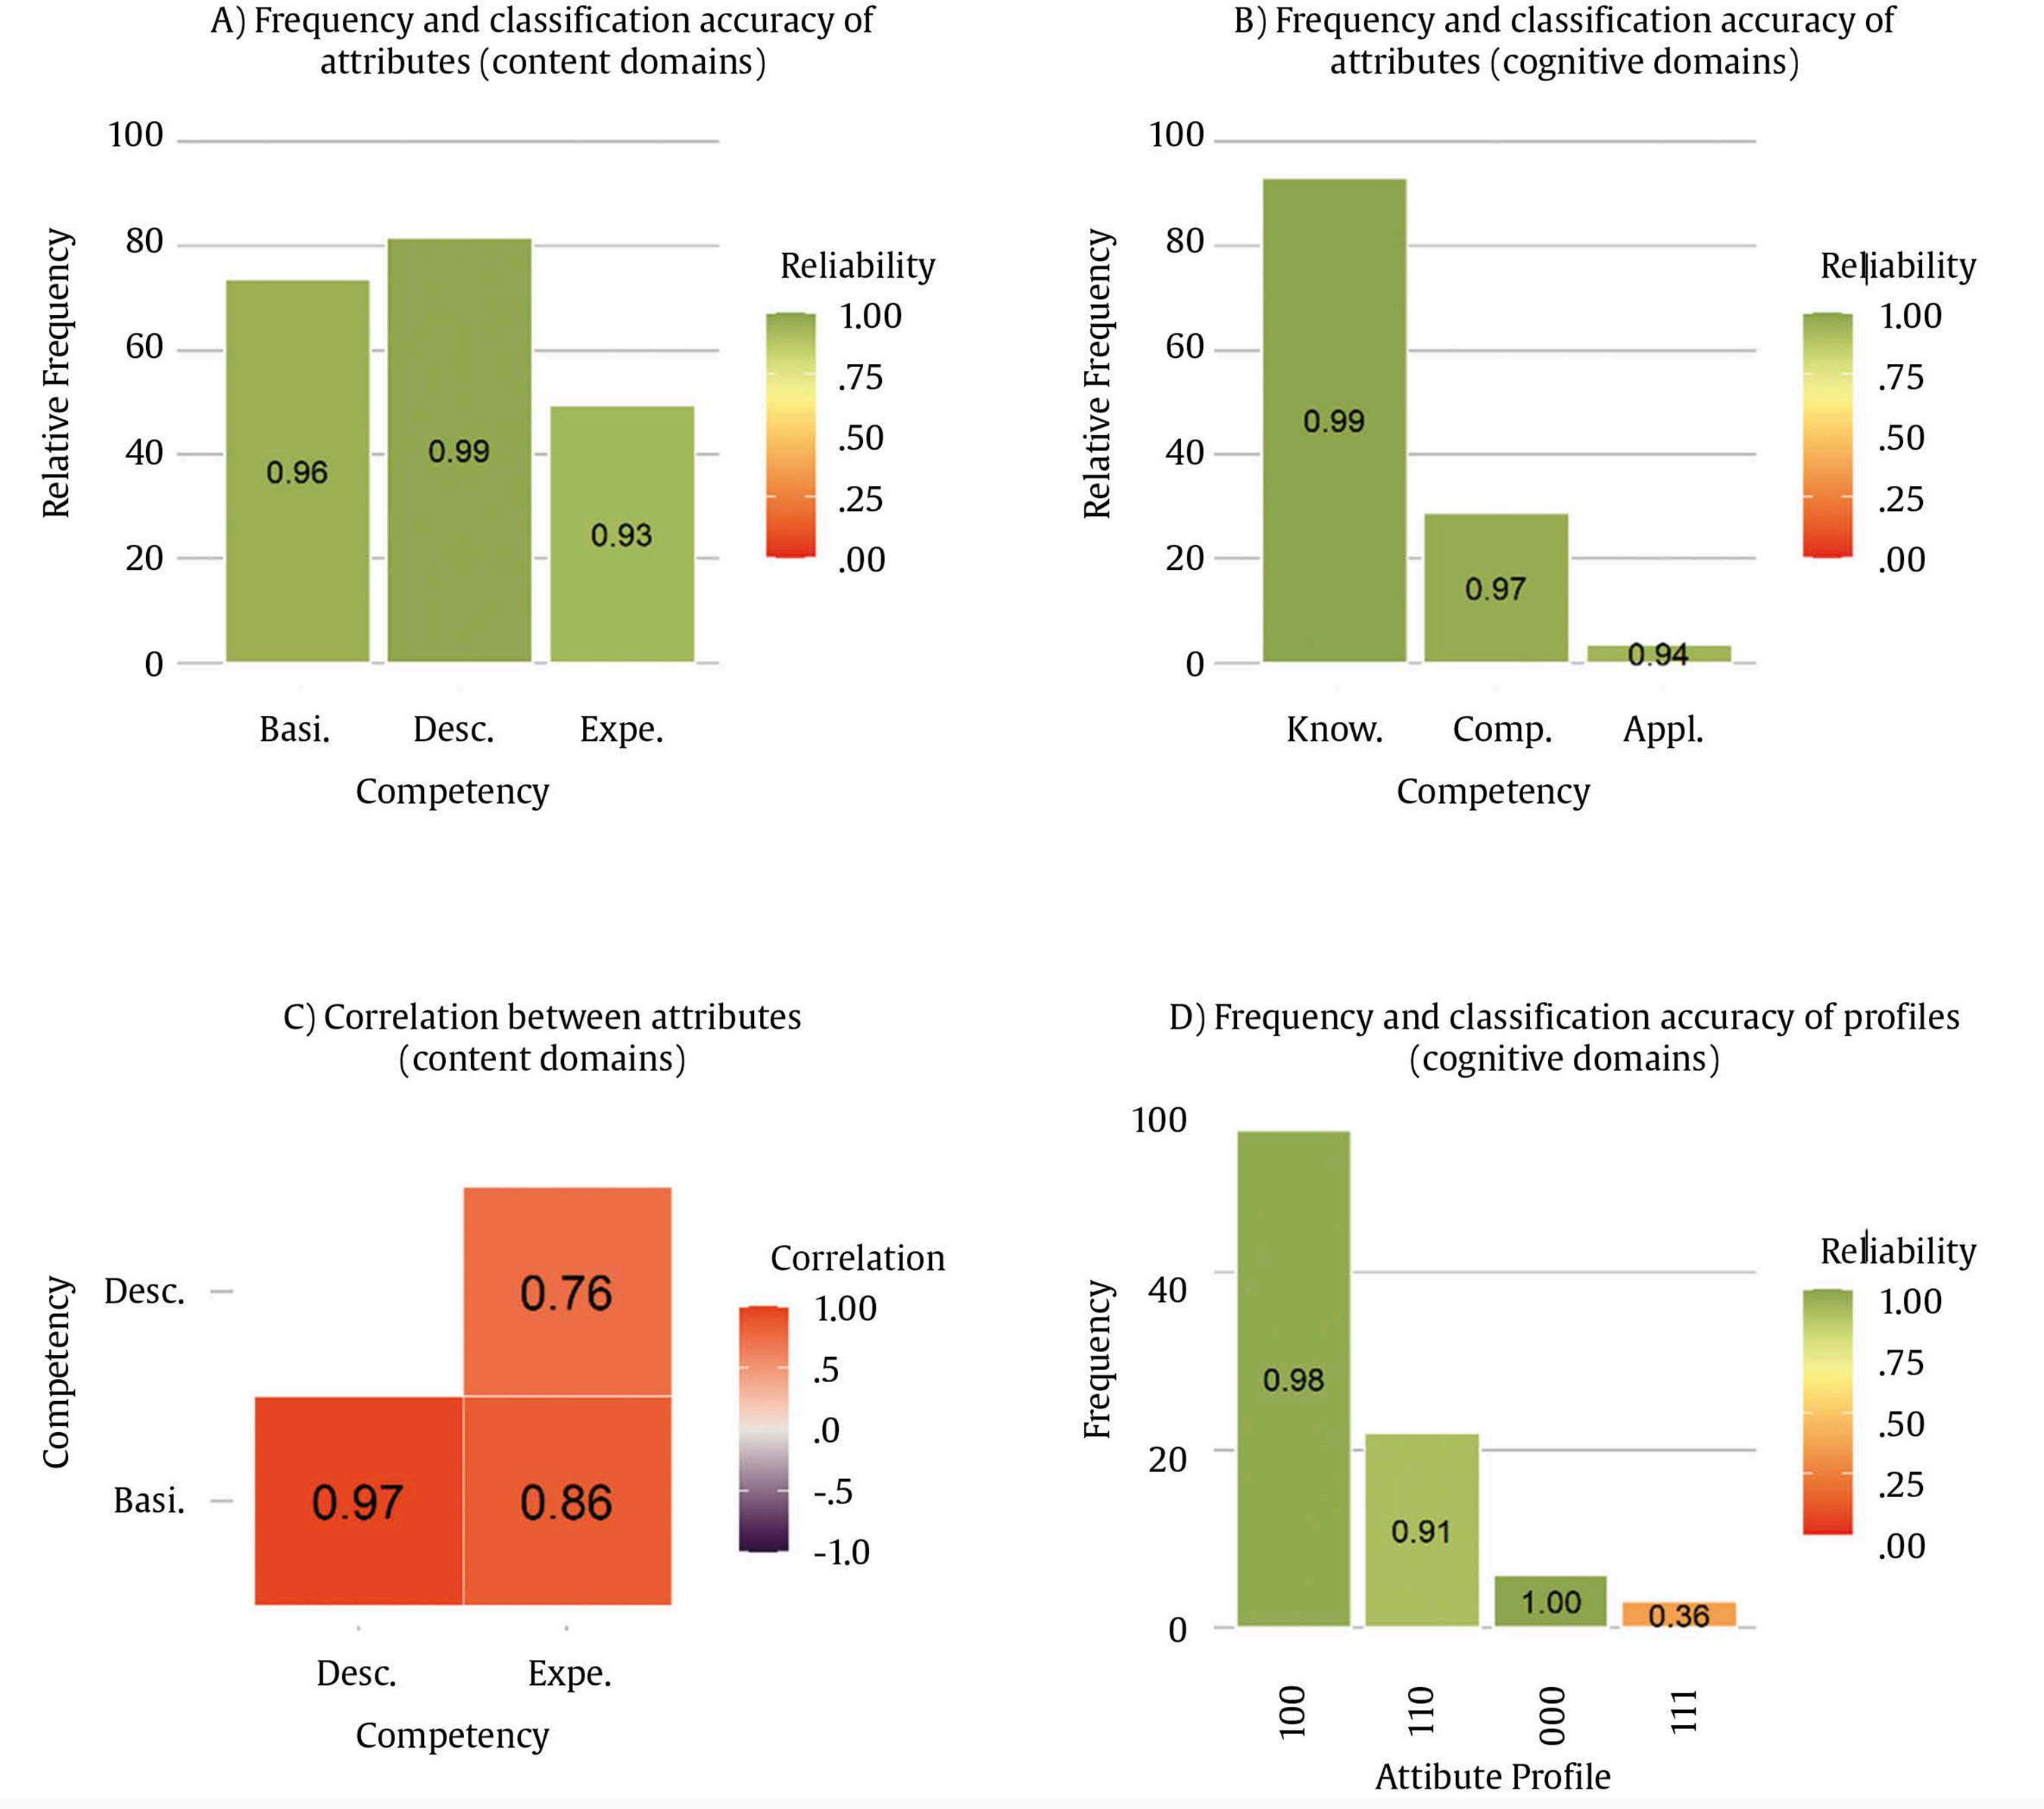 CDM results are related to content domains and cognitive domain’s attributes. Basi. = basic concepts; Desc. = descriptive methods; Expe. = experimental methods; Know. = knowledge; Comp. = comprehension; Appl. = application. Please note that in Figure 2D some attribute profiles are not possible due to hierarchy being imposed for the attributes of the Q-matrix of cognitive domains. The reliability values are represented inside the bars in Figures 2A, 2B, and 2D. Validity Evidence for Attribute Scores Table 5 shows that mastering “comprehension” and “application” competencies appear to require mastering the three content domains. On the other hand, students that only master “knowledge” competency may master, or not, different content domains. These students may represent those that correctly answer some items distributed across contents, but they do not reach a minimum for mastering any content attributes per se. Finally, five students do not master any of the domains, and one who masters the descriptive content without any of the cognitive domain, suggests a spurious result. Table 5 Joint Frequencies of Content and Cognitive Classifications 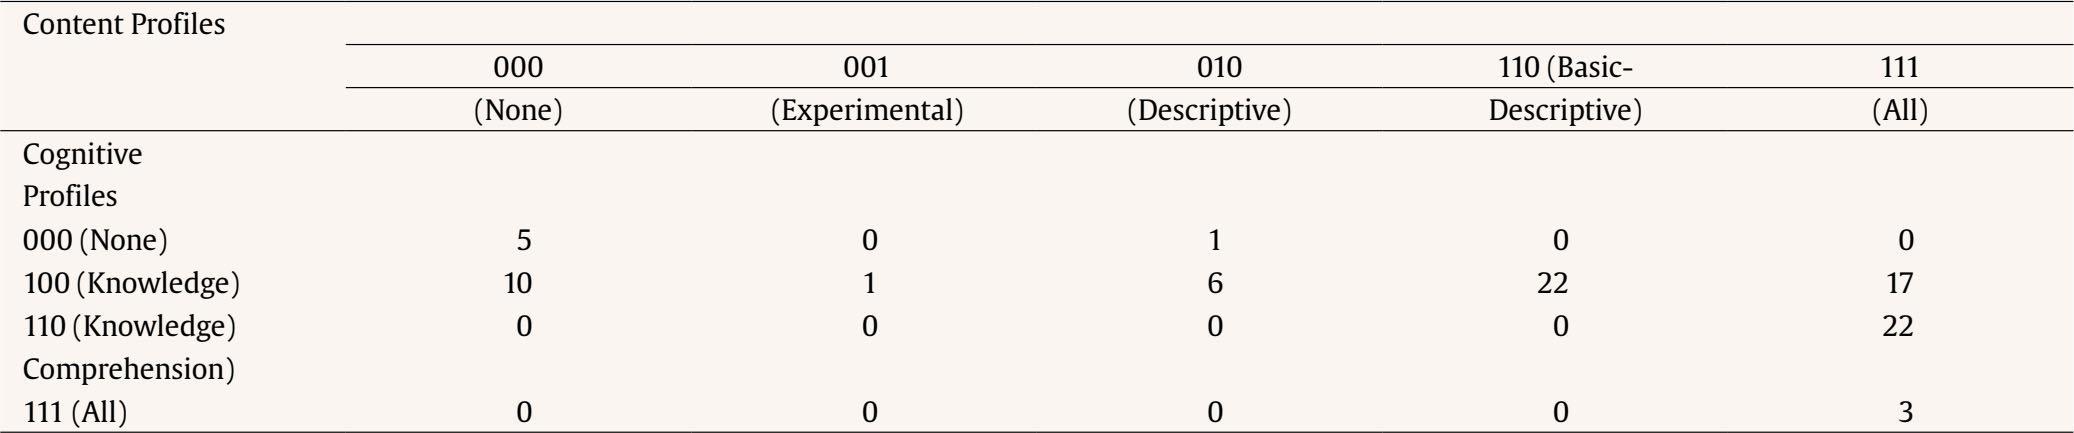 Figure 3 highlights a positive association between mastering more competencies (for both content and cognitive domains) and higher grades in the final and partial exams. This relationship is expected, as mastering an attribute is related to give the correct answer to the items, but it contributes to giving validity evidence for considering that attributes are useful to predict the students’ grades. However, students could get a score of zero even if they master some of the attributes, as there is guessing penalty [equal to number of errors – 1/ (number of response alternatives – 1)] in both partial and final exam, so errors penalize test scores. By comparing content and cognitive domains, those students mastering the three content competencies appear to be failing to reach high test scores because they are not capable of applying the course knowledge. Patterns for final and partial exam scores are similar, thus providing evidence for the association between the CDM mastery profiles and partial exam scores, although partial exam has higher variance and higher average scores. Additionally, it should be noted that the partial and final exams were administered a few months apart from each other. In this sense, it is plausible that a person that did not master a given attribute in the partial exam could master it in the final exam. On the contrary, it is also plausible that a person that mastered the competencies at the time of the partial exam could not master it in the final exam. Figure 3 Distribution of Final Exam and Partial Exam Scores for the Different Competency Profiles. 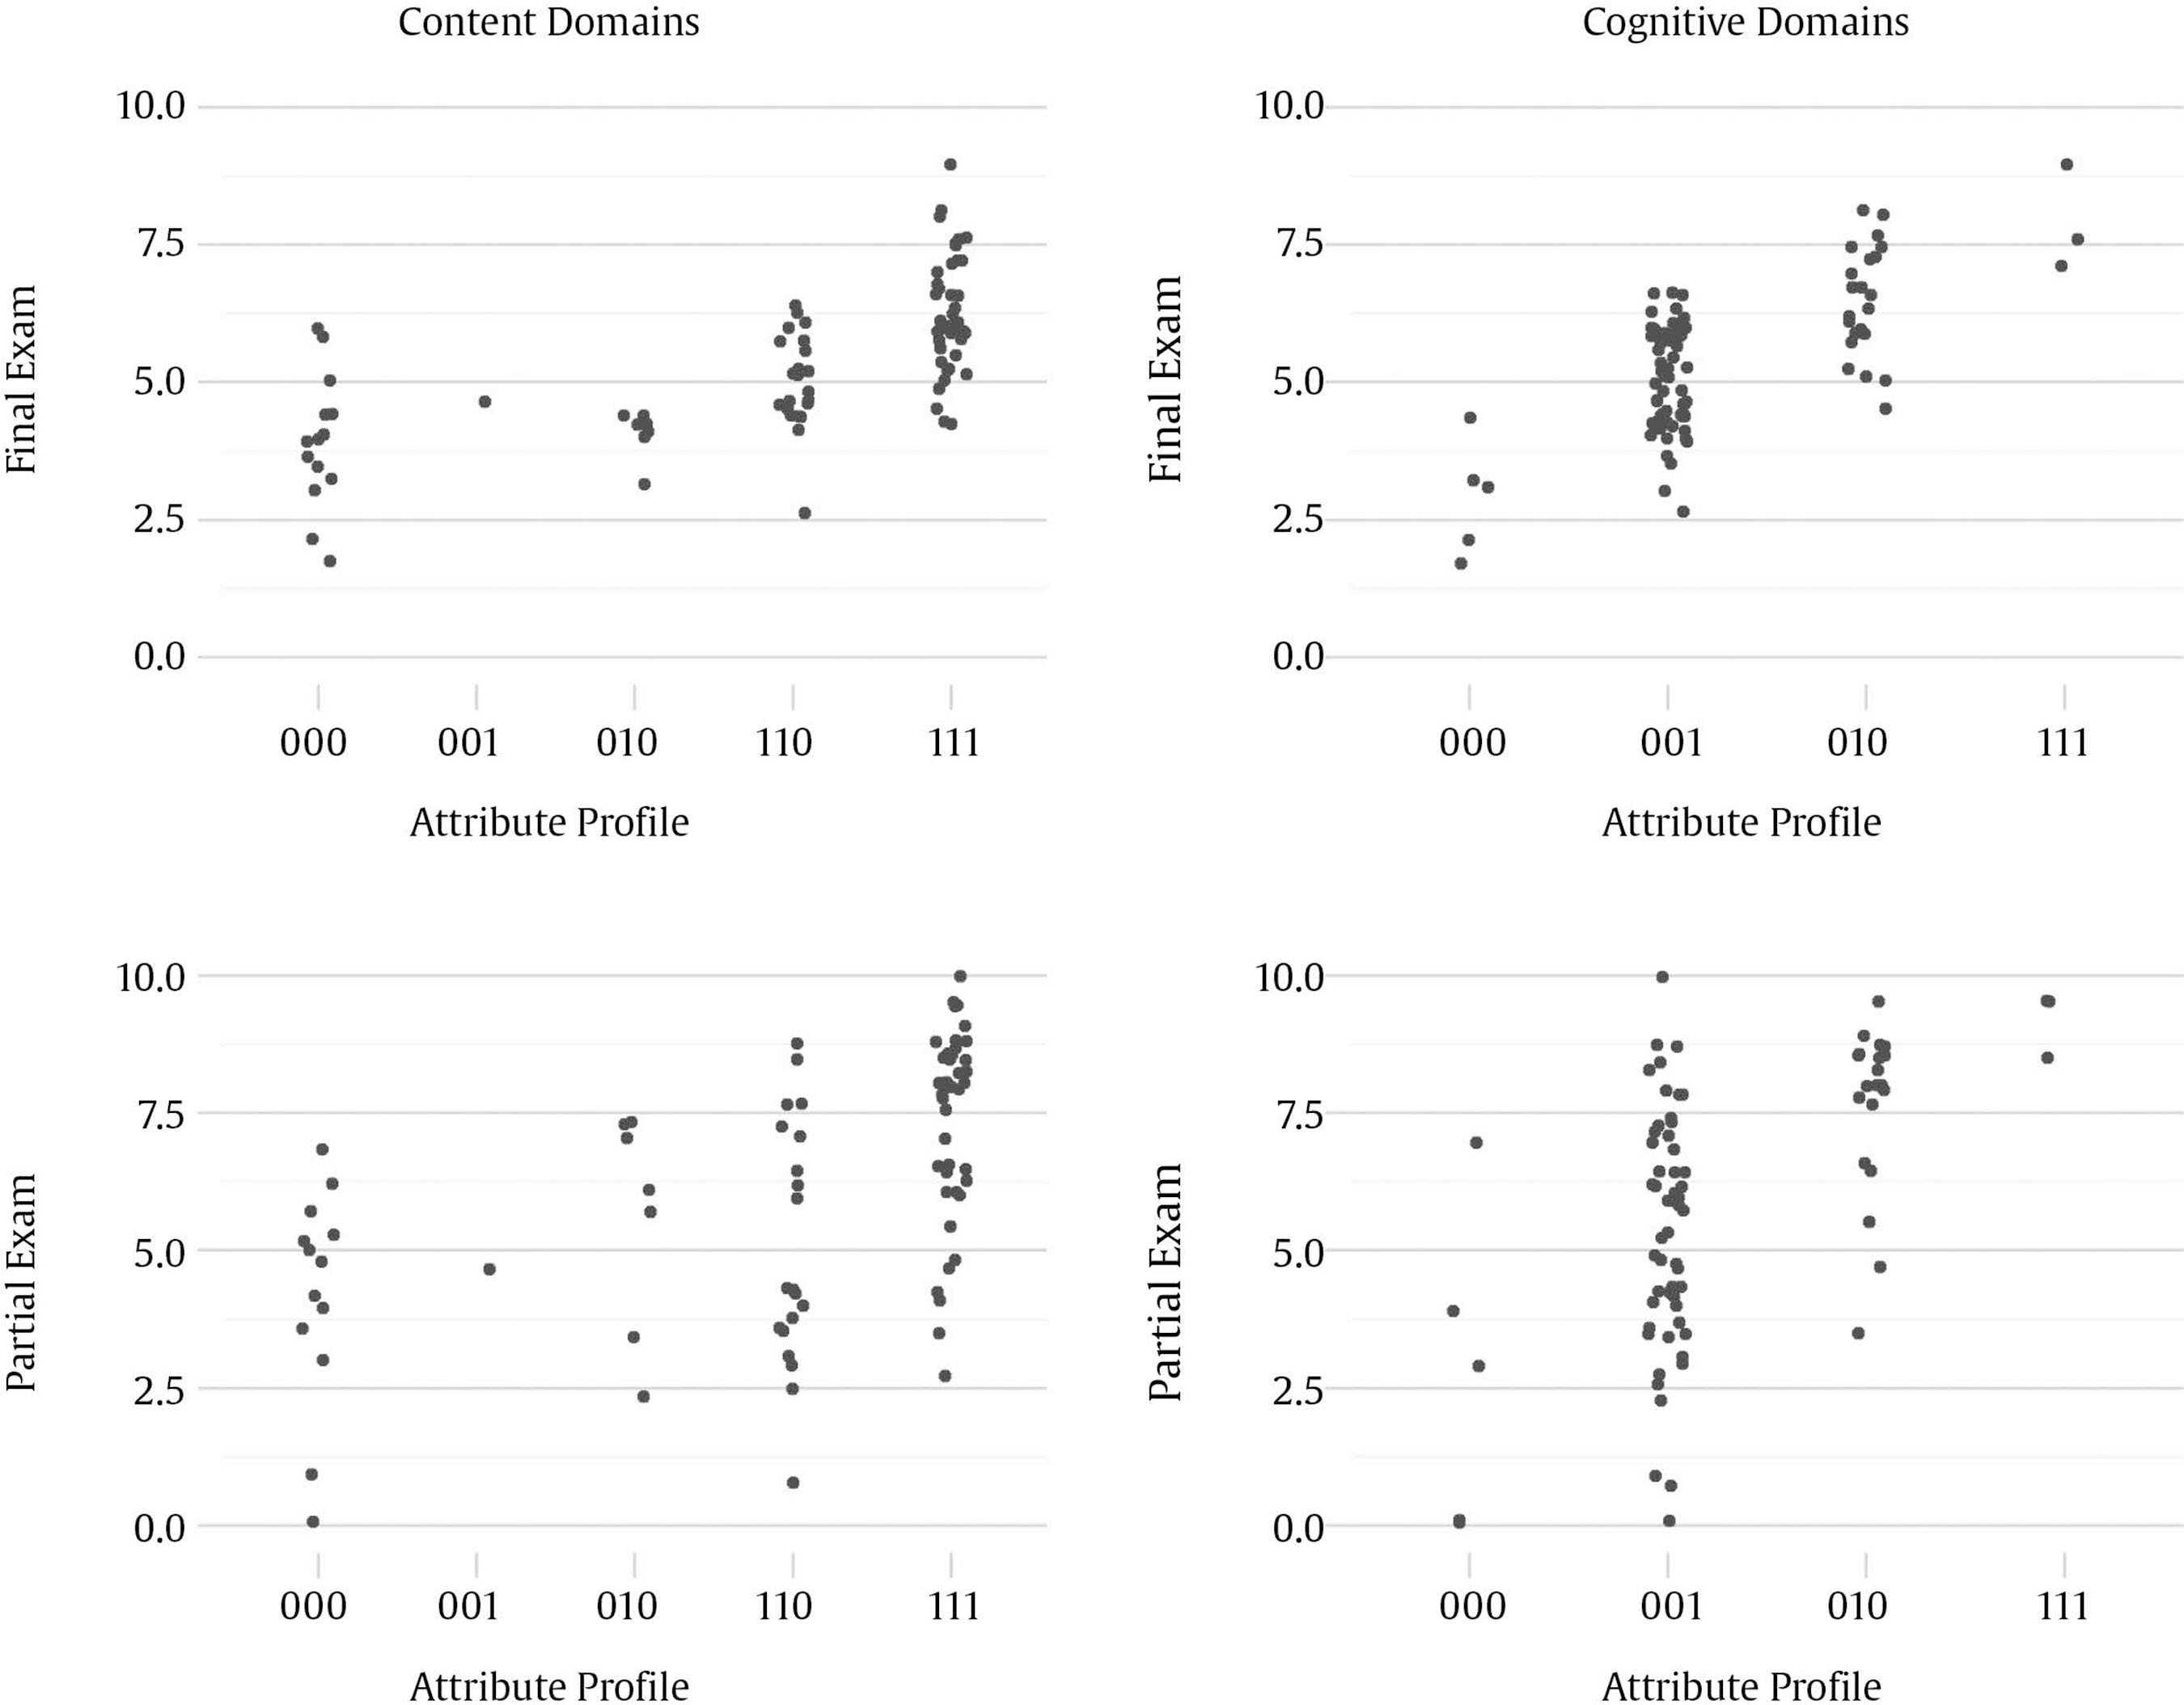 Figure 4 presents average final and partial exam scores aggregated by competencies. Students mastering each competency had significantly higher grades in both final and partial exams scores. Also, it can be seen similar patterns of results for both assessments, although the differences were larger for cognitive domains. In general, the use of CDM enables to diagnose student learning at a finer level, making it possible to offer tailored training to meet students’ needs. In the current sample, for instance, two examinees with the same sum score of 4.6 in the final exam were found to master different sets of competencies. Whereas the first mastered the competence of “descriptive methods” (i.e., content profile of 010), the second mastered the competence of “experimental methods” (i.e., content profile of 001). In this sense, despite having the same sum scores, student one could benefit from specific training to enhance the comprehension of “basic concepts” and “experimental methods”, whereas student two could take advantage of further instructions on “basic concepts” and “descriptive methods”. Figure 4 Means and 95% Confidence Intervals for the Final Exam and Partial Exam Scores by Students Mastering Status. 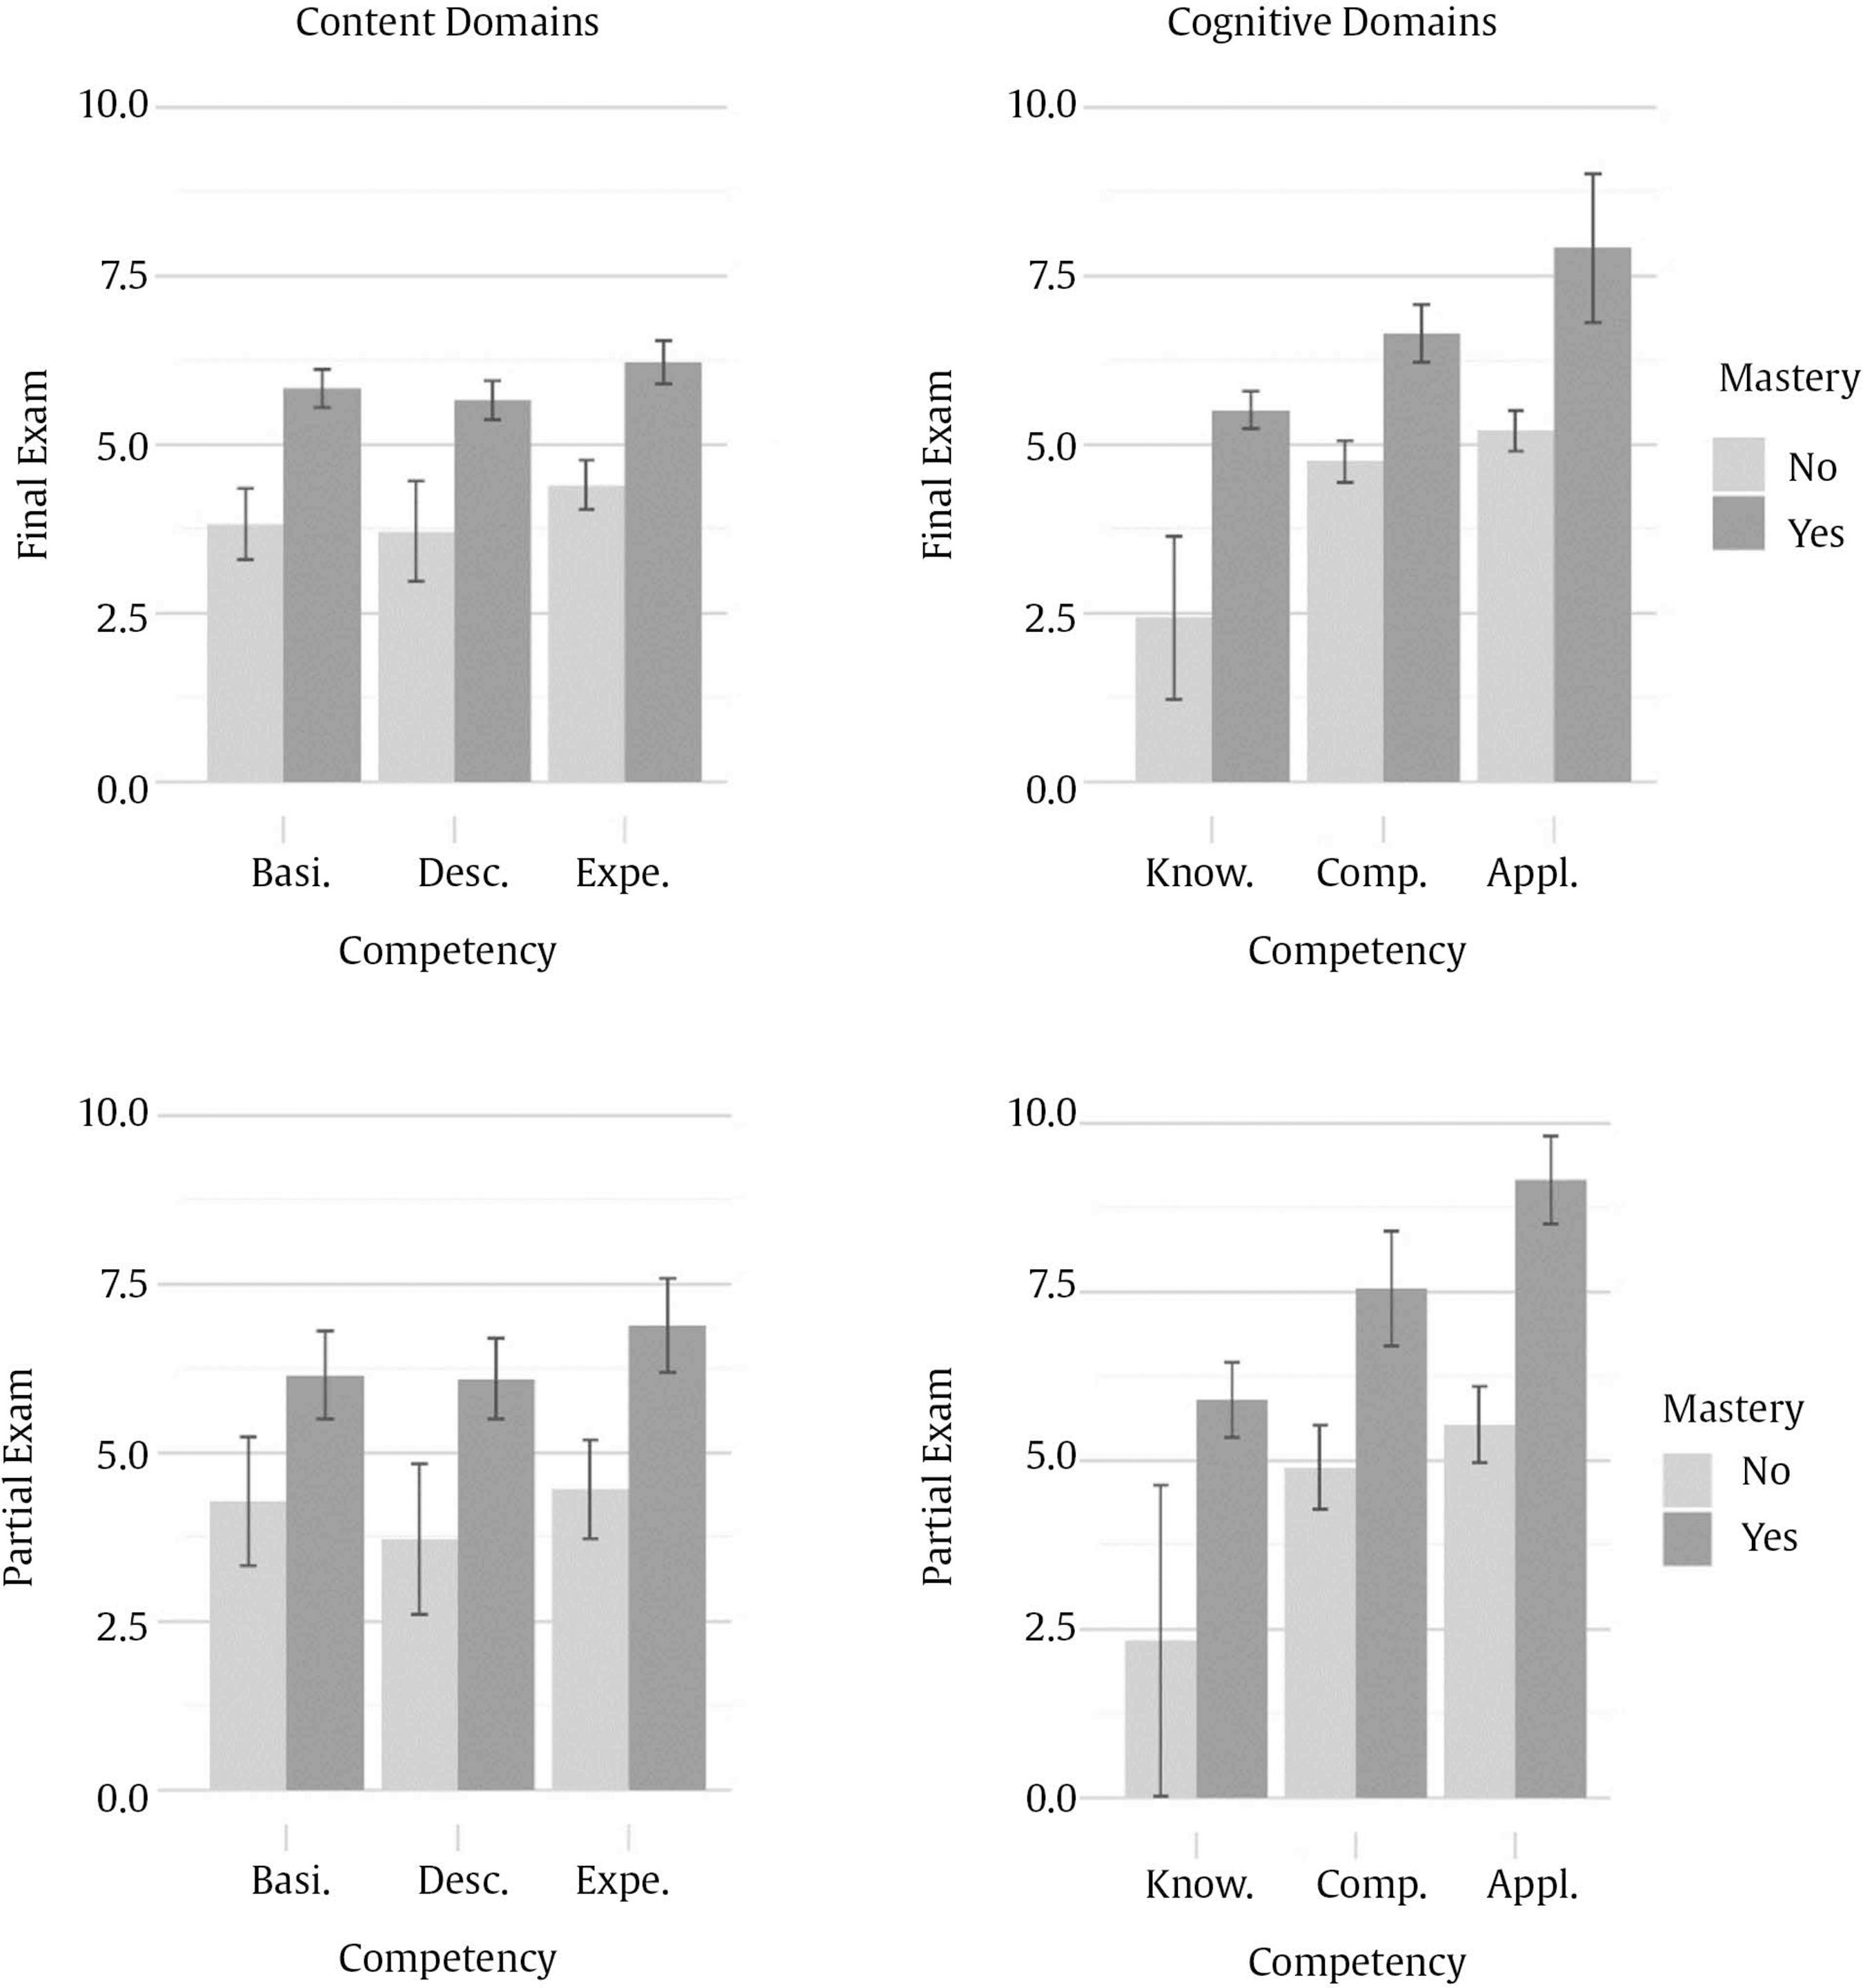 Considering not only the scores, but also the learning process that takes place to pass a subject is important to better understand how students learn, and the knowledge and abilities that they are not reaching (Bennett, 2011). For this reason, pooling summative and formative assessment can provide the evaluation with more information to guide teaching and learning, giving more specific competency-based feedback when CDMs are applied. As it can be seen in the results, there is an association between the mastery of the different competencies and the sum scores in the partial and final exams. Nonetheless, this relationship it is not perfect. On the one hand, the estimated attribute profiles are expected to contain some degree of error. Specially with small samples, the estimation of the item parameters (i.e., the correct response probability for each attribute profile) may be inaccurate, which affects the subsequent classification of the respondents. On the other hand, the sum scores for the partial and final exams, used as criteria for validity, do not account for the fact that the items have different discrimination and difficulty levels (see Figure 1). In this sense, some students that do not master any attributes may have higher sum scores by correctly responding easier or less discriminant items. Further, attributes are attempts to capture the more variance as possible, but there could be not exhaustive. For example, some students could guess the correct answer without knowing it, or they could be getting the correct answer for different reasons that the contemplated in the attributes’ selection. As it can be seen, two different domains have been selected, and some other skills, knowledges, or competences could be established in the classification. It is the teacher or lecturer who should decide which attributes are the focus of interest and write enough high-quality items to measure attributes in order to give students better feedback of their abilities. That could prevent finding low accuracy in the profile-level classification, and in case they find them they should be encouraged to modify or write new items. As can be seen, students with similar scores may master different competencies. Thus, cognitive diagnosis can be more informative than other measures based only on general performance. This information can lead teachers and lecturers to go over the explained contents to clarify possible questions or invest more time in developing activities for students to acquire certain skills. The dimensionality of the test should also be considered. The obtained results showed three different but highly correlated attributes in content domain, and a hierarchical relationship in the cognitive domain. Assuming different dimensions, Cronbach’s ? should be interpreted with caution, as it should be used for unidimensionality scales. This manuscript has detailed how to use the open-source program FoCo (https://foco.shinyapps.io/FoCo/) to obtain both summative and formative assessment information from multiple-choice tests. Specifically, it has been illustrated how traditional psychometrics and cognitive diagnostic modeling can be applied to provide evidence of reliability and validity for the assessment scores, and how the information offered by CDMs can provide diagnostic information. This diagnostic information can be useful for teachers and lecturers as it gives specific information about the knowledge and/or competences that they consider that students should get, and only requires the extra effort to orientate the items that they are going to use in order to make them suitable for measuring these competences. As using multiple-choice items to follow students’ progress is easy to implement and it does not require much more time than the usually spent preparing this evaluation. Further, the information that FoCo provides is more specific and could lead teachers and lecturers to reinforce some concepts or skills that students are not mastering, as can be seen in Figure 2, that shows the proportion of students mastering every attribute (2A and 2B), the correlation between attributes to make sure that they are sufficiently different to take all of them into account (2C), or the different profiles from the students, giving a general panorama about the class (2D). Although CDM-based applications that demonstrate their usefulness in school contexts are emerging, they are still scarce (for a review, see Sessoms & Henson, 2018). This may be partially explained by the fact that modern psychometric models are difficult to access, being available only in very specific software, and generally requiring programming skills for their application. This motivated the development of FoCo which makes it possible to bring these models closer to practitioners and applied researchers. Moreover, the use of this software provides other advantages associated with CDMs, such as the availability of reliable and fit indices to support the interpretation and use of assessment scores (e.g., Johnson & Sinharay, 2020; Sorrel et al., 2017), the possibility of conducting longitudinal studies to explore learning processes (Zhan, 2020), and efficient computerized applications (Yu et al., 2019), or the detection of differential item functioning (Ma et al., 2021). Another crucial aspect is the specification of the Q-matrix. The present study has shown how the Q-matrix can be generated following a systematic procedure involving content experts. It has also been shown how various specifications can be tested in terms of fit and predictive validity. In addition to the content-based specification, it has been shown how the three dimensions offered by Bloom’s taxonomy (“knowledge”, “comprehension”, and “application”) can be applied (Bloom et al., 1956). As it can be seen in the illustration, the content domain matrix shows slightly better fit indicators than the cognitive domain matrix. These results may respond to the fact that the final exam was prepared thinking of the content that students should master, and the classification of the cognitive dimensions was done after the data was collected. However, as different outputs can be useful to students in a substantive way, the design of the items can be focused to measure not only the contents, but also the cognitive attributes, and better results would be expected in these cases. Alternative ways to generate the Q-matrices are also possible. For instance, it is possible to rely on the students themselves in this process of generating the Q-matrix, through think-aloud protocols. Other examples of alternative Q-matrix generation can be found, for example in Li and Suen (2013) or Sorrel et al. (2016). The illustration provided in this article shows how this model is useful under small sample size conditions, which are the expected conditions in classroom-level settings. However, FoCo can also be used for formative assessment in other contexts, with larger sample sizes, and in these cases the applied researcher can empirically validate the Q-matrix (Nájera et al., 2020). This procedure compares the Q-matrix with the best fit to the data with the Q-matrix generated from theory to assess possible changes. Moreover, the dimensionality of the data (i.e., number of attributes) can be also empirically explored. Recently, three different methods, including the well-known parallel analysis, have been proven to perform appropriately at assessing the dimensionality of CDM data (Nájera, Abad, et al., 2021; Nájera, Sorrel, et al., 2021). In conclusion, the FoCo app is offered to allow the psychometric study of multiple-choice tests, as well as the generation of a CDM output. This enhances the validity of the assessments by exploring the meaning of the scores. It is expected that the FoCo app will make it possible to bring these novel methodologies to applied settings, contributing to facilitating the application of formative assessment. Conflict of Interest The authors of this article declare no conflict of interest. Acknowledgements We are thankful to Francisco J. Abad, Carmen García, and Ricardo Olmos for their help and insightful feedback during the development of this project. Cite this article as: Sanz, S., Kreitchmann, R. S., Nájera, P., Moreno, J. D., Martínez-Huertas, J. A., & Sorrel, M. A. (2023). FoCo: A Shiny app for formative assessment using cognitive diagnosis modeling. Psicología Educativa, 29(2), 149-158. https://doi.org/10.5093/psed2022a14 Funding: This study has been supported by two educational innovation projects (PS_006.19_INN and PS_002.21_IMP) from Universidad Autónoma de Madrid, and by the Community of Madrid through the Pluriannual Agreement with the Universidad de Universidad Autónoma de Madrid in its Programa de Estímulo a la Investigación de Jóvenes Doctores (Reference SI3/PJI/2021-00258). |
Cite this article as: Sanz, S., Kreitchmann, R. S., Nájera, P., Moreno, J. D., Martínez-Huertas, J. Á., & Sorrel, M. A. (2023). FoCo: A Shiny App for Formative Assessment using Cognitive Diagnosis Modeling. Psicolog├şa Educativa, 29(2), 149 - 158. https://doi.org/10.5093/psed2022a14
Correspondence: rschames@faculty.ie.edu (R. S. Kreitchmann).Copyright © 2026. Colegio Oficial de la Psicología de Madrid


 PDF
PDF e-PUB
e-PUB CrossRef
 JATS
JATS Imprimir
 Enviar
ALERTA POR E-MAIL
La Revista de Psicología Educativa está distribuida bajo una licencia de Creative Commons Reconocimiento-NoComercial-SinObra Derivada 4.0 Internacional.com