Heavy Study Investment in Pre-adolescence and Adolescence: Psychometric Properties of the Studyholism Inventory (SI-10)
[La fuerte inversión en el estudio en la preadolescencia y la adolescencia: propiedades psicométricas del Inventario de Obsesión con el Estudio (SI-10)]
Yura Loscalzo1, Jessica Giani2, and Marco Giannini1
1University of Florence, Florence, Italy; 2Licensed Pyshcologist
https://doi.org/10.5093/psed2022a17
Received 4 October 2020, Accepted 4 October 2022
Abstract
The Studyholism Inventory (SI-10) allows evaluating two types of Heavy Study Investment (Studyholism – or obsession toward study – and Study Engagement), and four kinds of student (engaged studyholics, disengaged studyholics, engaged students, detached students). We analyzed its psychometric properties in Italian pre-adolescents (n = 451) and adolescents (n = 446) and proposed its cut-off scores. Moreover, we investigated some demographic and study-related differences in studyholism and study engagement. The results supported the use of the SI-10 in pre-adolescents and adolescents. The fit indices are similar in the two samples (for adolescents, GFI = .98, RMSEA = .059). Moreover, we found a high prevalence of studyholism, especially in pre-adolescence (18.6%), and a decrease in study engagement in both genders from pre-adolescence to adolescence. In conclusion, the SI-10 might be used from pre-adolescence for research, preventive, and clinical purposes. Also, demographic-related results supported the definition of studyholism as an obsessive-compulsive related disorder.
Resumen
El Inventario de Obsesión con el Estudio (SI-10) permite evaluar dos tipos de fuerte inversión en el estudio (obsesión con el estudio e implicación en el estudio), y cuatro tipos de estudiantes (obsesionados con el estudio implicados, obsesionados con el estudio desconectados, estudiantes implicados, estudiantes desinteresados). Analizamos sus propiedades psicométricas en preadolescentes italianos (n = 451) y adolescentes (n = 446) y propusimos sus puntuaciones de corte. Además, investigamos algunas diferencias demográficas relacionadas con el estudio en la obsesión y la implicación con el estudio. Los resultados avalan el uso del SI-10 en preadolescentes y adolescentes. Los índices de ajuste son similares en las dos muestras (para adolescentes, GFI = .98; RMSEA = .059). Asimismo, encontramos una gran prevalencia de la obsesión con el estudio, especialmente en la preadolescencia (18.6%) y una disminución en la implicación con el estudio en ambos sexos desde la preadolescencia hasta la adolescencia. En conclusión, el SI-10 podría usarse desde la preadolescencia con fines de investigación, preventivos y clínicos. Además, los resultados relacionados con la demografía confirman la definición de obsesión con el estudio como un trastorno relacionado con la obsesión-compulsión.
Palabras clave
Fuerte inversiĂłn en el estudio, ObsesiĂłn, TOC, Estudio de la adicciĂłn, ParticipaciĂłn en el estudio, AdicciĂłn al trabajoKeywords
Heavy work investment, Obsession, OCD, Study addiction, Study engagement, WorkaholismCite this article as: Loscalzo, Y., Giani, J., & Giannini, M. (2023). Heavy Study Investment in Pre-adolescence and Adolescence: Psychometric Properties of the Studyholism Inventory (SI-10). PsicologĂa Educativa, 29(1), 109 - 120. https://doi.org/10.5093/psed2022a17
Correspondence: yura.loscalzo@gmail.com (Y. Loscalzo).Since the first definition of workaholism (Oates, 1971), many scholars analyzed this clinical condition, which is characterized by problematic overworking and adverse outcomes for both the individual, his/her family, and the organization (Clark et al., 2016; Loscalzo & Giannini, 2017a; Sussman, 2012). Recently, a similar clinical condition has been addressed in the school context through two different constructs and theoretical conceptualizations (Loscalzo & Giannini, 2018a). Atroszko et al. (2015) introduced the construct of study addiction by defining it as a pure addiction characterized by the seven core components of substance addictions (i.e., salience, tolerance, mood modification, relapse, withdrawal, conflict, and problems). Loscalzo and Giannini (2017b, 2018b), instead, coined the term “studyholism” (SH), which addresses problematic overstudying by defining it as a new potential clinical condition characterized by obsessive-compulsive symptoms and either low or high levels of study engagement (SE), hence distinguishing between engaged and disengaged studyholics and preventing an overpathologizing of a common behavior such as studying. More specifically, by adopting the Heavy Study Investment framework – cf. Snir & Harpaz (2011) for the Heavy Work Investment model –, Loscalzo and Giannini (2017b) suggested crossing the levels of SH and SE to define four kinds of student: disengaged studyholics, engaged studyholics, engaged students, detached students. High SH and low SE characterize disengaged studyholics, and according to Loscalzo and Giannini (2017b) they correspond to the clinical type of studyholic. Engaged studyholics, instead, have high levels of both SH and SE (they are a less impaired type of studyholic, Loscalzo & Giannini, 2017b). Engaged students are the positive kind of heavy study investors, as they have high levels of SE and low levels of SH. Finally, detached students have low levels of both SH and SE. Hence, they are not heavy study investors, though they should receive an intervention since they do not have a positive attitude toward the study (Loscalzo & Giannini, 2017b). However, in a recent paper, Loscalzo and Giannini (2019a) stated that their path analysis model, which analyzed several potential antecedents and outcomes of SH, suggested a slightly different theoretical conceptualization of clinical SH. Their analyses highlighted that disengaged studyholics are not the most impaired type of student. They are more impaired than engaged studyholics concerning the academic area (i.e., lower grade point average – GPA – and higher dropout intention) and the affective area (i.e., lower positive affect and higher negative affect). However, they are less impaired than engaged studyholics concerning the social area (i.e., they have lower levels of social relationships impairment and family and friends’ complaints due to study). Also, the two types of studyholics do not differ concerning physical well-being (i.e., sleep quality impairment and daytime sleepiness) and aggressive behaviors at school. Hence, Loscalzo and Giannini (2019a) suggest conceptualizing both disengaged and engaged studyholics as clinical types of SH, which differ for their level of study engagement and the area in which they are most impaired. In sum, studyholism is operationalized as a construct made up of high levels of study-related obsessive-compulsive symptoms (i.e., studyholism) and either high or low level of study engagement (or intrinsic motivation towards study). Therefore, when analyzing studyholism, it is crucial to evaluate also study engagement levels, since this allows distinguishing between engaged and disengaged studyholics. Concerning the instruments for evaluating problematic overstudying, Atroszko et al. (2015) developed the Bergen Study Addiction Scale (BStAS), which is an adaptation of the Bergen Work Addiction Scale (BWAS; Andreassen et al., 2012). This scale is made up of seven items, one for each of the core components of addictions. However, the BStAS may not be considered a new scale in its strict meaning since Atroszko et al. (2015) did not add/remove BWAS items or change their content substantially (Korb, 2012). Moreover, the Italian version of the BStAS (Loscalzo & Giannini, 2018c) showed only acceptable psychometric properties and potential issues distinguishing between study addiction and SE. These results align with the criticism about adopting aprioristically the addiction framework when studying new potential behavioral addictions (Kardefelt-Winther, 2015) and with the difficulties in operationalizing some key addiction components when applying them to behaviors (Billieux et al., 2015). However, in the literature another instrument for evaluating problematic overstudying has been proposed and it is based on Loscalzo and Giannini’s (2017b) definition of SH. This instrument is the Studyholism Inventory (SI-10; Loscalzo, Giannini, & Golonka, 2018), a ten-item instrument that allows evaluating both SH and SE and distinguishing among four kinds of student (i.e., engaged studyholics, disengaged studyholics, engaged students, detached students). The Studyholism Inventory (SI-10) Loscalzo, Giannini, & Golonka (2018) developed a pool of 68 items concerning the three factors hypothesized by Loscalzo and Giannini (2017b) in their first studyholism definition: addiction (or externalizing) symptoms, obsessive-compulsive (or internalizing) symptoms, and (either high or low) study engagement. Next, aiming to have a short and quick screening instrument, Loscalzo, Giannini, & Golonka (2018) administered the 68-pilot version to Italian college students and using explorative factor analysis (EFA) reached a ten-item and two-factor solution. The studyholism factor was composed of five items covering obsessive-compulsive symptoms and not including addiction symptoms (even if included in the initial pool of items). The study engagement factor was made up of five items as well. However, it does not comprehend items related to vigor, dedication, and absorption (included in the pool of items). The items are mainly related to intrinsic motivation toward the study. Based on the results of these psychometric analyses, Loscalzo and Giannini (2017b) re-analyzed and defined studyholism as a two-factor construct characterized by obsessive-compulsive symptoms and high or low study engagement. Next, Loscalzo and Giannini (2020) deepened the psychometric analysis of the SI-10 in Italian college students. About the SI-10 factor structure, they tested three models through confirmatory factor analysis (CFA). The first model corresponds to the 2-factor and 10-item model found by Loscalzo, Giannini, & Golonka (2018), which did not show a satisfactory fit: GFI = .89, RMSEA = .13. The second model is a 2-factor and 8-item version of the scale. This model arose by deleting one item per factor (the ones with the lowest loadings) and reached a better fit to the data: GFI = .97, RMSEA = .08. The third model represents an improved version of the 2-factor and 8-item model: two errors’ correlation were allowed, referring to both modification indices and theoretical justification for their correlation. The fit indices of the third model were good: GFI = .98, RMSEA = .08. Once Loscalzo and Giannini (2020) reached their final 8-item and 2-factor version of the SI-10, they analyzed sources of convergent and divergent validity evidence and the internal reliability of the two scales. Finally, they established the cut-off scores for high and low studyholism/study engagement. Then, Loscalzo and Giannini (2022) proposed an extended version of the SI-10, namely the Studyholism Inventory-extended version (SI-15). However, the SI-15 represents an extension of the SI-10 studyholism scale only: it addresses SH symptoms through 15 items and three scales (obsessions, compulsions, and social impairment). The SI-15 does not address study engagement. Therefore, while the SI-15 foresee three subscales and a total SH score, the SI-10 did not foresee the calculation of a total score. Through the SI-10, it is possible to evaluate SH and SE and then cross their scores to detect if the student belongs to one of the four types of student suggested by Loscalzo and Giannini (2017b). This paper aims to analyze the psychometric properties of the SI-10 in Italian pre-adolescents and adolescents. Loscalzo and Giannini (2017b) suggested that SH could be spread since pre-adolescence when students face an increase in study-related demands. Hence, it is critical to have an instrument for evaluating problematic overstudying (as well as positive attitudes toward study) in pre-adolescents and adolescents. These ages are characterized by many changes in the physical, cognitive, and emotional levels, which may be associated with anxieties, worries, and stress (Ferraris, 2007), whose academic pressures could also increase. Problematic Overstudying in Pre-Adolescence and Adolescence It is important to analyze problematic overstudying since pre-adolescence and adolescence as those represent relevant stages in human development. Puberty is associated with physical and sexual development (Reardon et al., 2009). Moreover, due to the maturation of neural circuits, there is an increase in the ability to regulate emotions in social situations and understanding others’ cognitions (Haller et al., 2015). Also, as Erickson (1982) pointed out, puberty is a sensitive stage of life in which pre-adolescents begin to direct their energies towards school, sport, and artistic activities. This is a critical stage for the development of self-efficacy. School performance, and the feedback received by teachers, parents, and peers, may have a great influence on the self-image that the youth is building. While positive outcomes and feedbacks lead to industriosity (i.e., feeling to be able to perform the required tasks), negative outcomes and feedbacks lead instead to inadequacy and inferiority feelings (Erikson, 1982). Hence, since social and assessment routines characterize school, it influences the development of the adolescents’ self-concept (Carugati & Sellieri, 1996; Meškauskien, 2017), as well as their academic self-concept, that is, the students’ beliefs about their intellectual weakness and strengths (Trautwein & Möller, 2016). More specifically, Monteil (1991) proposed the construct of school self-schemas, distinguishing between the self-schemas of school success and school failure. While the first is associated with positive results and pride, the latter is associated with negative results and frustration. Also, it should be considered that students face two critical changes during their education, and in particular, in pre-adolescence and adolescence: i) school transitions (from primary school to secondary school of first grade and, later, from secondary school of first grade to the one of second grade) and ii) the choice of the field of study for the secondary school of second grade (Wigfield et al., 1996) When moving to a higher-grade school, students face new peers and teachers. Moreover, teachers demand higher cognitive efforts and evaluate their academic performance more critically than the previous school. The anxieties triggered by these changes usually resolve in a short time (Regoliosi, 1994). Though, some students develop feelings of distress, as well as physical and psychological disorders (that may also include SH), which might negatively interfere with school performance and favor school dropout (Datu & King, 2018; Guarnizo-Herreno & Wehby, 2012; Lessard & Juvonen, 2018; Pascale et al., 2014; Regoliosi, 1994). Concerning the school’s field of study choice, this may be associated with distress since the pre-adolescents might not be sure about their academic interests and work perspectives. Also, there might be discussions with their parents about the right choice (Regoliosi, 1994). If the students make the wrong choice during this stage or change their minds about the field of study during their studies, they may face low SE and think about dropping school. Finally, schools may not be sensitive to the needs that arise with pre-adolescence and adolescence, negatively affecting students’ attitudes toward studying and increasing their dropout intentions (Görlitz & Gravert, 2016). First, schools are usually oriented toward competitiveness instead of cooperation. Moreover, typically, teachers strictly follow the government school program without allowing the students to choose at least some school activities. Consequently, they frustrate their need for autonomy and their interest and intrinsic motivation toward studying. Also, teachers usually do not foster abstract thought employing creative activities (Wigfield et al., 1996). This strict context may ultimately lead students to consider a high grade as the only important aim to reach through studying, without acknowledging the importance of studying to develop their potentialities and identity (Pombeni, 1993). Moreover, this could favor the development of obsession and anxiety toward the study, which may increase school dropout intention (Sempio et al., 1999). In line with these school transition issues, Eurostat (2018) reported that in 2016 11.5% of European students aged between 18 and 24 years old dropped out of school. In Italy, the dropout rate is 14.2%. For the other European Countries, Island (21%), Spain (20.7%), and Malta (20,4%) have the higher dropout rates, while the lowest rates characterize Slovenia (5.2%), Lithuania (4.9%), and Croatia (2.8%). School dropout is also an issue in the USA: between October 2013 and October 2014, 5.2% of students aged between 15 and 24 years left school (McFarland et al., 2018). Hence, addressing students’ well-being (including their SH and SE levels) during school transitions (i.e., during pre-adolescence and adolescence) is critical to avoid the rise of studyholism, which is widespread in college students (Loscalzo, 2019) and associated with many adverse outcomes both in youths (Loscalzo & Giannini, 2019a) and adolescents (Loscalzo, 2021). This attention might allow detecting students at risk of low well-being and high dropout intentions; next, these students might receive preventive interventions to increase their SE and decrease their SH. To reach this aim, we need an instrument with sound psychometric properties to use with these populations and that allows evaluating both positive and negative attitudes toward studying. Adopting preventive and clinical interventions at an early age might avoid academic failure, school maladjustment, and school dropout, which are topics increasingly analyzed in the last few years (e.g., Grijalva-Quiñonez et al., 2020; Morelli et al., 2021; Vargas et al., 2019). The Present Study We aim to evaluate the psychometric properties of the Studyholism Inventory (SI-10; Loscalzo, Giannini, & Golonka, 2018) in pre-adolescents and adolescents since the instruments proposed so far for evaluating problematic overstudying have been analyzed in college students only. We will analyze the SI-10 factor structure and sources of internal reliability, convergent and divergent validity evidence, separately for pre-adolescents and adolescents. Moreover, we will propose the cut-off scores for defining high/low levels of SH/SE, and hence for detecting the four kinds of student proposed by Loscalzo and Giannini (2017b). Also, we will evaluate gender and study-related differences (i.e., year of study, type of school) in SH and SE, and the association between these two scales and academic indicators (i.e., time investment in studying and GPA). Finally, we will evaluate if there are differences in SH and SE between pre-adolescents and adolescents. We decided to analyze the psychometric properties of the SI-10 separately for pre-adolescents and adolescents since those are two different developmental stages. Pre-adolescence is characterized by the onset of puberty, while the main physical and sexual changes are defined in adolescents (Reardon et al., 2009). In line with this, Loscalzo and Giannini (2017c) – based on their review of the scant literature concerning the role of interpretation bias in adolescents’ social anxiety (i.e., Giannini & Loscalzo, 2016; Haller et al., 2017; Haller et al., 2016; Houtkamp et al., 2017; Loscalzo, Giannini, & Miers, 2018; Miers et al., 2008) – recommend that adolescents’ studies should differentiate among pre-adolescents, adolescents, and older adolescents (that is, older than 18 years) since there might be some age-related differences to be taken into account for both preventive and clinical purposes. In brief, they found that adolescent studies reported some discrepant findings compared to the adult literature and even some differences among the few studies in adolescents (as they were based on adolescents of different ages). Participants We recruited a convenience sample of 897 Italian pre-adolescents and adolescents. More specifically, the pre-adolescent sample was made by 451 middle school (or secondary school of first grade) students aged between 11 and 14 years (M = 12.14 ± .85, 50.1% males). The adolescent sample, instead, was made by 446 students aged between 13 and 19 years (M = 16.04 ± 1.52, 44.8% males), and attending three different kinds of secondary schools of second grade: professional school (14.6%), technical school (37.2%) and high school (48.2%). See Table 1 for more information about the participants. Table 1 Sociodemographic and Study-related Characteristics of Participants (N = 897). 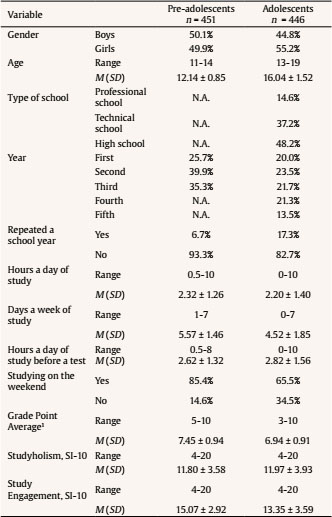 Note. N.A. = not applicable; 1Italian sufficient grades are between 6 and 10. Material Studyholism Inventory (SI-10; Loscalzo, Giannini, & Golonka, 2018) It is a 10-item self-report instrument developed from an initial pool of 68 items to measure SH and SE. It also allows distinguishing among four kinds of student: disengaged studyholics, engaged studyholics, engaged students, and detached students. The SI-10 covers some questions about study habits (e.g., GPA, hours of study per day) and 10 items (two are filler items, one for each scale of the instrument). There are no reversed items. A 5-point Likert scale follows each item, ranging between 1 (strongly disagree) and 5 (strongly agree). There are available the English, Polish, Croatian, Spanish, and Indonesian translations of the SI-10 (the writing of the paper is in progress). In the present research, we administered the Italian version, which showed good psychometric properties on college students (GFI = .98, CFI = .97, RMSEA = .07, SH, α = .84, SE, α = .81; Loscalzo & Giannini, 2020). Bergen Study Addiction Scale (BStAS; Atroszko et al., 2015) It is a 7-item self-report scale encompassing one item for each of the seven core components of addictions. Each item is followed by a 5-point Likert scale, ranging between 1 (never) and 5 (always). The BStAS has a good fit on Norwegian students and an acceptable fit on Polish students; moreover, the Cronbach’s alpha is .74 for the Norwegian and .75 for the Polish sample (Atroszko et al., 2015). We administered the BStAS Italian version (Loscalzo & Giannini, 2018c), which does not have an acceptable fit for Italian college students, indicating items 1 and 2 as the most critical. However, it has satisfactory internal reliability (α = .72). Since the BStAS has not been analyzed yet in pre-adolescents and adolescents, we carried out preliminary CFAs in a sub-sample of 100 pre-adolescents and 100 adolescents balanced for gender. The results did not support the one-factor structure of the BStAS in pre-adolescents: GFI = .90, CFI = .75, RMSEA = .13 (α = .67). Hence, we did not use it for convergent and divergent validity analyses. However, it showed a satisfactory fit on adolescents: GFI = .94, CFI = .84, RMSEA = .08 (α = .60). Utrecht Work Engagement Scale-Student version (UWES-S-9; Schaufeli & Bakker, 2004) We administered the Italian version (Loscalzo & Giannini, 2019b) of the UWES-S-9. It is a 9-item self-report instrument developed by Schaufeli and Bakker (2004) to evaluate study engagement through three scales: vigor, dedication, and absorption. Each item must be rated through a 7-point Likert Scale, ranging between 0 (never) and 6 (always, everyday). Both the Dutch (Schaufeli & Bakker, 2004) and the Italian version (Loscalzo & Giannini, 2019b) have good psychometric properties: a good fit for the three-factor model and good internal reliability. More specifically, the α values for the total score are respectively .84 and .90. Since the UWES-S-9 has not been analyzed yet in pre-adolescents and adolescents, we did preliminary CFAs in a sample of 100 pre-adolescents and 100 adolescents balanced for gender. The results did not support the use of the UWES-S-9 for convergent and divergent analyses in the pre-adolescent sample: GFI = .90, CFI = .90, RMSEA = .11 (even if α = .85). About the adolescent sample, we found instead both a good fit and a high Cronbach’s alpha: GFI = .94, CFI = .99, RMSEA = .05 (α = .90). Procedure First, we obtained the authorization for the research from the Department of Health Sciences of the University of Florence, protocol number 153913, 16/11/2015. Next, we asked for the school heads’ authorization to collect data in their schools. We wrote an email to the school heads of two secondary schools of first grade and three secondary schools of second grade, aiming to present the research project and get their collaboration. All the schools we contacted agreed to participate. Thus, we asked them permission to bring the informed consent at school, asking for teachers’ collaboration in giving a copy to all the students and gathering them signed by both the students and their parents. Then, we returned to school after about two weeks and during a school hour we administered the paper-and-pencil questionnaire to the students whose parents signed the informed consent. The (few) students who were not allowed to fill the questionnaire by their parents were involved in other school activities assigned by the teacher during the administration of the questionnaires. The questionnaire includes a first sheet with some personal data (i.e., age and gender), followed by the SI-10, the BStAS, and the UWES-S-9. To standardize the test administration across the five schools, we followed the procedure described for all the schools. Data Analysis SPSS.27 and AMOS.22 were used for conducting the analyses. The preliminary analyses conducted in the two samples showed the lack of outliers for the variables analyzed. About missing data, in the pre-adolescent sample, there is one missing only with regards to GPA. In the adolescent sample there are a few more missing: two missing for hours per day spent studying generally, one missing for days per week spent studying, seven missing for hours per day spent studying before a written or oral school test, and 14 missing for GPA. We did not fill in missing data through imputation analyses. The variables used for CFA, which does not allow missing data, did not have missing. Next, we analyzed the descriptive statistics (including skewness and kurtosis) of the SI-10 items on both the pre-adolescent (n = 451) and adolescent (n = 446) samples. Next, we evaluated if the two-factor and eight-item structure of the Studyholism Inventory (SI-10; Loscalzo & Giannini, 2020) is confirmed on pre-adolescents and adolescents using CFAs (maximum likelihood estimation; SPSS raw data uploaded in AMOS). The items of the SI-10 proved to be normally distributed in both the pre-adolescent and adolescent samples. We used the following indexes and cut-off values to evaluate the fit of the models: χ2/df ratio, which indicates a good fit if its value is less than 3 (Byrne, 2003); goodness of fit index (GFI), comparative fit index (CFI), Tucker-Lewis index (TLI), and normed fit index (NFI), whose cut-off are: < .90 lack of fit, .90-.95 good fit, > .95 excellent fit (Hu & Bentler, 1999; Kline, 2016); root mean square error of approximation (RMSEA), for which values below .05 indicate an excellent fit, while values between .05 and .08 indicate an acceptable fit (Reeve et al., 2007); standardized root mean square residual (SRMR), for which values below or equal to .08 indicate a good fit (Hu & Bentler, 1999). We did not use EFA since it is used for data reduction (Singh et al., 2016), and it is the first step in designing a new scale (Yong & Pearce, 2013). In fact, Loscalzo, Giannini, & Golonka (2018) used EFA to reduce the number of items of the 68-item pilot version, while Loscalzo and Giannini (2020) performed CFAs for cross-validating the factor structure. In sum, EFA is applied when there is not an a-priori model (Prudon, 2015), which is not the case in the present study, as we aim to test an a-priori model that corresponds to the model found by Loscalzo and Giannini (2020) in college students. Next, we calculated the internal consistency (Cronbach’s alpha and McDonald’s omega) of the two subscales and analyzed sources of convergent and divergent validity evidence using Pearson’s correlation. We also used Pearson’s correlation for analyzing the association between SH and SE and some academic indicators evaluated by the SI-10: GPA, hours a day of study generally and before school tests, and days a week of study generally. To establish the strength of the correlation, we referred to Cohen’s (1988) cut off scores: values between .10 and .29 represent low correlation, values between .30 and .49 indicate average correlations, values equal or higher than .50 stand for high correlations. Then, we calculated the cut-off scores for defining high and low SH and SE on pre-adolescents (n = 451) and adolescents (n = 446). More specifically, we calculated the t scores for the two scales and looked for the raw scores corresponding to -1 SD (or 40 t score) and +1 SD (or 60 t score). Next, we calculated the percentage of participants belonging to the four kinds of student that the SI-10 allows to detect: disengaged studyholic, engaged studyholic, engaged student, detached student. Moreover, we calculated the discrimination index for the four items belonging to each of the SI-10 subscales. To perform this analysis, we coded the SI-10 items in dummy variables: scores between 0 (completely disagree) and 3 (neither agree nor disagree) were assigned to 0, while scores between 4 (agree) and 5 (completely agree) were assigned to 1. Then, we used the high/low studyholism/study engagement groups created referring to the cut-off values for SH and SE as the reference groups to calculate the item difficulty and the discrimination index. Finally, we performed five MANOVAs in the pre-adolescent sample and six MANOVAs in the adolescent sample for analyzing demographic and study-related differences between groups (e.g., gender, age, year of study). Where the variables comprehended more than two groups, a Bonferroni post-hoc test was performed. Also, a 2 (developmental age) x 2 (gender) MANOVA was conducted with SH and SE as dependent variables to analyze if there was a difference between pre-adolescents and adolescents on SH and SE, as well as for analyzing if there is an interaction effect of gender and developmental level on SH and SE. Descriptive Statistics As a preliminary step to CFA, we calculated the descriptive statistics (including skewness and kurtosis) of the SI-10 items. The analyses have been conducted separately for pre-adolescents and adolescents. The results are shown in Table 2, and they highlight a normal distribution for all the items and the SH and SE total scores. The values for skewness and kurtosis range between -1.00 and 1.00, with just a few items being slightly outside this range. The highest value is 1.50, which corresponds to the kurtosis value for item 10 (pre-adolescent group). Hence, even the higher value does not reach the cut-off of five, which Bentler (2005) suggests indicates that data are not normally distributed. Table 2 Descriptive Statistics of the Studyholism Inventory (SI-10) Items in Pre-adolescents (n = 451) and Adolescents (n = 446) 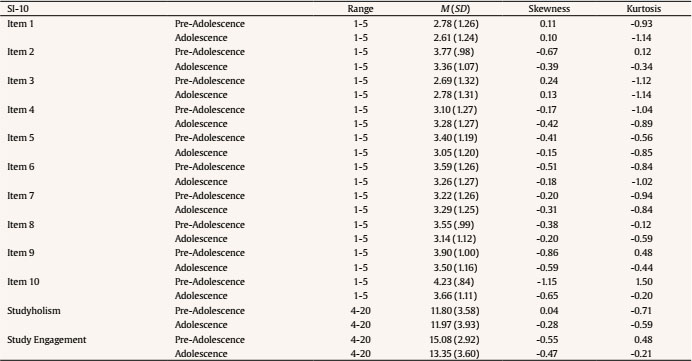 Note. Items 2 and 6 are filler items. Psychometric Properties Pre-adolescents The CFA that we conducted aiming to evaluate if the 2-factor and 8-item model fits the data well showed a good fit: χ2/df = 2.53, p < .001, GFI = .97, CFI = .95, RMSEA = .058, 90% CI [.038, .079], SRMR = .046. Figure 1 shows the graphical representations and the standardized factor loadings of the factor model. About the uniqueness of each studyholism item, those are the values: item 1 = .26, item 3 = .63, item 4 = .38, and item 7 = .14. About study engagement items, the values are: item 5 = .27, item 8 = .42, item 9 = .42, and item 10 = .42. Next, we calculated Cronbach’s alpha for the two scales: SH, .66 (item-total correlations ranging between .61 and .79); SE, .70 (item-total correlations ranging between .70 and .75). Moreover, we calculated McDonalds’ ω: studyholism = .67, 90% CI [.63, .71]; study engagement = .70, 90% CI [.65, .74]. Figure 1 Two-factor Model, SI-10. 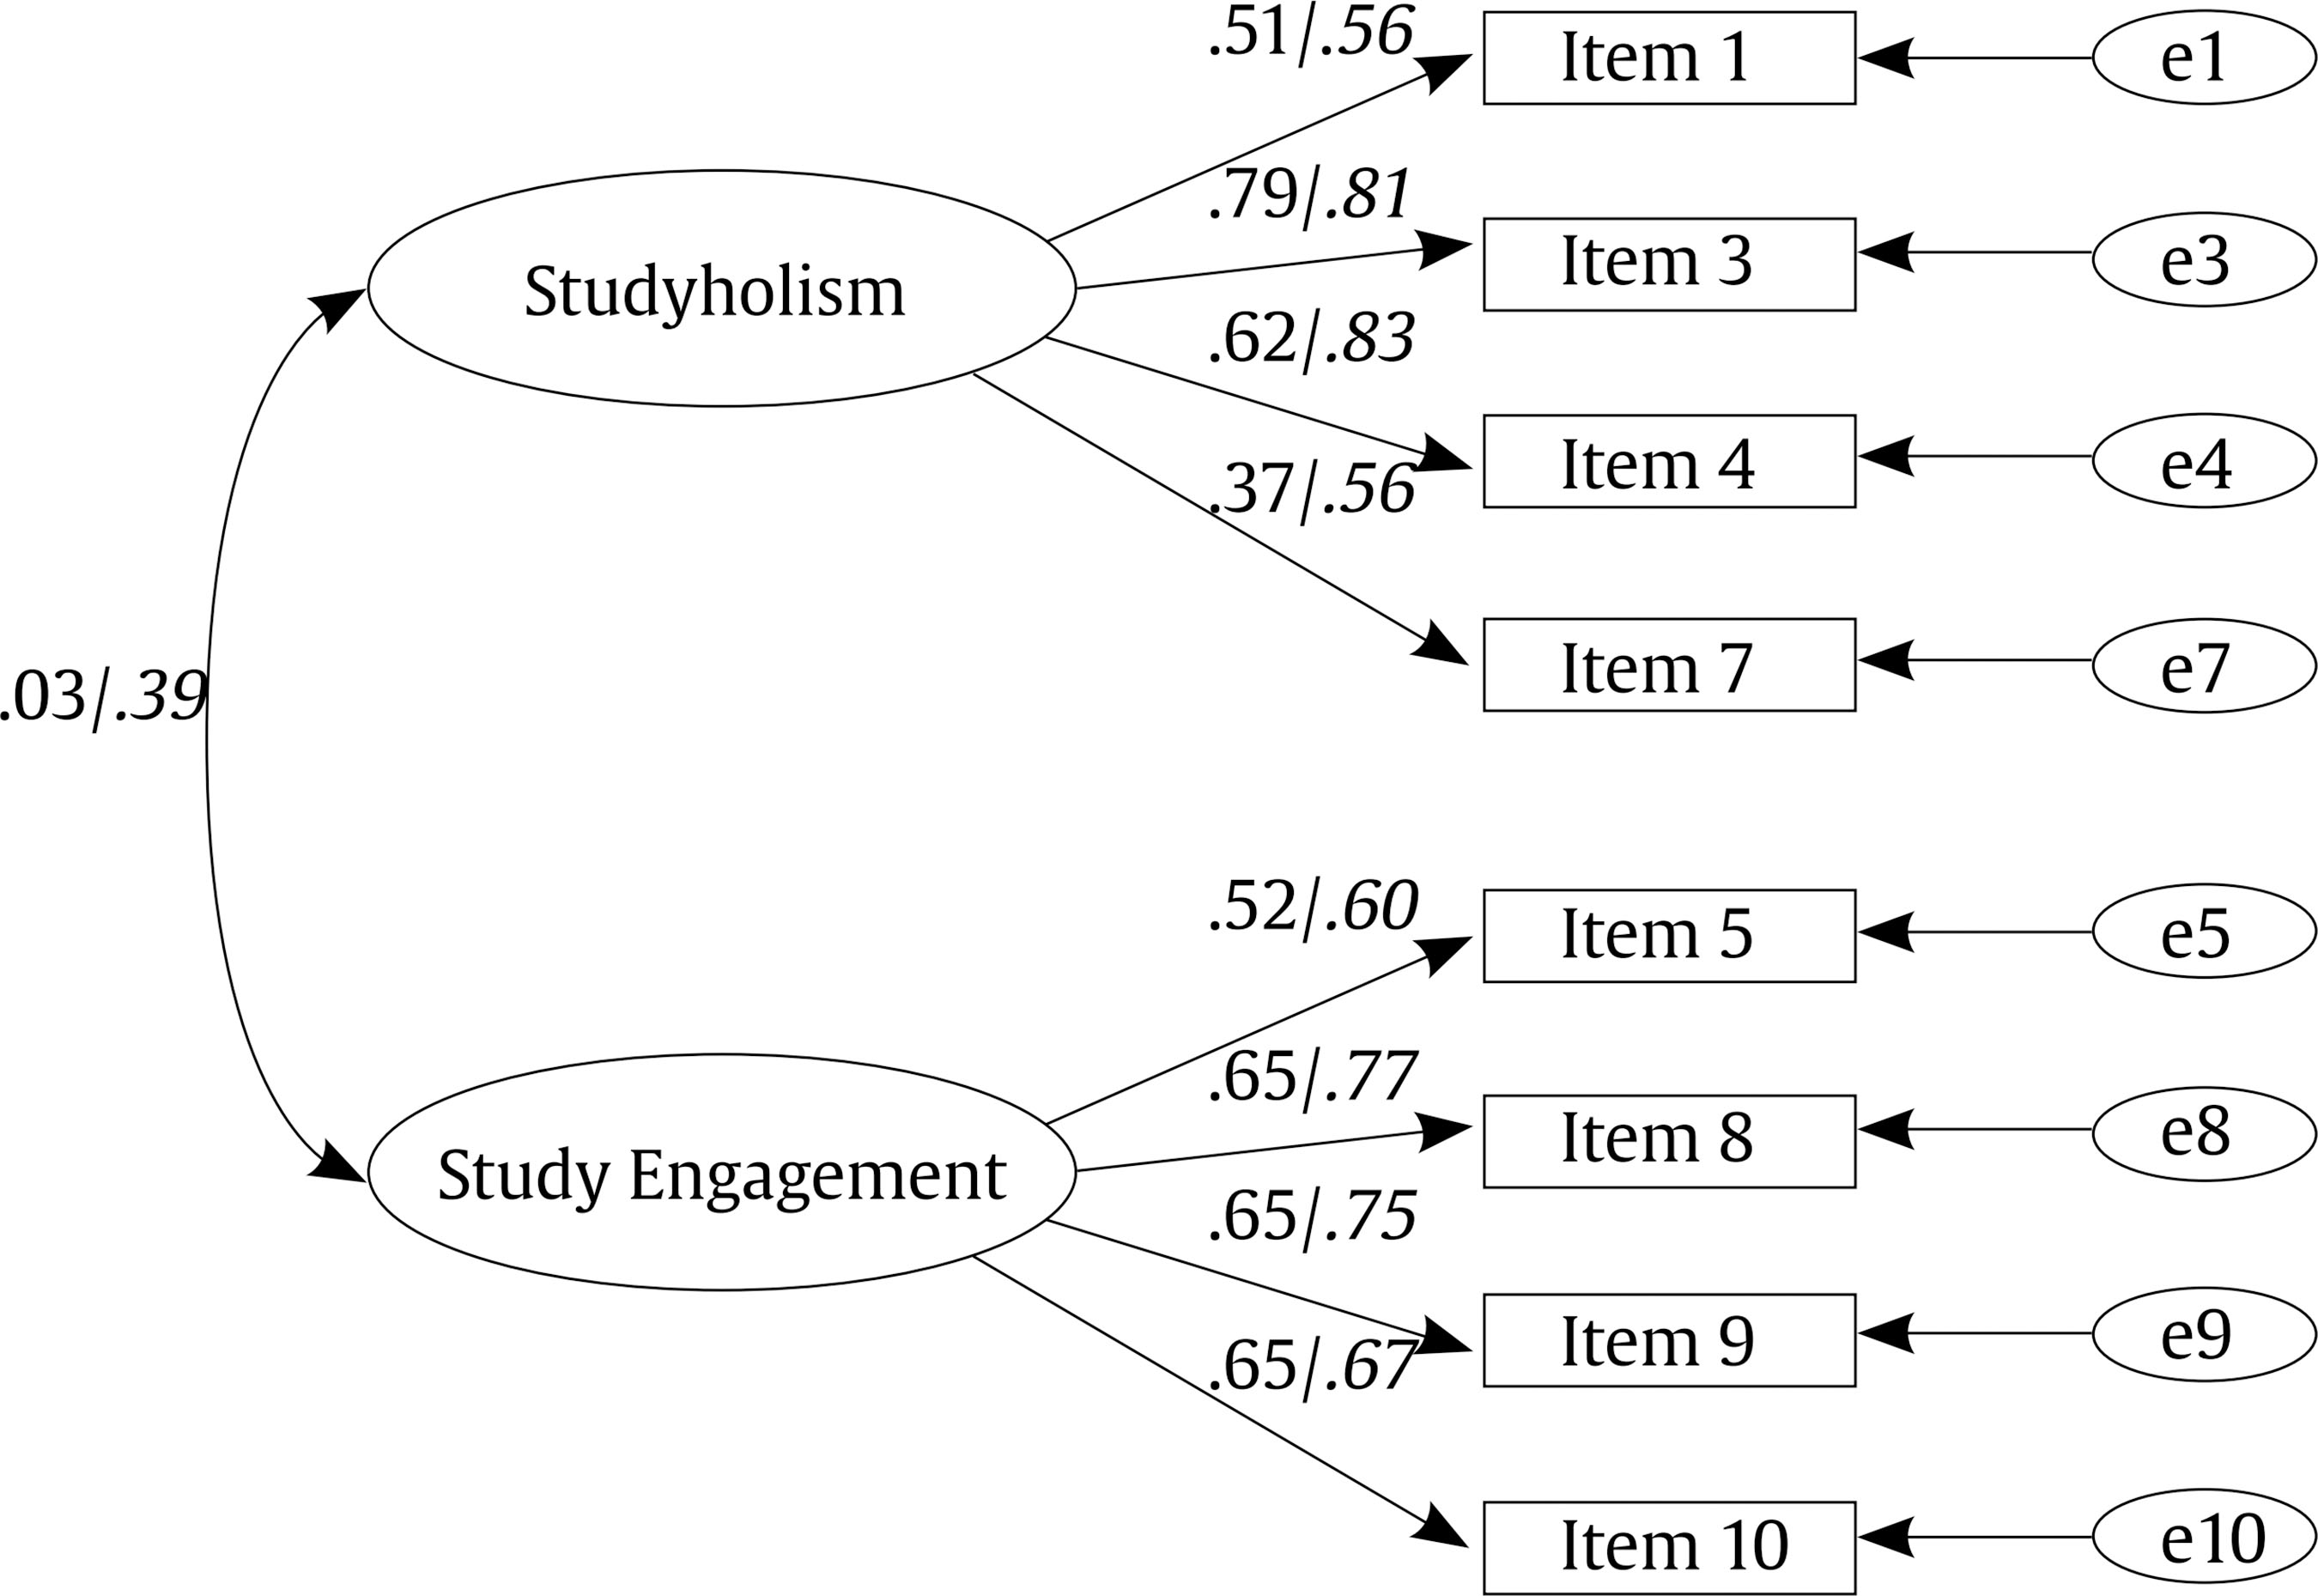 Note. Pre-adolescents n = 451, adolescents n = 446. The standardized factor loadings in italics are related to the adolescent sample. Convergent and divergent validity has not been evaluated on this sample, as the BStAS and the UWES-S-9 did not show a satisfactory fit on pre-adolescents. However, we analyzed the correlations between SH and SE and some study-related variables (i.e., hours of study per day generally and before school tests, days of study per week generally, and GPA). Table 3 shows the results of these analyses. Table 3 Correlation between Studyholism, Study Engagement, and Some Study-related Variables on Pre-adolescents (n = 451) and Adolescents (n = 446) 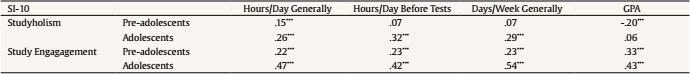 Note. SI-10 = Studyholism Inventory ***p ≤ .001. Adolescents In the adolescent sample, the CFA showed similar values to the ones found for pre-adolescents: χ2/df = 2.55 p < .001, GFI = .98, CFI = .97, RMSEA = .059, 90% CI [.039, .080], SRMR = .046. Figure 1 shows the graphical representations and the standardized factor loadings of the factor model. About the uniqueness of each studyholism item, these are the values: item 1 = .32, item 3 = .65, item 4 = .68, and item 7 = .31. About study engagement items, the values are: item 5 = .36, item 8 = .60, item 9 = .56, and item 10 = .45. Cronbach’s alpha values are higher on this sample: SH, .78 (item-total correlations ranging between .71 and .84); SE, .79 (item-total correlations ranging between .75 and .82). About McDonalds’ ω: studyholism = .79, 90% CI [.7, .82]; study engagement = .79, 90% CI [.76, .82]. Finally, we analyzed source of convergent and divergent validity evidence by means of the correlations between the subscales of the SI-10 and the BStAS and the UWES-S-9 (see Table 4). Lastly, we analyzed the correlations between SH and SE and some study-related variables (see Table 3). Table 4 Convergent and Divergent Validity of the Studyholism Inventory (SI-10) on the Adolescent Sample (n = 446) 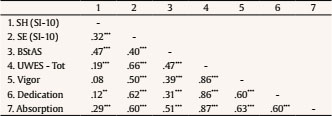 Note. Vigor, Dedication, and Absorption are from the UWES; SH = studyholism; SE = study engagement; BStAS = Bergen Study Addiction Scale; UWES – Tot = Utrecht Work Engagement Scale, Student and Short version, Total score. **p < .01, ***p < .001. Cut-off Scores for the Screening of the Four Types of Student Given the good psychometric properties of the SI-10 on both the pre-adolescent and adolescent samples, we calculated the cut-off scores for high/low SH and SE, which allow detecting four kinds of student: disengaged studyholics, engaged studyholics, engaged students, detached students. More specifically, we calculated t scores for the two scales (i.e., SH and SE) separately for pre-adolescents and adolescents. Then we looked for the raw scores corresponding to -1 SD (or 40 t score) and +1 SD (or 60 t score). Pre-adolescents The analyses showed that 8 and 15 are the cut-off scores for low and high SH, and 12 and 18 for low and high SE. Hence, students who score between 4 and 7 on SH have low levels of it, while those who score between 16 and 20 have high SH. About SE, a score between 4 and 11 indicates low SE, while a score between 19 and 20 means high SE. Using these cut-off scores, we found the following percentage values: high SH (18.6%, that is, 18.1% of the boys and 19.1% of the girls), low SH (12.9%), high SE (11.8%), and low SE (11.3%). See Table 5 for a graphical representation of the cut-off scores, as well as for the percentages of students belonging to the four types of student. Table 5 Profiling of the Four Types of Students by Means of the Studyholism Inventory (SI-10) and Its Cut-off scores and Percentage of the Four Types of Student for Pre-adolescents (n = 451) and Adolescents (n = 446) 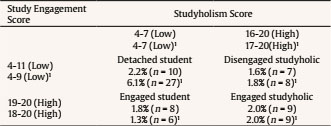 Note. 1Values of the adolescent sample. Adolescents The analyses showed that 8 and 16 are the cut-off scores for low and high SH, and 10 and 17 for low and high SE. Hence, students who score between 4 and 7 on SH have low levels of it, while those who score between 17 and 20 have high SH. About SE, a score between 4 and 9 indicates low SE, while a score between 18 and 20 means high SE. Using these cut-off scores, we found the following percentage values: high SH (11.9%, or 6.5% of boys and 16.3% of girls), low SH (15.9%), high SE (11.2%), and low SE (15.2%). See Table 4 for a graphical representation of these cut-off scores and the percentages of students belonging to the four types of student. Discrimination Index for the Items of the SI-10 Scales Pre-adolescents Referring to the cut-off values for high and low SH, we created a group of pre-adolescents with high SH (n = 84) and a group with low SH (n = 58). Then, we calculated the difficulty index for the four items belonging to the SI-10 SH scale. The difficulty indexes, for the high and low SH groups, respectively, are: item 1, .70 and 0; item 3, .89 and 0; item 4, .87 and .02; item 7, .85 and .10. Therefore, the discrimination indexes are .70 for item 1, .89 for item 3, .85 for item 4, and .75 for item 7. We repeated the same procedure for the SI-10 SE scale, hence calculating the difficulty index for the SE items in both the high SE (n = 53) and low SE (n = 51) groups. The difficulty index, for high and low SE are, respectively, 1 and 0 for item 5, 1 and .02 for item 8, 1 and .16 for item 9, 1 and .31 for item 10. Thus, the discrimination indexes are 1 for item 5, .98 for item 8, .84 for item 9, .69 for item 10. Adolescents Using the cut-off scores for this population, we created a group of students with high SH (n = 53) and a group with low SH (n = 71). The difficulty index for the four items belonging to the SI-10 SH scale, for the high and low SH groups, respectively, are: item 1, .85 and .01; item 3, .98 and 0; item 4, 1 and 0; item 7, .94 and .03. Therefore, the discrimination indexes are .84 for item 1, .98 for item 3, 1.0 for item 4, and .91 for item 7. About the SI-10 SE scale, the difficulty index for the SE items in the high SE (n = 50) and low SE (n = 68) group are, respectively, .92 and .03 for item 5, .98 and .03 for item 8, 1 and .01 for item 9, 1 and .10 for item 10. Thus, the discrimination indexes are .89 for item 5, .95 for item 8, .99 for item 9, .90 for item 10. Demographic and Study-related Differences We conducted some MANOVAs with SH and SE scales as dependent variables to analyze some demographic and study habits differences on both the pre-adolescent and adolescent samples. See Table 6 for the descriptive statistics of these analyses. Finally, we analyzed if there is an interaction effect of gender with the developmental level on SH and SE through a 2x2 MANOVA. Table 6 Mean (SD) of the Variables Analyzed by Studyholism, Study Engagement, and Developmental Stage  Pre-adolescents In this sample, we did not find statistically significant differences in SH. More specifically, there is no difference between boys and girls and among the three school years on SH (neither on SE). Also, there is not a statistically significant difference in SH between students who have repeated a school year, usually study on the weekend, and practice a sport/activity, and students who do not have repeated a school year, usually do not study on the weekend, and do not practice a sport/activity. However, there are some statistically significant differences on SE. The multivariate tests showed a statistically significant effect for having repeated a school year, [F(2, 448) = 6.42, p = .002, partial η2 = .03], usually studying on the weekend, [F(2, 448) = 12.98, p < .001, partial η2 = .06], and practicing a sport/activity, [F(2, 448) = 8.02, p < .001, partial η2 = .04]. More specifically, students who have not repeated a school year have higher SE than students who have repeated a school year: F(1, 449) = 12.14, p = .001, partial η2 = .03. Moreover, who usually study on the weekend, [F(1, 449) = 26.01, p < .001, partial η2 = .06], and practice a sport/activity, [F(1, 449) = 13.89, p < .001, partial η2 = .03], have higher levels of SE compared to the ones who do not. Adolescents About gender, the multivariate test showed a statistically significant effect: F(2, 443) = 53.40, p < .001, partial η2 = .19. Subsequent ANOVAs showed that girls have higher levels of both SH, [F (1, 444) = 65.46, p < .001, partial η2 = .13], and SE, [F(1, 444) = 65.05, p < .001, partial η2 = .13]. Next, concerning the school year, the multivariate test showed a statistically significant effect: F(8, 880) = 2.57, p = .009, partial η2 = .02. However, subsequent ANOVAs showed a statistically significant difference on SE only: F(4, 441) = 3.56, p = .007, partial η2 = .03. More specifically, the Bonferroni post-hoc test showed that students of the first year have a higher level of SE than students of the third year (p = .013). No other statistically significant differences were found among the five years of school. About the type of school, the multivariate test showed a statistically significant effect: F(4, 884) = 28.56, p < .001, partial η2 = .11. Follow-up ANOVAs showed a statistically significant effect on both SH and SE; respectively, F(2, 443) = 28.00, p < .001, partial η2 = .11, and F(2, 443) = 43.16, p < .001, partial η2 = .16. More specifically, Professional schools have lower level of SH than Technical and High School (p < .001), while there is not a statistically significant difference between Technical and High Schools. Moreover, High School students have higher SE than both Professional (p < .001) and Technical School (p = .003); also, Technical school students have higher SE than Professional school students (p < .001; High School > Technical School > Professional School). Having repeated a school year has a multivariate effect [F(2, 443) = 6.73, p = .001, partial η2 = .03], which is supported by follow-up ANOVAs for SE only: F(1, 444) = 12.78, p < .001, partial η2 = .03. Students who have not repeated a school year have higher SE. Usually studying on the weekend has a multivariate statistically significant effect [F(2, 443) = 44.96, p < .001, partial η2 = .17], which is supported by follow-up ANOVAs for both SH [F(2, 443) = 44.96, p < .001, partial η2 = .17], and SE [F(1, 444) = 81.21, p < .001, partial η2 = .06]. More specifically, who usually study on the weekend has higher level of both SH and SE. Finally, doing or not a sport/activity does not have an effect on SH and SE. Differences between Pre-adolescents and Adolescents We performed a 2 (developmental level) x 2 (gender) MANOVA with SH and SE as dependent variables. The multivariate test yielded significant effects for developmental level [F(2, 892) = 39.50, p < .001, partial η2 = .08], and gender [F(2, 892) = 44.42, p < .001, partial η2 = .09]. Also the developmental level by gender interaction was significant: F(2, 892) = 21.17, p < .001, partial η2 = .05. Follow-up ANOVAs showed that the developmental level has an effect on SE only: F(1, 893) = 77.51, p < .001, partial η2 = .08. More specifically, pre-adolescents have higher levels (15.08 ± 0.15) of SE compared to adolescents (13.22 ± 0.15). Gender has instead an effect on both SH [F(1, 893) = 46.44, p < .001, partial η2 = .05], and SE [F(1, 893) = 53.71, p < .001, partial η2 = .06]. Girls have higher levels of both SH (12.64±.17) and SE (14.29 ± 0.15) as compared to boys (respectively, 10.99 ± 0.18 and 13.38 ± 0.15). Finally, the interaction effect between the developmental level and gender has an effect on both SH [F(1, 893) = 23.47, p < .001, partial η2 = .03], and SE [F(1, 893) = 24.28, p < .001, partial η2 = .03] (see Figure 2). More specifically, girls have higher levels of SH in adolescence (13.24 ± 0.23) than in pre-adolescence (12.04 ± 0.24), while boys have higher SH in pre-adolescence (11.56 ± 0.24) than in adolescence (10.42 ± 0.26). Hence, while there is an increase of SH for girls with age, there is a decrease for boys. Both boys and girls have higher levels of SE in pre-adolescence, even if for males the decrease in SE is greater (from 14.82 ± 0.21 in pre-adolescence to 11.93 ± 0.22 in adolescence). For girls, SE levels in pre-adolescence and adolescence are respectively 15.33 ± 0.21 and 14.51 ± 0.20. Figure 2 Interaction Effect between Developmental Level and Gender on Studyholism and Study Engagement. 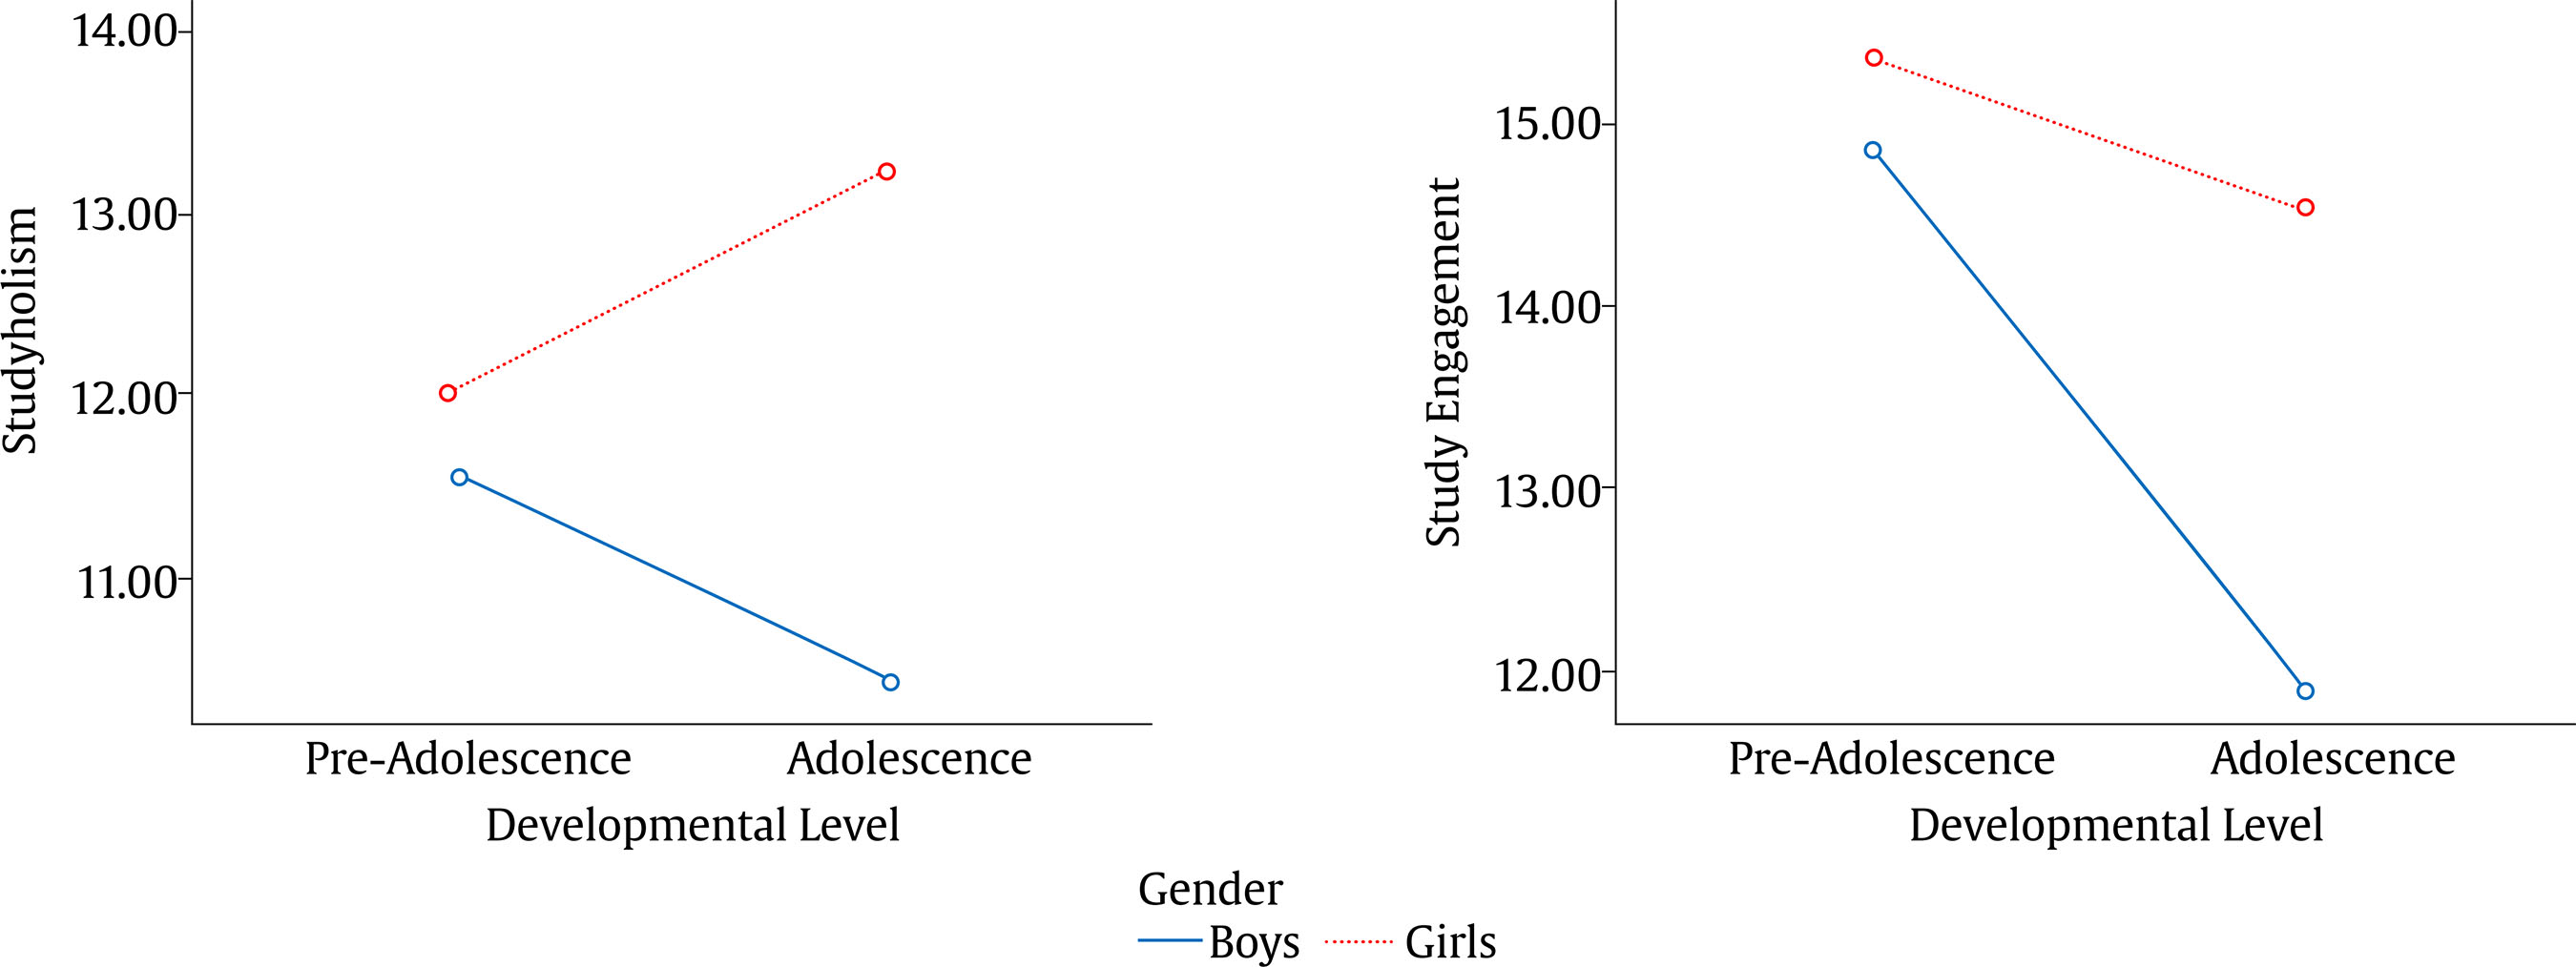 Studyholism (SH) and study engagement (SE) are two different forms of heavy study investment (HSI) that deserve to be analyzed and screened since pre-adolescence. Indeed, during this age, many physical, cognitive, and emotional changes arise, and pressures increase, which might fuel stress, psychological impairment, and dropout intention. The Studyholism Inventory (SI-10; Loscalzo, Giannini, & Golonka, 2018) is a brief screening instrument that has shown good psychometric properties for Italian college students (Loscalzo, Giannini, & Golonka, 2018; Loscalzo & Giannini, 2020). Hence, this study aimed to analyze this scale’s psychometric properties on a sample of Italian pre-adolescents and adolescents. The results supported the use of the SI-10 for both pre-adolescents and adolescents since the 2-factor and 8-item structure has shown an excellent fit in line with Loscalzo and Giannini (2020). Moreover, the internal consistency of the scale (evaluated through both Cronbach’s alpha and McDonald’s omega) is good for the adolescent sample, while it is satisfactory for the pre-adolescent sample. However, for the pre-adolescent sample, the alphas overreach the .60 cut-off value for new scales (Nunnaly & Berstein, 1994). Moreover, it should be considered that both scales are made up of four items only and the item-total correlations are good. Concerning convergent and divergent validity evidence sources, the analyses have been performed only for the adolescent sample. The preliminary analyses conducted on the pre-adolescent sample for using the BStAS (Atroszko et al., 2015) and the UWES-S-9 (Schaufeli & Bakker, 2004) did not support their use on the younger sample. However, in the adolescent sample we found support for both the convergent and divergent validity of the SI-10. The SH scale has a medium correlation with the BStAS (r = .47), which evaluates problematic overstudying using the addiction model instead of the obsessive-compulsive one. Hence, this value, in line with the results of Loscalzo and Giannini (2020) in college students, showed that even if the BStAS and the SI-10 SH scale evaluate the same problem behavior, they measure different aspects of this condition. Also, the SH scale has good divergent validity, as supported by the low correlations with the UWES-9-S total score and subscales. More specifically, the SI-10 SH scale does not correlate with the UWES-9-S vigor subscale, and it has a low correlation with both the UWES-9-S dedication subscale (r = .12) and the UWES-9-S total score (r = .19). The highest correlation value (even if still low, according to the cut-off suggested by Cohen, 1988) is with the absorption scale (r = .29). This value might be because both SH and SE are characterized by high time and energy investment in study and because some studyholics might also have high levels of SE (i.e., engaged studyholics; Loscalzo & Giannini, 2017b). This is also in line with the average factor correlation between SH and SE for the adolescent sample and the average correlation between the SH and SE SI-10 subscales. This might be due to a shared high absorption in studying and to the possible co-presence of SH and SE in some students. Regarding the SE scale, we found good convergent validity. The results showed high values of correlation with both the UWES-9-S total score and its subscales (values ranging between .50 and .66). However, we found a medium and positive correlation with the BStAS (r = .40) concerning divergent validity. Though, the BStAS has medium to high correlations with the UWES-9-S and all its subscales, with the highest correlation for absorption (.51) and the total score (.47). Hence, we speculate that this study’s lack of divergent validity further supports Loscalzo and Giannini’s (2018c, 2020) speculation that the BStAS does not adequately distinguish between study addiction and SE and that the SI-10 has better divergent validity as compared to the BStAS. Finally, concerning the correlations between SH and SE and some academic indicators, we found that, in adolescents, SH is associated with higher time investment in the study (both generally and before school tests). However, the correlations are generally low: the highest value is .32 and corresponds to the study hours per day before a school test. Moreover, there is only one statistically significant (and low) correlation in the pre-adolescent sample: it is between SH and hours of study per day generally. Regarding GPA, it is negatively associated with SH in pre-adolescence (r = -.20), while there is not a statistically significant correlation between SH and GPA in adolescence. The adolescents’ results about the correlation between SH, GPA, and time spent studying are in line with the findings by Loscalzo (2021) and Loscalzo and Giannini (2019a) in adolescent and college students, respectively. These two studies highlighted that SH does not predict GPA, while it predicts (with low beta values) the hours per day spent studying generally and before tests/exams. However, the beta values for adolescents are higher than those found in college students by Loscalzo and Giannini (2019a); hence, Loscalzo (2021) suggested that in adolescence SH might play a greater role in the time spent studying (compared to youths). Even if not using a path analysis model (but correlation analysis), the current study showed that SH might play a greater role in the time spent studying also compared to pre-adolescent students. Moreover, it highlights the critical need to distinguish between different stages of adolescence (i.e., pre-adolescents, adolescents, older adolescents) when studying the features of problematic behaviors, as previously suggested by Loscalzo and Giannini (2017c) regarding the analysis of the interpretation bias in socially anxious adolescents. About SE, instead, the values of correlations are positive and statistically significant for both time investment in study and GPA. More specifically, the pre-adolescent sample highlights low values of correlation (except for the high value with GPA), while the adolescent sample reports medium to high values of correlation. We speculate that the correlation values are higher in the adolescent sample than in the pre-adolescent sample because, at a higher age, students are more able to organize their time investment in studying accordingly to their inner motivation to study. Moreover, the correlations between SE and GPA are in line with Loscalzo (2021) and Loscalzo and Giannini (2019a) since they showed that SE is a positive predictor of academic performance for both adolescents and youths. Also, Loscalzo (2021) and Loscalzo and Giannini (2019a) found that SE is a predictor of hours per day of studying generally (average beta value) and before exams/school tests (lower beta value). Next, concerning the prevalence of SH and SE, as evaluated through the cut-off scores that we have selected based on the analyses on these samples, we found that SH is widespread in Italy. It is present at high levels on both the pre-adolescent (18.6%) and the adolescent (11.6%) samples, in line with the value found for college students (10.8%; Loscalzo & Giannini, 2018c). Also, it seems that SH is more prevalent at a younger age and that its prevalence decreases with adolescence and especially during college years. This trend might probably be because college is not mandatory for students and studyholics might have dropped out of school and decided not to continue their studies due to the academic, physical, and psychological impairment associated with SH (Loscalzo & Giannini, 2019a; Loscalzo, 2021). These results also support Loscalzo and Giannini’s (2017b) assertion that SH might arise during pre-adolescence. Concerning SE, instead, the prevalence is around 11% for all the ages: 11.8% (pre-adolescents), 11.2% (adolescents), and 12.1% (college students; Loscalzo & Giannini, 2020). Finally, it is interesting to note that the prevalence of detached students (i.e., students with low levels of both SH and SE) is high for adolescents (6.1%). It might suggest that, at this age, it is critical to increase SE to favor academic success and prevent early school leaving. Also, the detached student is the most prevalent type in all the schools’ levels, including college students. Hence, it seems critical to address low SE across all school levels. Finally, there are more disengaged studyholics than engaged studyholics in both the pre-adolescent and adolescent samples, in contrast with the college sample (Loscalzo & Giannini, 2020), in which engaged studyholics is the more prevalent type of studyholic. This might be explained by referring again to the fact that students usually attend university for their choice and, consequently, they might have higher levels of SE, even if in the context of SH. Finally, we analyzed some demographic and study-related differences on SH and SE for both the pre-adolescent and adolescent samples. About SH, we did not find statistically significant differences for pre-adolescents regarding the variables analyzed (i.e., gender, school year, having repeated a school year, usually studying on the weekend, and practicing a sport/activity). However, in adolescence, girls have higher levels of SH than boys. Moreover, adolescents usually studying on the weekend have higher SH levels than students who do not. Finally, there is a difference concerning the type of school: adolescents attending Professional schools have lower SH levels than peers attending both Technical and High schools. About SE, we found that both pre-adolescents and adolescents who have never repeated a school year and who usually study on the weekend have higher levels of SE as compared to students who have the opposite features. Moreover, pre-adolescents who practice a sport/activity have higher SE levels than peers who do not. In adolescence, there is also a gender difference, since girls have higher SE levels than boys. Moreover, adolescent students attending the first year of school have higher SE than students of the third year. Finally, concerning the type of school, High school students have the highest levels of SE, while Professional school students have the lowest levels: High school > Technical school > Professional school. Moreover, the analysis of the interaction between developmental level and gender showed that pre-adolescents have higher SE levels than adolescents, while there is no difference concerning SH levels. However, the interaction effect highlighted a decreasing SE level for both girls and boys with the transition from pre-adolescence to the adolescence phase. Instead, concerning SH, while girls have higher SH in adolescence, boys have higher SH in pre-adolescence. Hence, while studyholism increases with age for girls, it decreases for boys. In line with this, we also found that the percentage of boys and girls with high levels of studyholism is similar in pre-adolescence, while in adolescence it is higher for girls. These results support Loscalzo and Giannini’s (2017b; 2018a, 2018b, 2018c; 2019a) assertion that studyholism might be better conceptualized as an obsessive-compulsive related disorder rather than as a behavioral addiction (Atroszko et al., 2015). Obsessive-compulsive disorder is present at a slightly higher rate in females in adulthood. However, boys are usually characterized by an earlier onset (even in childhood) than females (American Psychological Association [APA, 2013]). This might explain the lack of difference we found between pre-adolescent boys and girls on studyholism (since also boys might have high OCD-related symptoms at a younger age), and the increase in studyholism for girls during adolescence since, in line with OCD, most of them might have a later onset of studyholism. It would be interesting to examine if, during adulthood, the prevalence becomes similar to the ones of males, like for OCD. Moreover, our results are in contrast with the gender-related prevalence rates of both substance and behavioral addictions: the prevalence of the addictions related to the use of substances (e.g., alcohol or cannabis) is higher in males than in females; moreover, gambling disorder (the only behavioral addiction recognized by APA) is more prevalent in males than in females (APA, 2013). Hence, to support the behavioral addiction model (Atroszko et al., 2015), gender results should have shown, at least in the older samples of adolescents and youths, a higher prevalence in males, which is not the case, at least in the present study. Concerning gender, the Italian college students’ findings (Loscalzo & Giannini, 2020) are similar to our adolescent sample: girls have higher levels of both SH and SE. Since in pre-adolescence there is not a difference between boys and girls on SH and SE, and taking into account that girls face an increase in SH during adolescence, we might speculate that it is in adolescence – where academic pressures are even higher as compared to both middle and primary schools – that the differences between gender might become evident and, next, they might stabilize during university years. In the same line, the college results about usually studying on the weekend are similar to the adolescent sample. In adolescence, this variable is associated with higher levels of both SH and SE, like for university students; instead, there is no difference in SH in pre-adolescence. Also, the results about doing an activity besides studying are similar to the adolescent sample since, for college students, there is no difference in neither SH nor SE. Again, we could speculate that this might be because SH features might stabilize during adolescence and last during youth. Nonetheless, concerning differences related to having (or not) repeated a school year, our results are in contrast with the college sample concerning SH: youths who have repeated a school year or are currently late with their study have both lower SE and higher SH – while there is not a difference in SH levels in pre-adolescents and adolescents. We can speculate that when students are younger they do not feel the pressure of getting their final degree soon; hence, being late with their studies might not be felt like a problem. For university students, instead, this might be a big issue to deal with (for example, trying to take more exams in a year) in order to have the Bachelor/Master degree as soon as possible for trying to have a job. Instead, the results about school-year differences contrast with college students for both our samples: college students have higher SE in their fifth year compared to the previous years (except for the fourth year). In our study, there is no difference in pre-adolescence; moreover, in adolescence they are the first-year students to have higher SE compared to the students of the third year. This might be because university students in their final year are near to their degree; hence, they might be more motivated to study to conclude their studies. Adolescent students, instead, might face a decrease in their SE level as academic pressures increases. Finally, the results related to the differences between the diverse types of school for adolescents might be because, generally, Professional schools’ teachers expect lower GPA levels from their students compared to the teachers of the other two types of schools. Moreover, Professional schools are usually chosen by students who do not want to attend university and prefer schools that foresee more practical subjects than theoretical ones. About the limitations and strengths of this study, we would like to point out that the main issue concerns the convergent and divergent validity analyses. Since the scales we administered as sources of convergent and divergent validity evidence did not show a good fit on the pre-adolescent sample, we could not evaluate these psychometric properties on our younger sample. Moreover, also for the adolescent sample, we should consider that the BStAS does not seem to distinguish adequately between problematic overstudying and SE. Hence, future studies should use other scales for evaluating divergent validity in the adolescent sample and for analyzing both convergent and divergent validity in the pre-adolescent sample. Also, as another limitation of our study, we did not gather some important socio-demographic characteristics of the participants, such as ethnicity, socio-economic status, and previous or current mental health status. Moreover, we used a convenience sample. Finally, we did not perform measurement invariance analyses, which would provide evidence for the possibility of comparing raw scores across different ages. Hence, considering the good psychometric properties found in pre-adolescents and adolescents (as highlighted in the current paper) and in youths – as found by Loscalzo and Giannini (2020) – future research should perform these analyses. Despite these limitations, this study has the merit of having analyzed the psychometric properties of the SI-10 on samples of pre-adolescents and adolescents balanced for gender. Moreover, concerning the secondary school of second grade, we have gathered participants from all three types of Italian schools. Finally, this study supports the use of the Studyholism Inventory (SI-10) in young students; hence, it might be used for both research and preventive and clinical purposes as it allows to evaluate both positive and negative types of heavy study investment since pre-adolescence. The Studyholism Inventory (SI-10) is a brief self-report scale that allows evaluating two main types of heavy study investment: studyholism (or obsession toward study) and study engagement. Also, referring to the SI-10 cut-off for defining high and low studyholism/study engagement, it is possible to screen in the general population four types of student: engaged studyholics, disengaged studyholics, engaged students, detached students. This study supports its use on both pre-adolescents and adolescents, as the scale showed good psychometric properties on both samples. This instrument might be used for research purposes, especially to analyze the characteristics of studyholism since pre-adolescence, when this potential clinical condition might arise (Loscalzo & Giannini, 2017b) and when it is widespread, as shown by the present study (prevalence of high studyholism: 18.6%). Also, it could be used for both preventive and clinical purposes. More specifically, it might be easily administered by professional figures and the teachers to screen for both studyholism and study engagement levels and detect students at-risk for early school dropout. Moreover, as it allows to distinguish between engaged and disengaged studyholics, it might be useful in the clinical setting to tailor the intervention to the specific type of student. In fact, as shown by Loscalzo and Giannini (2019a) in their study on college students, even if both types of studyholics are characterized by impairment in some functional areas, they have some differences concerning their antecedents and outcomes. Finally, this study provides critical insights for the theoretical definition of problematic overstudying: since the prevalence of studyholism is similar between boys and girls during pre-adolescence, while in adolescence is higher in girls, it seems that this new potential clinical condition might be better defined as an obsession toward study, or as an obsessive-compulsive related disorder. Indeed, for supporting the behavioral addiction model, we speculate that we should have found a higher prevalence of the condition in boys. Also, the results related to decreasing study engagement levels in both males and females highlight the need for interventions to change the Italian school system to increase the students’ level of study engagement. Conflict of Interest The authors of this article declare no conflict of interest. Cite this article as: Loscalzo, Y., Giani, J., & Giannini, M. (2023). Heavy study investment in pre-adolescence and adolescence: Psychometric properties of the studyholism inventory (SI-10). Psicología Educativa, 29(1), 109-120. https://doi.org/10.5093/psed2022a17 References |
Cite this article as: Loscalzo, Y., Giani, J., & Giannini, M. (2023). Heavy Study Investment in Pre-adolescence and Adolescence: Psychometric Properties of the Studyholism Inventory (SI-10). PsicologĂa Educativa, 29(1), 109 - 120. https://doi.org/10.5093/psed2022a17
Correspondence: yura.loscalzo@gmail.com (Y. Loscalzo).Copyright © 2026. Colegio Oficial de la Psicología de Madrid


 PDF
PDF e-PUB
e-PUB CrossRef
 JATS
JATS Imprimir
 Enviar
ALERTA POR E-MAIL
La Revista de Psicología Educativa está distribuida bajo una licencia de Creative Commons Reconocimiento-NoComercial-SinObra Derivada 4.0 Internacional.com