Validation of Clinically Significant Effect Size Indices in Single-case Designs
[La validaciĂłn de los Ăndices del tamaño del efecto clĂnicamente significativo en los diseños de caso Ăşnico]
Ashley Navarro-McCarthy, Jesús Sanz, Clara Gesteira, Beatriz Cobos, Belén Reguera, Noelia Morán, & María P. García-Vera
Universidad Complutense de Madrid, Spain
https://doi.org/10.5093/clh2025a19
Received 15 May 2025, Accepted 16 June 2025
Abstract
Background: The aim of the study was to examine the validity of clinically significant effect size (CSES) indices proposed by Sanz and García-Vera (2015) for data analysis of single-case designs. The CSES indices bring together nonoverlap effect size (NES) indices with the statistical approach to clinical significance of Jacobson and Truax. Method: A total of 30 patients with posttraumatic stress disorder who had received psychological treatment were assessed using multiple measures of posttraumatic stress symptomatology. Correlational analyses were conducted to examine the association between CSES indices and three NES indices (PND, PEM, and NAP), as well as with two therapeutic success criteria at posttreatment. Results: CSES indices were found to correlate significantly with the NES indices (r = .48-1.00) and with the two posttreatment criteria (r = .37-|.62|). Conclusions: These results support the convergent and criterion validity of the CSES indices for data analysis of single-case designs.
Resumen
Antecedentes: El objetivo del estudio fue examinar la validez de los índices de tamaño del efecto clínicamente significativo (CSES) propuestos por Sanz y García-Vera (2015) para el análisis de datos en diseños de caso único. Estos índices combinan los índices de no superposición (NES) con el enfoque estadístico de significación clínica de Jacobson y Truax. Método: Se evaluó a 30 pacientes con trastorno de estrés postraumático que habían recibido tratamiento psicológico mediante diversas medidas de sintomatología. Se realizaron análisis correlacionales entre los índices CSES y tres índices NES (PND, PEM y NAP), así como con dos criterios de éxito terapéutico tras el tratamiento. Resultados: Los índices CSES mostraron correlaciones significativas con los NES (r = .48-1.00) y con los criterios postratamiento (r = .37-|.62|). Conclusiones: Los resultados respaldan la validez convergente y de criterio de los índices CSES en el análisis de diseños de caso único.
Palabras clave
Estudio de caso Ăşnico, Análisis de datos, Tamaño del efecto, SignificaciĂłn clĂnica, ValidezKeywords
Single-case designs, Data analysis, Effect size, Clinical significance, ValidityCite this article as: Navarro-McCarthy, A., Sanz, J., Gesteira, C., Cobos, B., Reguera, B., Morán, N., & García-Vera, M. P. (2025). Validation of Clinically Significant Effect Size Indices in Single-case Designs. Clinical and Health, 36(3), 163 - 169. https://doi.org/10.5093/clh2025a19
Correspondence: ashleyna@ucm.es (A. Navarro-McCarthy).One of the strategies that has been proposed to bridge the gap between research and clinical practice, while also meeting the need to empirically support the efficacy and clinical utility of psychological treatments, is to carry out and disseminate studies using single-case designs, especially the so-called quasi-experimental ones. The data from such studies could not only contribute directly to the scientific knowledge base of therapeutic practices but also generate hypotheses that can be examined with more rigorous designs and help ensure that treatment research is more aligned with and relevant to clinical practice (Kazdin, 2008). Traditionally, data analysis in studies with single-case designs has been carried out through a visual analysis of the graphical presentation of data collected during the baseline phase(s) and the treatment phase(s) (Bono Cabré & Arnau Gras, 2014; Kratochwill et al., 2013). However, due to its relative subjectivity, visual analysis presents several problems, such as low interrater reliability and a tendency to commit type I errors (Campbell & Herzinger, 2010). Moreover, since studies with single-case designs can vary greatly in their basic characteristics (e.g., duration of baseline and treatment phases, number and types of measures, number of phases, etc.), it is very difficult, through visual analysis alone, to compare the results of different studies (e.g., whether a treatment was more effective than in previous studies) or even the results within a single study (e.g., whether a treatment was more effective for depressive symptoms than for anxiety symptoms, or for one patient compared to another). To address some of these problems, various statistical techniques for analyzing the results have been proposed (e.g., time series analysis, randomization-based nonparametric tests, effect size indices based on nonoverlap of data between phases), as these provide a quantitative method for measuring therapeutic change and for comparing the results within a single study or between different studies, as well as a set of rules to objectively determine whether that change is significant or relevant (Bono Cabré & Arnau Gras, 2014; Manolov & Rochat, 2024; Sanz & García-Vera, 2015). Effect Size Indices Based on Nonoverlap of Data Among the statistical techniques for single-case designs, the effect size indices based on nonoverlap of data between phases stand out for their usefulness in clinical practice (Manolov & Rochat, 2024; Parker et al., 2011; Sanz & García-Vera, 2015). These indices, which we will refer to as NES (non-overlap effect size) indices, do not attempt to test the statistical significance of the therapeutic effect or change, but do allow that change to be quantified and its magnitude to be assessed, thereby overcoming some of the problems associated with visual data analysis. To do this, NES indices express as a percentage the number of treatment data points that represent a reduction in dysfunctional variables (or an increase in functional variables) relative to baseline. Moreover, compared to other statistical analysis techniques, NES indices appear particularly useful for analyzing the single-case designs typically carried out in clinical practice. For example, time series analysis requires a very large number of data points in both baseline and treatment phases and is complex in terms of statistical knowledge and computational work. Randomization-based nonparametric tests, on the other hand, require delaying the start of treatment until a moment determined by a random procedure, without considering the ethical, practical, and clinical reasons that may call for the treatment to begin as soon as possible or at another more appropriate time. Unlike the other two types of analysis, NES indices can be calculated with very few data points in either the baseline or treatment phases. They are extremely simple to compute, even manually from data graphs, and do not require randomizing the timing of the treatment. Instead, treatment can be applied based on clinical or practical considerations. Several NES indices have been proposed (Parker et al., 2011), but among them the percentage of nonoverlapping data, the percentage of data exceeding the median, and the nonoverlap of all pairs index stand out, known by their English acronyms as PND, PEM, and NAP, respectively. PND and PEM are outstanding for their ease of calculation and popularity (Escudero et al., 2018; Peltier et al., 2024; Scruggs & Mastropieri, 2013), while NAP stands out for its strong statistical performance (Manolov et al., 2011; Parker et al., 2011). PND is defined as the percentage of treatment phase data points that surpass the most extreme data point from baseline, and is calculated by counting the number of treatment phase data points that exceed (above, in the case of functional variables, or below, in the case of dysfunctional ones) the most extreme data point from baseline, and dividing this number by the total number of data points in the treatment phase (Mastropieri & Scruggs, 1985-1986). Despite its limitations, it is one of the oldest and most widely used indices and, therefore, the one that most easily allows comparison of a given study’s results with those in the scientific literature (Scruggs & Mastropieri, 2013). PEM is defined as the percentage of treatment phase data points that exceed (above for functional variables or below for dysfunctional ones) the median of the baseline data (Ma, 2006). It is calculated by dividing the number of treatment phase data points that exceed the baseline median by the total number of data points in the treatment phase. Finally, NAP, developed by Parker and Vannest (2009) to address limitations of other NES indices such as PND and PEM, considers all possible overlaps between baseline and treatment data. As such, it can be interpreted as the percentage of nonoverlapping data between the two phases. NAP is calculated by pairing each baseline data point with each treatment data point, then: (a) counting all nonoverlaps, meaning pairs in which the treatment data point exceeds the baseline point in the functional direction; (b) counting all ties, which are pairs where the values are equal; (c) adding the number of nonoverlaps to half the number of ties; and (d) dividing this sum by the total number of possible pairs between baseline and treatment data points. Clinically Significant Effect Size Indices Each NES index has its advantages and disadvantages (Dowdy et al., 2021; Parker et al., 2011), but they all share the limitation that a therapeutic change of large magnitude does not necessarily imply that such a change is clinically significant. It is true that, generally, therapeutic effects of large magnitude tend also to be clinically significant, but it is still possible to obtain NES indices equal to 100% in a single-case design without the therapeutic changes necessarily having a clear impact on the patient’s daily functioning or being large enough to assume that the patient has recovered from their psychological disorder and returned to normal functioning. To overcome this limitation, Sanz and García-Vera (2015) proposed combining NES indices with the evaluation of the clinical significance of the therapeutic change in order to create clinically significant effect size indices, which will be referred to from now on as CSES indices, based on the initials of their name in English (clinically significant effect size). Specifically, the CSES indices involve combining the statistical approach to clinical significance of Jacobson and Truax (1991) with the NES indices, in such a way that the data overlap between baseline and the treatment phase is assessed based on whether the treatment data point represents a clinically significant improvement or recovery compared to the baseline data point. Jacobson and Truax’s (1991) method assumes that a clinically significant change would mean that a patient’s score on an instrument measuring a relevant psychological construct (e.g., depression, anxiety, quality of life) no longer belongs to the distribution of scores on that instrument for a dysfunctional population (e.g., Spanish patients with psychological disorders), but rather to the distribution of a functional population (e.g., the general Spanish population). Consequently, to determine the existence of a clinically significant change in a patient, the Jacobson and Truax’s (1991) method involves, first, establishing a cutoff score (C) on the reference instrument that the patient must reach in order to move from a dysfunctional to a functional distribution. To this end, the authors propose three operational definitions of C, of which, if information from both distributions is available, the best is the weighted midpoint between the means of the functional and dysfunctional distributions, given by the following formula: In this formula, SDn and SDp represent the standard deviations of the instrument in the normal (or general) and patient populations, respectively, and Mn and Mp are the means of the instrument in the normal and patient populations, respectively. Based on this first criterion from the Jacobson and Truax’s (1991) method, a CSES recovery index could be proposed, defined as the percentage of treatment phase data points that indicate a clinically significant recovery. It would be calculated by counting the number of treatment data points that exceed the cutoff value C (above in the case of functional variables or below in the case of dysfunctional ones) and dividing this number by the total number of data points in the treatment phase. Its calculation formula would be the following: Secondly, the Jacobson and Truax’s (1991) method involves estimating whether the change indicated by the scores on an instrument is not due to measurement error but instead reflects a reliable, real change in the psychological construct of interest. To do this, the authors propose a “reliable change index”, or RCI, which takes into account the standard error of the difference between two scores on the instrument (sdif) and is calculated using the following formulas: In these formulas, x2 is the patient’s score on the instrument at a given time (e.g., posttreatment), x1 is the score at an earlier time (e.g., pretreatment), sx is the standard deviation of the instrument scores in the patient population, and rxx is the internal consistency reliability of the instrument in that population. Based on this second criterion, a treatment phase data point could be considered a clinically significant improvement compared to the baseline data if it represents a change in the direction of functionality that exceeds the standard error of the difference between two scores on the instrument (sdif). Therefore, if the comparison point from baseline is the most extreme value, a PND for improvement could be calculated; if the comparison point is the baseline median, a PEM for improvement could be calculated; and if all possible comparisons between baseline and treatment data are taken into account, a NAP for improvement could be calculated. The formulas for calculating these three indices would be the following: The standard error of the difference between two scores (sdif) describes the range of the distribution of change scores that would be expected if no real change occurred, such that an RCI greater than 1.96 would be very unlikely (p < .05) to occur without a real change having taken place. Consequently, in the original method by Jacobson and Truax (1991), the difference between the treatment and baseline data must exceed the value obtained by multiplying sdif by 1.96 in order to ensure, with a 95% confidence level, that the change is not due to measurement error of the instrument. However, this is a very strict criterion compared to the NES indices, which only require that the treatment and baseline data do not overlap, that is, that they are not equal, even if the difference is only one point. In the present proposal, an intermediate solution is chosen by relaxing the overly strict criterion of Jacobson and Truax (1991) and requiring that the difference between the treatment data point and the baseline data point exceed sdif, but not necessarily the product of sdif and 1.96. Objective of this Study The aim of this study was to examine the validity of the CSES indices proposed by Sanz and García-Vera (2015). To that end, data were analyzed from a group of patients who had received psychological treatment for posttraumatic stress disorder (PTSD) resulting from a terrorist attack they had experienced many years earlier. For each patient, NES indices (PND, PEM, and NAP) and CSES indices (CSES recovery, PND improvement, PEM improvement, and NAP improvement) were calculated based on the measures of posttraumatic stress symptomatology obtained during baseline and treatment phases. These groups of indices were then correlated with each other to assess their convergent validity and also with various posttreatment criteria of therapeutic success or effectiveness in order to assess their criterion validity. Participants Data from two published studies were reanalyzed to examine the efficacy and clinical utility of trauma-focused cognitive behavioral therapy (TF-CBT) in victims of terrorism suffering from very long-term emotional disorders (Gesteira et al., 2025; see also Gesteira et al., 2018; Moreno et al., 2019). For this study, all participants from those two studies were selected who had received a DSM-IV diagnosis of PTSD related to a terrorist attack based on a structured diagnostic interview administered at pretreatment, had completed the instrument for assessing posttraumatic stress symptomatology at all measurement time points before, during, and after treatment, and had also completed the structured diagnostic interview at posttreatment. The final sample of the present study consisted of 30 adults, 12 men and 18 women, aged between 32 and 65 years (mean age = 46, SD = 10.5). The ages at which they had experienced the terrorist attack ranged from 3 to 57 years, with a mean of 27.6 years, and an average of 18.4 years had passed from the time of the attack to their participation in the studies. Of the patients, 62.7% had been injured in the terrorist attack, 20.3% were relatives of individuals injured in an attack, 10.3% were relatives of individuals killed in an attack, and the remaining 6.7% had been injured in an attack and were also relatives of someone who had been killed or injured in the attack. Variables and Instruments PTSD Diagnosis The Spanish translation of Module F (Anxiety and Other Disorders) of the Structured Clinical Interview for DSM-IV Axis I Disorders, Clinical Version (SCID-I-CV; First et al., 1999) was used. Posttraumatic Stress Symptomatology The specific version of the PTSD Checklist (PCL-S; Weathers et al., 1993) was used, in its Spanish adaptation with modified instructions to assess the effects of terrorist attacks (Vázquez et al., 2006). The PCL-S consists of 17 items designed to assess the presence and severity of posttraumatic stress symptoms over the past month, based on DSM-IV criteria. Each item is rated on a Likert-type scale (from 1 to 5), allowing for a total score between 17 and 85. The PCL-S has demonstrated good psychometric properties in Spanish victims of terrorism, both in face-to-face and telephone administration (Cobos Redondo et al., 2021). Procedure After providing verbal informed consent, all participants voluntarily completed a psychological assessment by telephone, during which the PCL-S was administered. Subsequently, after signing a written informed consent form, they completed an in-person psychological assessment in which both the SCID-I-CV and the PCL-S were administered. After receiving a PTSD diagnosis, participants voluntarily began—after signing a new informed consent form—an individual and free of charge trauma-focused cognitive behavioral therapy (TF-CBT) program consisting of 16 sessions, each lasting 60-90 minutes and held weekly. Before the start of each odd-numbered treatment session, patients completed the PCL-S. After the 16 weeks of treatment, patients were reassessed with the SCID-I-CV and the PCL-S in the posttreatment evaluation. All assessments and treatments were carried out by licensed general health psychologists with postgraduate training in clinical psychology and in providing psychological care to victims of terrorism, including specific training in the assessment protocol and the TF-CBT program. Further details of the procedure can be found in Gesteira et al. (2018), Gesteira et al. (2025), and Moreno et al. (2019). Statistical Analyses The PCL-S scores from the pre-treatment telephone assessment, the pre-treatment in-person assessment, and the beginning of the first treatment session were considered as baseline measures, and the PCL-S scores from treatment sessions 3, 5, 7, 9, 11, 13, and 15 were considered as treatment phase measures. Based on these baseline and treatment measures, and for each patient, the PND, PEM, and NAP indices were calculated using the web application by Pustejovsky et al. (2024), and the CSES indices—CSES recovery, PND improvement, PEM improvement, and NAP improvement—were calculated manually and using the individual patient graphs. To calculate these indices, we used the cutoff value (C = 29.17) and the standard error of the difference (sdif = 6.06) for the PCL-S, as reported by Sanz and García-Vera (2015) based on data from Reguera et al. (2014), who studied a sample of 589 victims of terrorist attacks. Accordingly, for each patient, a PCL-S score in the treatment phase that represented a decrease of more than 6 points compared to the most extreme baseline PCL-S score (PND improvement), compared to the median of the baseline PCL-S scores (PEM improvement), or in a pairwise comparison between baseline and treatment PCL-S scores (NAP improvement) was considered an improvement data point, whereas a PCL-S score below 29 in the treatment phase was considered a recovery data point (CSES recovery). Descriptive statistics were calculated for all indices, and to examine the convergent validity of the new indices, Pearson correlation coefficients were calculated between the NES and CSES indices. To examine the criterion validity of the NES and CSES indices, their Pearson correlation coefficients were calculated with the following three therapeutic success or effectiveness criteria assessed at posttreatment: the total score on the PCL-S, the absence of a PTSD diagnosis, and clinically significant recovery defined as a PCL-S score below 29, with the latter two criteria being dichotomous. Descriptive Statistics of the NES and CSES Indices and of the Therapeutic Success Criteria Table 1 presents the means, standard deviations, and ranges of the NES and CSES indices. Taking into account the conventional values for interpreting NES indices (Ma, 2006; Parker & Vannest, 2009; Scruggs & Mastropieri, 1998), the means of the PND, PEM, and NAP indices indicated that, in the patient group of the present study, treatment effectiveness was questionable (50% ≤ PND < 60%), the treatment was moderately effective (70% ≤ PEM < 90%), and the treatment effect size was medium (66% ≤ NAP < 92%), respectively. Table 1 Descriptive Statistics of the Nonoverlap-based Effect Size Indices and the Clinically Significant Effect Size Indices 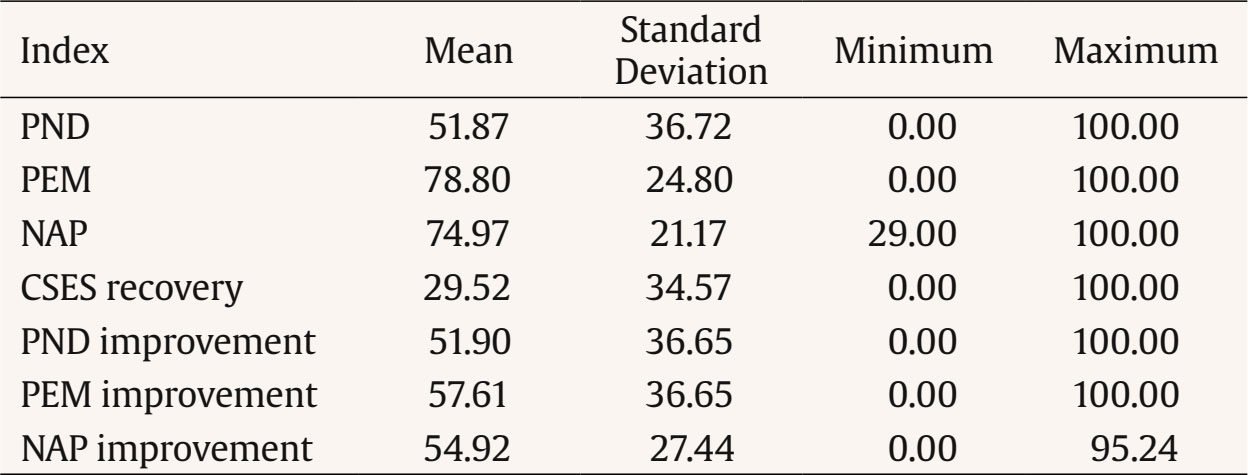 Note. N = 30. CSES = clinically significant effect size index; NAP = nonoverlap of all pairs index; PEM = percentage of data exceeding the median; PND = percentage of nonoverlapping data. As for the posttreatment therapeutic success criteria, the mean PCL-S score was 26.8 (SD = 9.1, range = 17-57), 86.7% of patients no longer had a PTSD diagnosis, and 66.7% showed clinically significant recovery—that is, a PCL-S score below 29. Convergent Validity of the NES and CSES Indices Table 2 presents the correlations between the NES and CSES indices. The CSES indices showed significant correlations with the NES indices which, according to Cohen’s (1988) standards, were large in size (r ≥ .50), with values ranging from .58 to .91, except for the correlation between the CSES recovery index and the PEM, which was .48. On the other hand, indices based on similar calculations showed not only significant but also very large correlations, such that correlations among the NES indices ranged from .67 to .91, and correlations among the CSES improvement indices (PND improvement, PEM improvement, and NAP improvement) ranged from .73 to .90. Interestingly, the CSES recovery index showed significant correlations with the CSES improvement indices (ranging from .52 to .58) that were very similar to the significant correlations it had with the NES indices (ranging from .48 to .59). Table 2 Correlations between Effect Size Indices for Single-case Designs 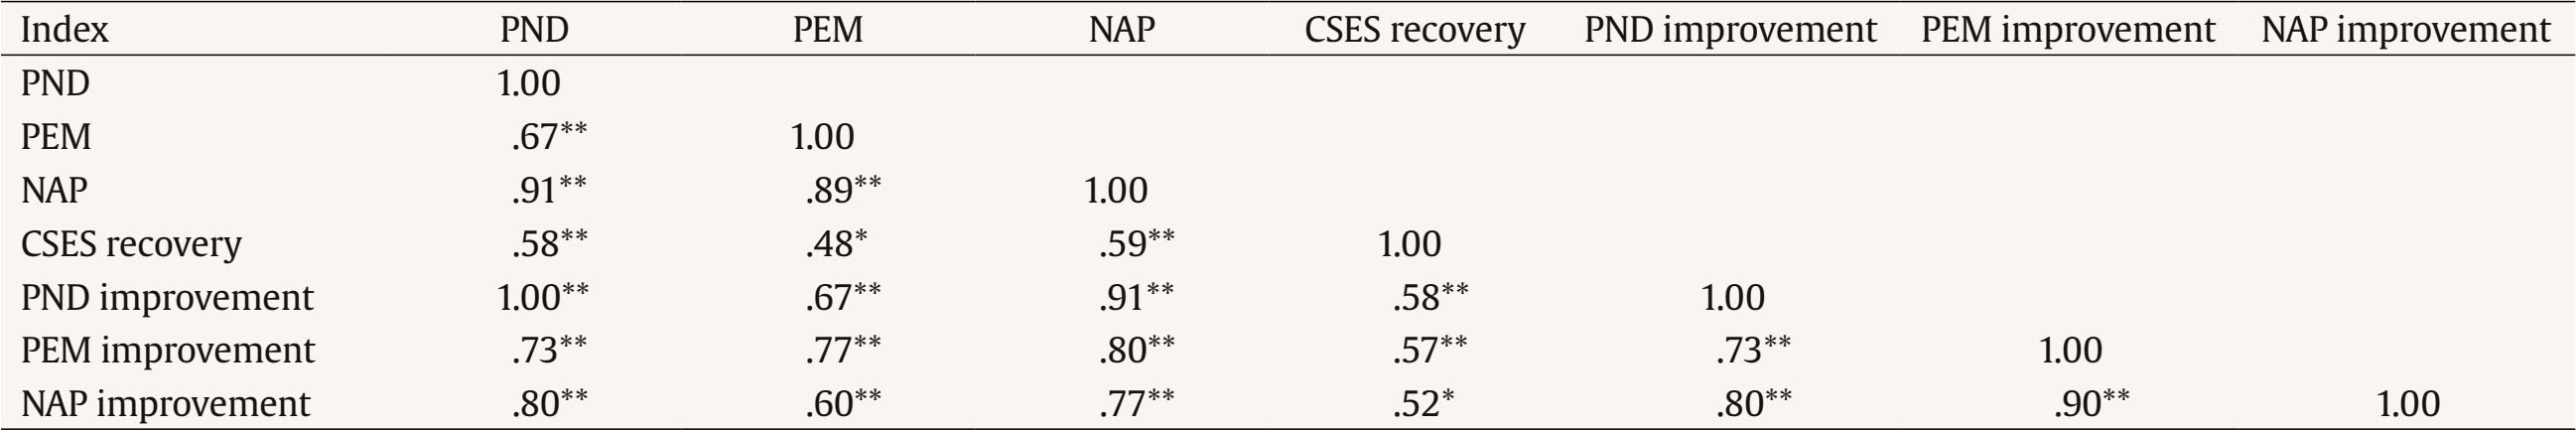 Note. N = 30. CSES = clinically significant effect size index; NAP = nonoverlap of all pairs index; PEM = percentage of data exceeding the median; PND = percentage of nonoverlapping data. *p < .05 (two-tailed), **p < .01 (two-tailed). Criterion Validity of the NES and CSES Indices Table 3 presents the correlations of the NES and CSES indices with the therapeutic success criteria assessed at posttreatment. All indices showed statistically significant, negative, and large correlations with PCL-S scores at posttreatment, with correlations ranging from -.47 to -.65. Similarly, all indices, except for the PEM improvement index, showed statistically significant, positive, and medium-sized correlations with the recovery criterion at posttreatment, with correlations ranging from .35 to .49. However, no index, except for PEM, showed a statistically significant correlation with the absence of a PTSD diagnosis at posttreatment; in the case of PEM, the correlation was significant and medium to large in size (r = .40). Table 3 Correlations between Effect Size Indices for Single-case Designs and Posttreatment Therapeutic Success or Effectiveness Criteria 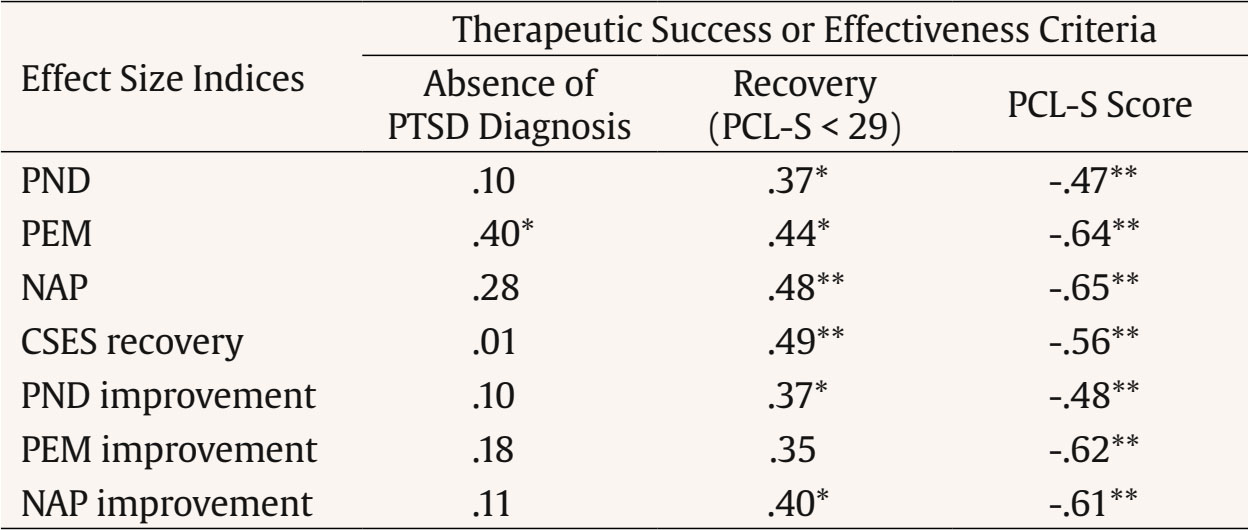 Note. N = 30. CSES = clinically significant effect size index; NAP = nonoverlap of all pairs index; PCL-S = PTSD checklist, specific version; PEM = percentage of data exceeding the median; PND = percentage of nonoverlapping data; PTSD = posttraumatic stress disorder. *p < .05 (two-tailed), **p < .01 (two-tailed). The main objective of the present study was to examine the convergent and criterion validity of the CSES indices, a set of new indices proposed by Sanz and García-Vera (2015) for analyzing the results of single-case designs. The CSES indices combine the NES indices with the statistical approach to clinical significance proposed by Jacobson and Truax (1991), aiming to overcome the common limitation of NES indices: that a therapeutic change of large magnitude according to these indices does not necessarily imply that the change is clinically significant. For example, for participants 1 and 24 in the present study, NAP indices of 95% were obtained in both cases; however, the NAP improvement indices were, respectively, 76.2% and 33.3%. According to Parker and Vannest’s (2009) standards for NAP, TF-CBT produced a large effect in both participants, as 95% of the treatment data for each showed improvement over baseline. However, the nature of this improvement differed between them. For Participant 1, most of the improvement was clinically significant: their NAP improvement index showed that 76.2% of the treatment data reflected a meaningful reduction in posttraumatic stress symptoms—beyond what could be explained by measurement error on the PCL-S. In contrast, Participant 24 had a NAP improvement index of only 33.3%, suggesting that most of the observed improvement was not clinically significant and could be within the margin of error of the PCL-S. Similarly, for participants 10 and 12 in the present study, NAP indices of 100% were obtained in both cases; however, the CSES recovery indices were, respectively, 0% and 100%. Thus, in the case of participant 10, all reductions in PCL-S scores relative to baseline that were reflected in the NAP index did not imply that the participant, at any point during treatment, reached a PCL-S score below 29 that might suggest they were closer to the functional population than the dysfunctional one or, in terms of Jacobson and Truax (1991), that might suggest any degree of recovery. In contrast, for participant 12, according to their CSES recovery index, all reductions in the PCL-S were clinically significant, as they suggested a degree of recovery. Therefore, the CSES indices (PND improvement, PEM improvement, NAP improvement, and CSES recovery) proposed by Sanz and García-Vera (2015) appear to provide complementary and useful information to that provided by the NES indices when analyzing the results of single-case designs. However, this information may not be as useful without evidence of its validity and, indeed, the results of the present study provide some of that evidence, although preliminary. First, in a sample of 30 patients receiving TF-CBT for the treatment of PTSD, representing therefore 30 single-case designs, the CSES indices showed significant and large correlations with the three NES indices established in the scientific literature: PND, PEM, and NAP indices. Second, in this same sample of patients or single-case designs, CSES indices showed significant and moderate to large correlations with two posttreatment therapeutic success or effectiveness criteria: PCL-S scores and the recovery criterion defined as a PCL-S score below 29. However, they did not show a significant correlation with a third posttreatment success criterion, the absence of a PTSD diagnosis, possibly due to a ceiling effect, as 86.7% of the patients no longer had a PTSD diagnosis at posttreatment. These two sets of results, therefore, support the convergent and criterion validity, respectively, of the CSES indices as a method for analyzing the results of single-case designs. The results of the present study also support the criterion validity of the three NES indices analyzed (PND, PEM, and NAP), as all three also showed significant and moderate to large correlations with the same two posttreatment therapeutic success or effectiveness criteria mentioned above. Moreover, the correlations with these two criteria were similar to those obtained by the CSES indices, so it cannot be claimed that CSES indices are more valid, in terms of posttreatment criterion validity, than NES indices. However, as previously argued, they provide additional information about the clinical significance of therapeutic changes in relevant psychological constructs observed in single-case designs. The results and conclusions of the present study should be interpreted with appropriate caution, given its limitations. For example, the use of dichotomous therapeutic success or effectiveness criteria for the analysis of criterion validity, such as the presence or absence of a PTSD diagnosis, instead of continuous criteria, may have reduced the statistical power of the study, especially considering that the sample of participants or single-case designs was relatively small. In addition, it would have been desirable to include other therapeutic success or effectiveness criteria not based on the same instrument, the PCL-S, which was used to collect the measurements during baseline and treatment. For example, criteria based on expert judgment derived from a visual analysis of the data or a clinical analysis of the results could have been included, as was the case in the validity study of the PND by Mastropieri and Scruggs (1985-1986). Another limitation of the present study relates to the ability to generalize its findings beyond the specific population studied, that is, victims of terrorism suffering from long-term PTSD. Therefore, future studies should examine the validity of the CSES indices with other clinical populations. Despite these limitations, the results of the present study provide preliminary support for the validity of the CSES indices for analyzing the results of single-case designs. However, given their novelty, further research is needed not only on the validity of these indices, but also on other aspects that could increase their usefulness. For instance, since the CSES indices are more stringent than the NES indices and in fact yielded lower values than the latter (see the means of the indices in Table 1), the standards proposed for interpreting the NES indices (Ma, 2006; Parker and Vannest, 2009; Scruggs and Mastropieri, 1998) would not be applicable to the CSES indices, and specific standards should therefore be developed for them. Given that NAP appears to outperform more traditional NES indices (Parker & Vannest, 2009; Parker et al., 2011), tentative values can be proposed for interpreting the CSES indices based on their correspondence with the conventional values proposed by Parker and Vannest (2009) for interpreting the NAP. These tentative values are displayed in Table 4 and were calculated using the regression equations that, based on the data from the present study, relate NAP to each of the CSES indices. The CSES ranges in Table 4 may be especially useful for clinicians who wish to implement the CSES indices in their routine practice. Clinicians can compare the indices obtained with patients with different psychological disorders to more objectively assess which disorders they obtain better and worse results for, and make therapeutic or professional decisions accordingly (e.g., modify their therapeutic approach to certain disorders, pursue continuing education programs for certain disorders). Clinicians can also compare the scores obtained with patients suffering from the same psychological disorder to more objectively identify which patients have had better and worse outcomes and, consequently, examine, for example, which factors may have facilitated or hindered the achievement of positive results. In all such comparisons, the tentative CSES values in Table 4 can facilitate the identification and evaluation of particularly successful cases.
Conflict of Interest The authors of this article declare no conflict of interest. Funding This study was possible thanks to the support of the Spanish Ministry of Science, Innovation, and Universities (Ref. PID2023-150340NB-I00) granted to the last author. Cite this article as: Navarro-McCarthy, A., Sanz, J., Gesteira, C., Cobos, B., Reguera, B., Morán, N., & García-Vera, M. P. (2025). Validation of clinically significant effect size indices in single-case designs. Clinical and Health, 36(3), 163-169. https://doi.org/10.5093/clh2025a19 References |
Cite this article as: Navarro-McCarthy, A., Sanz, J., Gesteira, C., Cobos, B., Reguera, B., Morán, N., & García-Vera, M. P. (2025). Validation of Clinically Significant Effect Size Indices in Single-case Designs. Clinical and Health, 36(3), 163 - 169. https://doi.org/10.5093/clh2025a19
Correspondence: ashleyna@ucm.es (A. Navarro-McCarthy).Copyright © 2026. Colegio Oficial de la Psicología de Madrid


 PDF
PDF e-PUB
e-PUB CrossRef
 JATS
JATS Print
Print Send
SendEMAIL ALERT
Clinical and Health is licensed under a Creative Commons Attribution-NonCommercial-NoDerivatives 4.0 International License