Resilience and Brain Injury: Validation of the Connor-Davidson Scale in Spanish Individuals
[La resiliencia y el daño cerebral: la validación de la escala de Connor-Davidson en población española]
Alba Aza1, 2, María Fernández1, 2, Antonio M. Amor1, 2, José L. Castillo1, 2, Miguel A. Verdugo1, and 2
1Institute for Community Inclusion (INICO), University of Salamanca, Spain; 2Department of Personality, Assessment, and Psychological Treatments. University of Salamanca, Spain
https://doi.org/10.5093/clh2025a5
Received 12 September 2024, Accepted 2 December 2024
Abstract
Background: Resilience, defined as the ability to maintain positive emotional experiences despite adverse events, is considered crucial in the rehabilitation post Acquired Brain Injury (ABI). This study aimed to validate the Connor-Davidson Resilience Scale (CD-RISC) in a Spanish sample with ABI. Method: A sample of 338 individuals receiving specialized ABI services in Spain participated in this study. Participants completed the CD-RISC, along with measures of depression, social support, and quality of life (QoL). Results: A confirmatory factor analysis revealed that the original five-factor model did not fully fit, prompting the exploration of alternative versions. A modified three-factor version and a 10-item unifactorial version showed a better fit. Resilience was positively correlated with higher QoL, social support, and satisfaction, and negatively with depression. Conclusions: This validation confirms that the Spanish version of the CD-RISC is a reliable tool for assessing resilience in individuals with ABI, highlighting its utility in clinical assessments and interventions.
Resumen
Antecedentes: La resiliencia es crucial en la rehabilitación tras el DCA, ya que implica la capacidad de mantener experiencias emocionales positivas a pesar de las dificultades. El objetivo de este estudio ha sido validar la Escala de Resiliencia de Connor-Davidson (CD-RISC) en una muestra española con daño cerebral adquirido (DCA). Método: Participaron 338 personas a las que se prestaba servicios especializados en España, quienes cumplimentaron la escala CD-RISC, junto con medidas de depresión, apoyo social y calidad de vida (CV). Resultados: El análisis factorial confirmatorio indica que el modelo original de cinco factores no se ajusta por completo, mientras que versiones alternativas, como la de tres factores y la unifactorial de 10 ítems, ofrecen un mejor ajuste. La resiliencia correlaciona positivamente con la satisfacción, el apoyo social y una mayor CV, y negativamente con la depresión. Conclusiones: Estos rersultados indican que la versión española del CD-RISC es una herramienta fiable para evaluar la resiliencia en personas con DCA, siendo útil en las intervenciones clínicas.
Palabras clave
Daño cerebral, CD-RISC, Análisis factorial, Calidad de vida, ResilienciaKeywords
Brain injury, CD-RISC, Factor analysis, Quality of life, ResilienceCite this article as: Aza, A., Fernández, M., Amor, A. M., Castillo, J. L., & Verdugo, M. A. (2025). Resilience and Brain Injury: Validation of the Connor-Davidson Scale in Spanish Individuals. Clinical and Health, 36(1), 37 - 45. https://doi.org/10.5093/clh2025a5
Correspondence: azhernandez@usal.es (A. Aza).Acquired brain injury (ABI) is a sudden injury in a previously healthy and developed brain, caused by different etiologies (i.e., trauma, stroke, brain tumor, anoxia, infection). These injuries, even in the mildest cases, are accompanied by long-lasting or permanent physical, cognitive, emotional, and social impairments that, in interaction with the everyday contexts and activities, can lead to ongoing disability experiences (Andelic et al., 2018; Howlett et al., 2022). Thus, this event is traumatic both for the people who suffer it and for their families, and may greatly compromise their quality of life (QoL) levels (Liu et al., 2019; Verdugo et al., 2021). Resilience refers to the personal ability that allows us, despite being exposed to losses or potentially traumatic events, to continue having positive emotional experiences and display only small or transitory disruptions in our ability to function (Bonanno, 2004). This perspective supports the growing use of the Social Ecological model to examine how ABI and other health issues affect people differently depending on their environments (Bannon et al., 2022; Saadi et al., 2021). The Social Ecological model illustrates how various individual, interpersonal, and systemic elements interact to influence physical and mental health over time (Partelow, 2018). Some qualities that have been associated with resilient people are patience, tolerance of negative affect and stress, optimism, and faith (Stewart & Yuen, 2011). In this sense, resilience can provide a buffer against this negative event and play a role in favorable rehabilitation outcomes, through better adherence and engagement in treatment recommendations (Bertisch et al., 2014). In fact, there are numerous studies that show that, among people with traumatic brain injury and other conditions like strokes, higher levels of resilience are associated with better neurobehavioral functioning (Merritt et al., 2022) and greater functional independence (Heltty & Zahalim, 2023). A positive relationship has also been shown between levels of resilience and emotional well-being (Lukow et al., 2015) or QoL (Rapport et al., 2019). It is not clear which factors correlate with resilience after ABI. Some studies have ruled out the influence of sociodemographic variables (Hanks et al., 2016), while others have found a relationship between higher levels of resilience and non-minority status, absence of preinjury substance abuse, or lower disability level (Marwitz et al., 2018). The influence of barriers (e.g., physical and cognitive challenges, stigma, and isolation) and facilitators (e.g., coping behaviors, access to resources, rehabilitation support) has also been highlighted (Bannon et al., 2022). There does seem to be greater consensus on the negative relationship between resilience and variables such as depression (Zhou et al., 2020), as well as a positive relationship between resilience and perceived social support (Huang et al., 2020). Given the importance of resilience in the rehabilitation and overall wellbeing of individuals with ABI, it is essential to explore how resilience levels can change over time and through various interventions. While some studies indicate that resilience levels remain stable throughout the period following an ABI (Marwitz et al., 2018), other successful interventions have been carried out to improve resilience levels (Hines et al., 2023; Terrill et al., 2023), either individually or with interventions that include the whole family. To benefit from all the potential positive effects of resilience in the post ABI recovery process, it is necessary to have adequate assessment instruments. Several scales are currently available for assessing resilience, such as the Resilience Scale (Wagnild & Young, 1993) and the Brief Resilience Scale (Norvang et al., 2022). However, the Connor-Davidson Resilience Scale (Connor & Davidson, 2003) has been the most widely used and validated instrument in different countries and populations (Anjos et al., 2019; Baek et al., 2010; López-Fernández et al., 2024; Velickovic et al., 2020). It consists of 25 items which measure several important aspects of resilience: sense of personal competence, tolerance for negative emotions, positive acceptance of change, confidence in one’s own instincts, religious beliefs, and an orientation focus towards approaching problems (Campbell-Sills et al., 2006). Despite the extensive use of the Connor-Davidson Scale and the adequate psychometric properties of the scores obtained using this instrument (see, e.g., Anjos et al., 2019; López-Fernández et al., 2024) important discrepancies have been found in the analyses of its factorial structure. Thus, the five-factor model (Connor & Davidson, 2003) proposed by the original authors has not been replicated in other samples, and for this reason, different versions of the scale have emerged, eliminating those items that were more conflicting. Examples of this are Manzano-García and Ayala-Calvo's (2013) 23-item version, in which items 3 and 9 were eliminated, or the 21-item version by Crespo et al. (2014) in which items 18 and 20 were eliminated in addition to the previous items. Even shorter versions have also emerged, such as the 10-item version, with very good psychometric properties of the scores obtained using the instrument (Campbell-Sills et al., 2007). Many of the aforementioned adaptations have been carried out with Spanish samples. In addition, the Connor-Davidson scale has been used with individuals with ABI. However, despite being a population with particular characteristics, there are no specific validation analyses available. Thus, the objectives of the present investigation were: 1) to validate the Connor-Davidson Resilience Scale (CD-RISC) in a Spanish sample of individuals with ABI and 2) to analyze the psychometric properties of the different versions of the CD-RISC to determine which model shows a better fit. Participants The study included 338 individuals with ABI who received specialized services and support at 26 centers and organizations throughout Spain. The inclusion criteria were: (a) having experienced ABI; (b) is 16 years or older; (c) being currently receiving services at a specific center for individuals with ABI; and (d) having signed an informed consent form. The exclusion criteria were: (a) being in a state of coma or minimal consciousness; (b) suffering from global aphasia; and (c) not to being able to understand or answer most questions. More than half of the sample was male (61.9%), with ages ranging between 18 and 91 years. It is worth noting the low percentage of subjects who returned to work or study after injury (3%). Regarding to the aetiology of the injury, the most prevalent was stroke (62.6%), followed by traumatic brain injury (23.1%). Table 1 shows the clinical and sociodemographic characteristics of the participants. Table 1 Characteristics of Participants' Social and Clinical Data (N = 338). 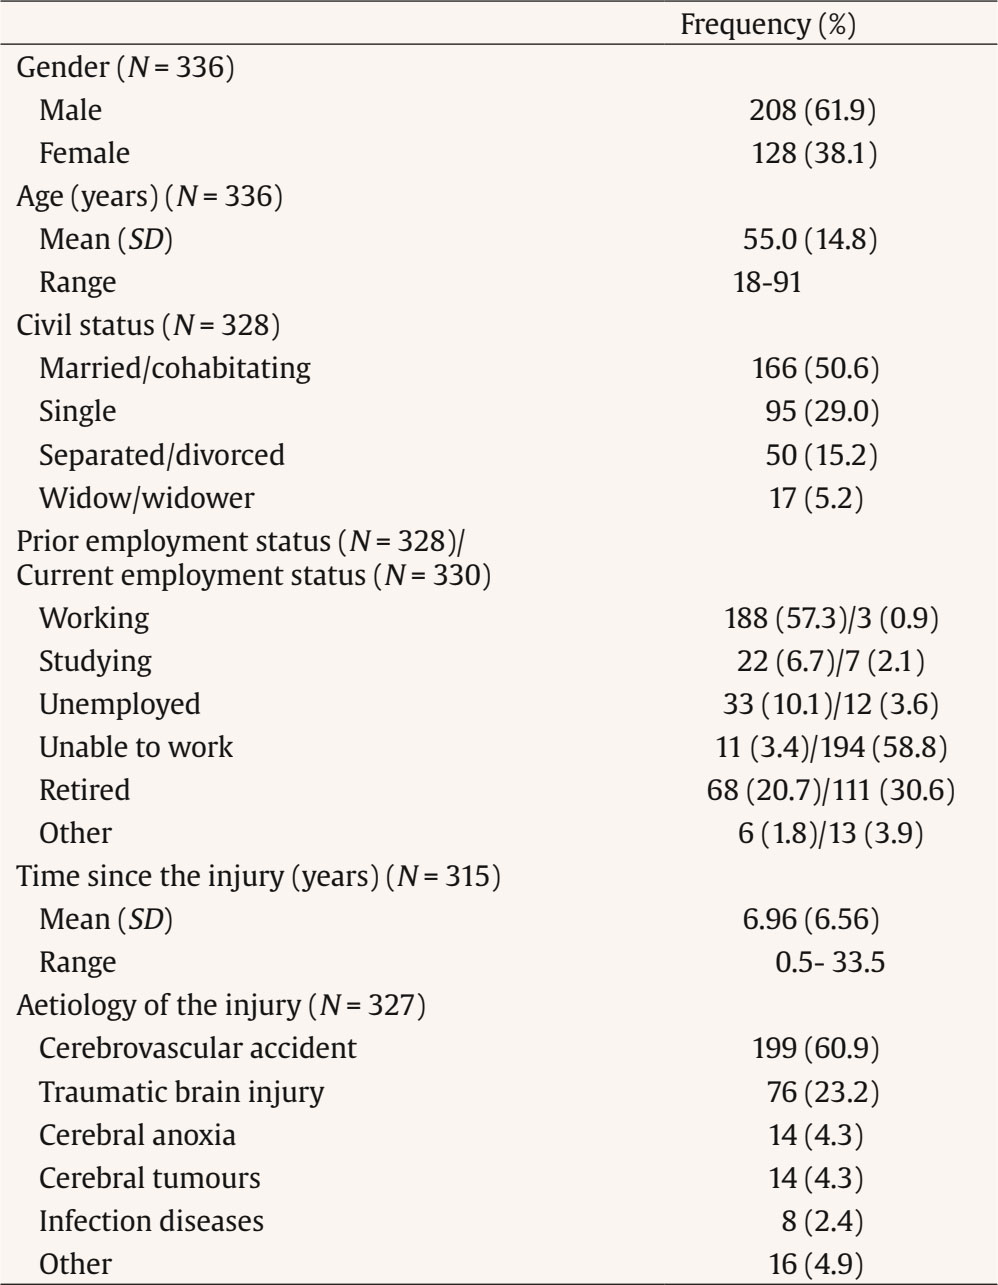 Instruments The Connor-Davidson Resilience Scale (CD-RISC; Connor & Davidson, 2003 It is a self-report scale composed of 25 items with a Likert-type response format ranging from 0 (not true at all) to 4 (true nearly all the time). Scores range from 0 to 100, with higher scores indicating higher levels of resilience. There is no agreement on the factor structure of the scale, so the main models were collected. Five-factor 25-item Model (Connor & Davidson, 2003). In the original validation, the existence of 5 first-order factors was considered: Factor 1 (items 10-12, 16, 17, 23-25) reflects the notion of personal competence, high standards, and tenacity; Factor 2 (items 6, 7, 14, 15, 18-20) corresponds to trust in one’s own instincts, tolerance of negative affect, and strengthening effects of stress; Factor 3 (items 1, 2, 4, 5, and 8) relates to the positive acceptance of change, and secure relationship; Factor 4 (items 13, 21, and 22) related to control; and Factor 5 (item 3 and 9) is linked to spiritual influences. Good psychometric properties were found in the original study (Cronbach’s alpha = .89; intraclass correlation coefficient = .87), but the reliability of the factors was not reported. Three-factor 23-item Model (Manzano-García & Ayala Calvo, 2013). Manzano-García and Ayala-Calvo (2013) verified a three-factor 23-item model in two Spanish subsamples. The factors were labelled by the authors as: Hardiness (9 items: 4, 12, 14-18, 23, and 24; composite reliability = .88), Resourcefulness (7 items: 1, 2, 5, 11, 13, 22, 25; composite reliability = .87), and Optimism (7 items: 6-8, 10, 19-21; composite reliability = .81). Items 3 and 9 failed to load higher than .30 on any factor and were therefore dropped. These two items correspond to the original factor 5 (Spiritual Influences). The rest of the items presented adequate psychometric quality in relation to the factor to which they belong. Moreover, all the factors were reliable with internal consistency values above .80. Four-factor 21-item Model (Crespo et al., 2014). In another study carried out with a Spanish sample, Crespo et al. (2014) eliminated four items from the original scale (i.e., items 3, 9, 18, and 20) that negatively affected its reliability. Thus, the reduced version of 21 items showed high reliability (Cronbach’s alpha = .90). The exploratory factor analysis yielded four factors (55.31% variance explained): coping and persistence in stress situations (items 1, 4, 12, 14-17, and 19); strengthening effect of stress and orientation to targets (items 8, 10, 11, 24, and 25); positive appraisal (items 5-7, 13, 22, and 23); and confidence (items 2 and 21). The first three factors showed adequate reliability (Cronbach’s alpha = .75-.86); not so the fourth (Cronbach’s alpha = .35). One-factor 10-item Model (CD-RISC-10; Campbell-Sills et al., 2007). After some modifications, Campbell-Sills and Stein (2007) reported a 10-item 1-factor model with good psychometric properties (composite reliability = .85). The CD-RISC-10 is comprised of item 1 (“I am able to adapt to change”); item 4 (“I can deal with whatever comes my way”); item 6 (“I see the humorous side of things”); item 7 (“Coping with stress can strengthen me”); item 8 (“I tend to bounce back after a hardship or illness”); item 11 (“I can achieve my goals”); item 14 (“Under pressure, I focus and think clearly”); item 16 (“I am not easily discouraged by failure”); item 17 (“I think of myself as a strong person”); and item 19 (“I can handle unpleasant feelings”). This short form has been validated in different cultures and populations (Dolores Serrano-Parra et al., 2013; Wang et al., 2010) with good internal consistency (Cronbach’s alpha = .91) and test–retest reliability (r = .90 for a two-week interval). Patient Health Questionnaire (PHQ-9; Kroenke et al., 2001) It consists of 9 items and assesses depression in accordance with the Diagnostic and Statistical Manual of Mental Disorders, Fifth Edition (DSM-5) criteria (Spitzer et al., 2014). Total scores range from 0 to 27, with higher scores indicating more severe depression. The PHQ-9 has been used and validated with individuals with ABI, demostrating good psychometric properties in the scores obtained from individuals with ABI (Fann et al., 2005) and within Spanish samples (Diez-Quevedo et al., 2001). Social Support Questionnaire-6 (SSQ6; Sarason et al., 1987) This instrument is an abbreviated version of the original Social Support Questionnaire (Sarason et al., 1983). Individuals are required to respond to 6 items by (a) indicating the number of individuals who are available to provide them with support across six areas and (b) rating their level of social support satisfaction. SSQ6 has been used with individuals with ABI and good psychometric properties have generally been found in this population (Izaute et al., 2008). Social support and social support satisfaction scores range from 0 (no social support) to 6 (very high social support), and from 1 (very unsatisfied) to 6 (very satisfied), respectively. CAVIDACE Scale Self-report Version (Verdugo et al., 2020) The self-report version of the CAVIDACE scale is an adaptation of the original scale to measure QoL in individuals with ABI (Verdugo et al., 2018). It consists of 40 items that assess the eight domains of Schalock and Verdugo’s QoL model (i.e., emotional well-being, physical well-being, material well-being, self-determination, interpersonal relationships, social inclusion, personal development, and rights), using a four-point frequency rating scale: 0 = never, 1 = sometimes, 2 = frequently, and 3 = always. For its correction, direct scores obtained in each of the eight domains are transformed into standard scores and a composite standard score, where higher scores indicate better QoL. This overall score may be transformed into a QoL index (M = 100, SD = 15). The psychometric properties obtained in the original validation study were good: QoL is composed of eight first-order intercorrelated domains (CFI = .891, RMSEA = .050, TLI = .881), and the internal consistency was adequate in seven of the eight domains (ω = .66.-.87) (Aza et al., 2020). Procedure A cross-sectional study was conducted in a sample of adults who had suffered an ABI. Participants were recruited following a non-probabilistic convenience sampling process. Firstly, participating organizations providing services to ABI population were primarily recruited through emails and telephone calls by the research team. On several occasions, these professionals connected the research team with other centers, leading to a snowball sampling effect. Of the 32 centers with which the research team initially established contact, 26 ultimately consented to participate in the study. Once a center expressed interest in participating in the study, a research team member visited it and provided them with all the necessary information. At each center, a research assistant was trained to supervise the administration of the instruments. Subsequently, the research assistants contacted individuals with ABI to inform them about the study, obtain their informed consent, and send them the scales that they were required to complete. Participants were required to meet the established inclusion criteria in order to be considered for participation in the study. In instances where the number of eligible participants exceeded the center’s capacity to effectively oversee the process, the research assistant was responsible for randomly selecting the participants. Furthermore, the research assistant was entrusted with evaluating the capacity of individuals with ABI to complete the instruments. Respondents also had the option to complete the questionnaires online. As for the online questionnaires, all data were stored in the servers of the Institute for Community Inclusion, complying with the highest security standards provided by the University of Salamanca. Data Analysis Descriptive statistics of the CD-RISC were obtained at the item level, including mean, standard deviation, percentage of item endorsement, skewness, and kurtosis coefficients, as well as corrected item-total correlations. The acceptable values of skewness and kurtosis are those within the range [–1, + 1] (Ferrando & Anguiano-Carrasco, 2010). The dimensionality of the CD-RISC was assessed through Confirmatory Factor Analysis (CFA). The Weighted Least Squares Means and Variance adjusted (WLSMV) was used, which is suitable for ordinal items. The goodness of fit was assessed utilizing the Comparative Fit Index (CFI) and the TuckerLewis Index (TLI) (values ≥ .90/95 indicating acceptabletoexcellent model fit), while values of the root mean square error of approximation (RMSEA) of ≤ .07 and the standardized root mean square residual (SRMR) of ≤ .05 also suggest a good model fit (Brown, 2015; Hu & Bentler, 1999). Furthermore, the internal consistency of these scales was examined using Cronbach’s alpha (α) and McDonald’s omega (ω) coefficients. A minimum alpha value of .70, as recommended by Nunnally and Berstein (1994), served as the threshold for a reliable measure. Convergent validity evidence based on the relationships between the CD-RISC and other measures (i.e., depression, social support, and quality of life) was calculated using Pearson correlations. The Pearson’s correlation coefficients were interpreted according to Cohen’s criteria (1988): weak (0.10), moderate (0.30), and strong (0.50). All statistical analyses were performed using the statistical software Jamovi version 2.3.21. (The jamovi project, 2020) and the R statistical console version 4.3.1 (R Core Team, 2012). Item-level Descriptive Statistics Table 2 summarizes the distribution of the CD-RISC item scores. All items covered the fullscale range (i.e., 0-4). Most items had acceptable normality values (skewness and kurtosis between ± 1), even though the items have a moderate negative asymmetry. Of particular note, item 2 (“Close and secure relationships”), item 10 (“Best effort no matter what”), item 13 (“Know where to turn for help”), and item 25 (“Pride in your achievements”) concentrated the largest percentage of responses at option 4 (true nearly all of the time), showing a ceiling effect for those items. All corrected item-total correlations were high for the complete version of the CD-RISC, except for items 3 and 20. Table 2 Item-level Descriptive Statistic of the CD-RISC 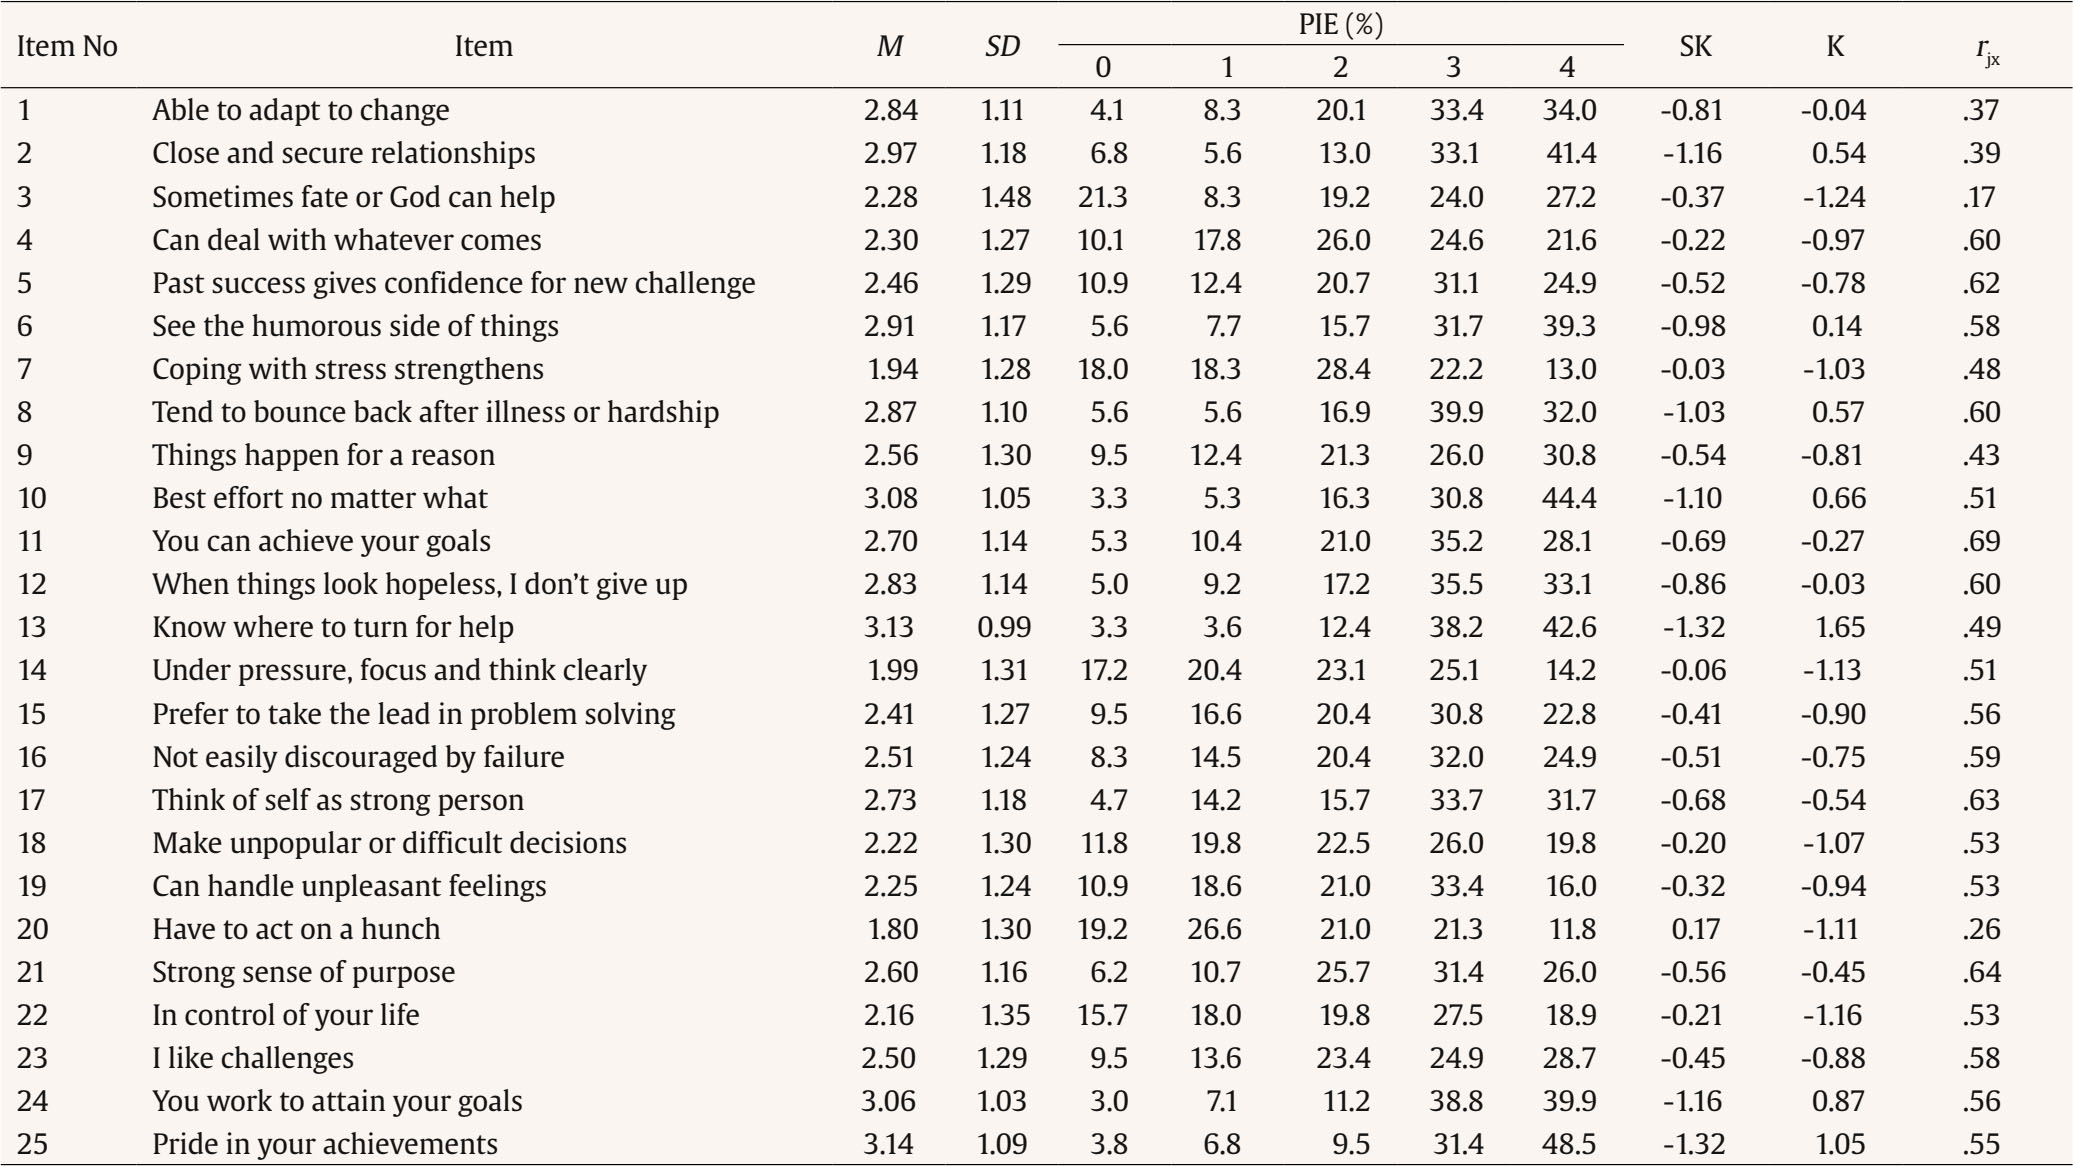 Note. I = item; M = mean; SD = standard deviation. PIE (%) = percentage of item endorsement; each statement is rated on a 5-point Likert-type scale. SK = skewness; K = kurtosis. rjx = corrected item-total correlation for 25-item CD-RISC. Factor Structure In the original 25-item scale, similar adjustment values were found in both the Five-factor model (Model B) and the unidimensional one (Model A). Table 3 shows the different models tested with CFA (ordered in order of most to least number of items). Regarding the reduced versions of 21 (Model D) and 23 items (Model C), slightly better data fit values were obtained than in the complete scale, especially in the 21-item (dropping items 3, 9, 18, and 20). However, since the original authors of Model D (Crespo et al., 2014) had reported problems with factor 4, composed of items 2 and 21, it was decided to remove item 2 (because of its low factor loadings) and to regroup item 21 in factor 1 (because of its high factor ratio). In this way, a modified alternative model of 20 items (Model E) and three factors was configured, which turned out to have good to excellent fit to the data and fit indices (CFI = .905, TLI = .892, RMSEA = .054, SRMR = .050). Finally, the model with 10 items (Model F) and a single factor also showed excellent fit to the data (χ² = 798.40, df = 235, p < 0.001) and fit indices (CFI = .953, TLI = .939, RMSEA = .062, SRMR = .039). Figure 1 shows the path diagram of the Three-factor model of the CD-RISC (20 items) and Figure 2 shows the path diagram for the 10-items version of the CD-RISC. All items’ loadings were high and statistically significant for both versions, with values ranging from .51 to .87 in the 20-item version, and from .64 to .85 in the shorter 10-item version. In the first one, the association between these latent factors ranged between .86 and .96. Table 3 Model Fit Indices for the CD-RISC 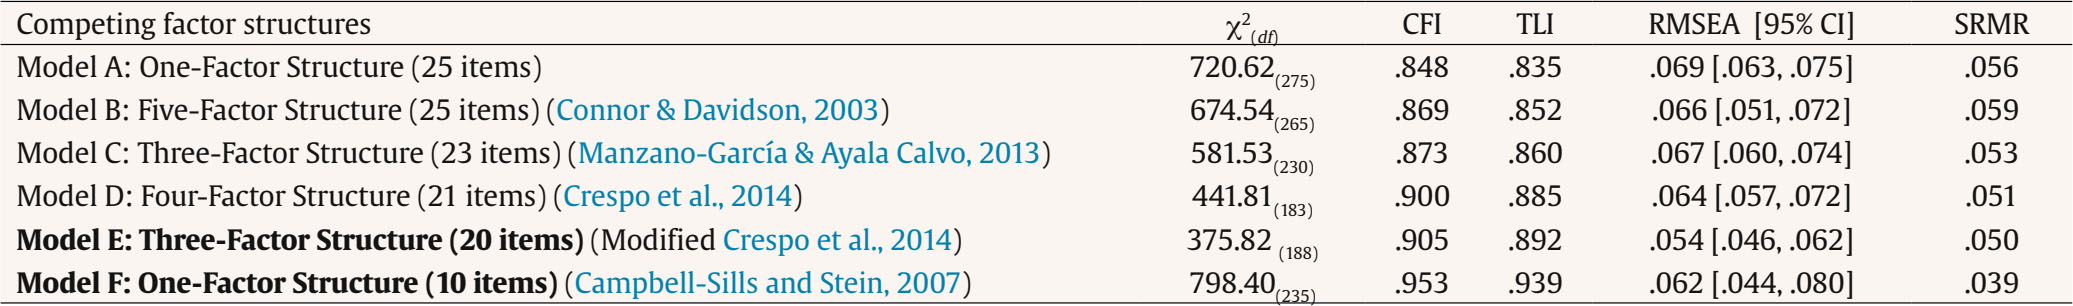 Note. χ2 = chi-square test of model fit; df = degrees of freedom; CFI = comparative fit index; TLI = Tucker-Lewis' index; RMSEA = root mean square error of approximation; CI = confidence interval; SRMR = standardized root means square residual. The CD-RISC models displaying better model fit is in bold. Internal Consistency The Cronbach’s alpha (α) and McDonald’s omega (ω) coefficients suggested that scores provided by CD-RISC are internally consistent, both in its short version and in the Three-factor version. The lowest values are observed in the subdimension of positive appraisal, but these are still acceptable (α/ω = .76). Table 4 displays the descriptive statistics of these measures (i.e., mean, standard deviation, skewness, and kurtosis values) and their internal consistency coefficients. Table 4 Descriptive statistics, internal consistency coefficients, and correlations of the CD-RISC with depression, social support, and QoL. 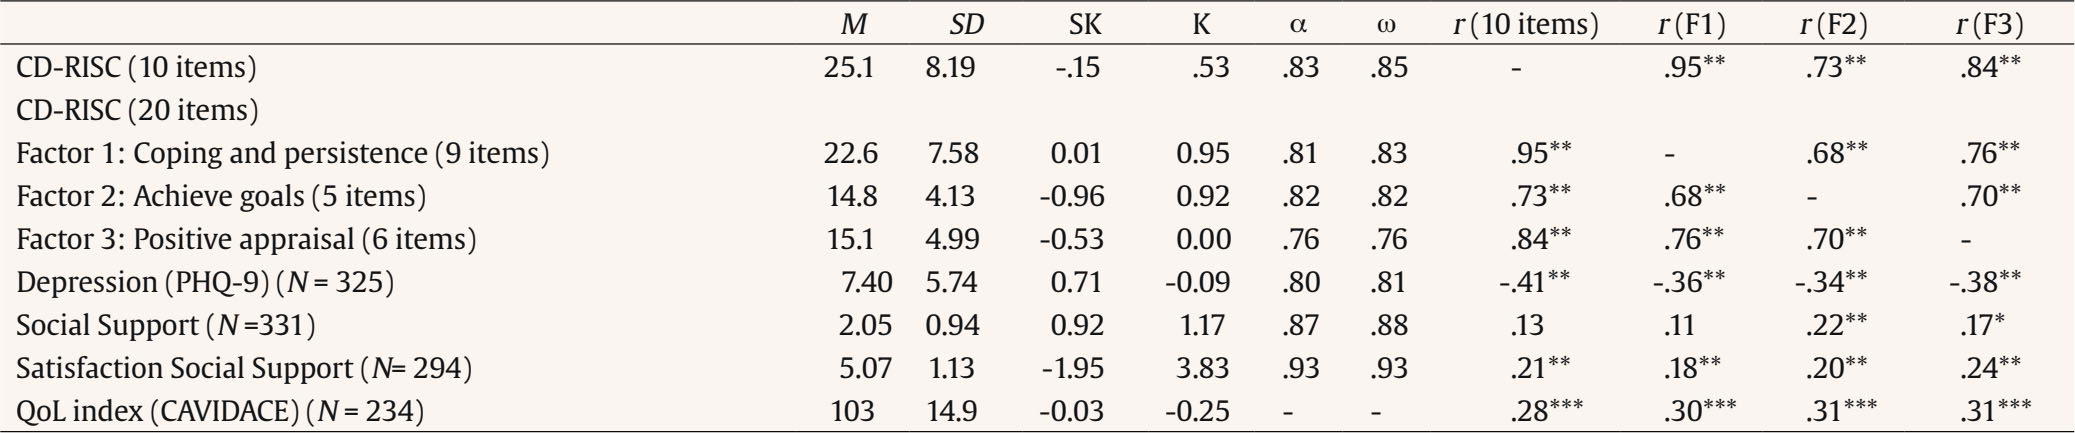 Note. M = Mean; SD = standard deviation; SK = skewness; K = kurtosis; α = Cronbach’s alpha; ω = McDonalds’ omega; r = Pearson correlation. *p < .05, **p < .01 , ***p < .001 (two-tailed). Convergent Validity The total scores for the CD-RISC showed moderate positive associations with QoL levels. Additionally, moderate negative correlations with depression levels were found in both the short version of the CD-RISC and the three-factor model. Interestingly, these correlations were higher when resilience is considered from a unifactorial model. In relation to social support, weak positive correlations were observed between satisfaction with social support and CD-RISC, with the correlation being considerably weaker, and sometimes non-significant, in the case of the number of social supports. An exception is the significant correlation between the achieve goals domain and the number of social supports (r = .22). Finally, considering the value of the correlations between the CD-RISC 10-item scale and the three-factor model, it was observed that the coping and persistence domain was the most equivalent to this short version of the scale, while it was further away from the domain of achieving goals (r = .95 and .73, respectively). Table 4 shows the correlations between the two versions of the CD-RISC (10 and 20 items) and its domains with depression, social support, and QoL, together with the descriptive statistics of these measures and their coefficients of internal consistency. Figure 1 Path diagram of the Three-factor model of the CD-RISC. 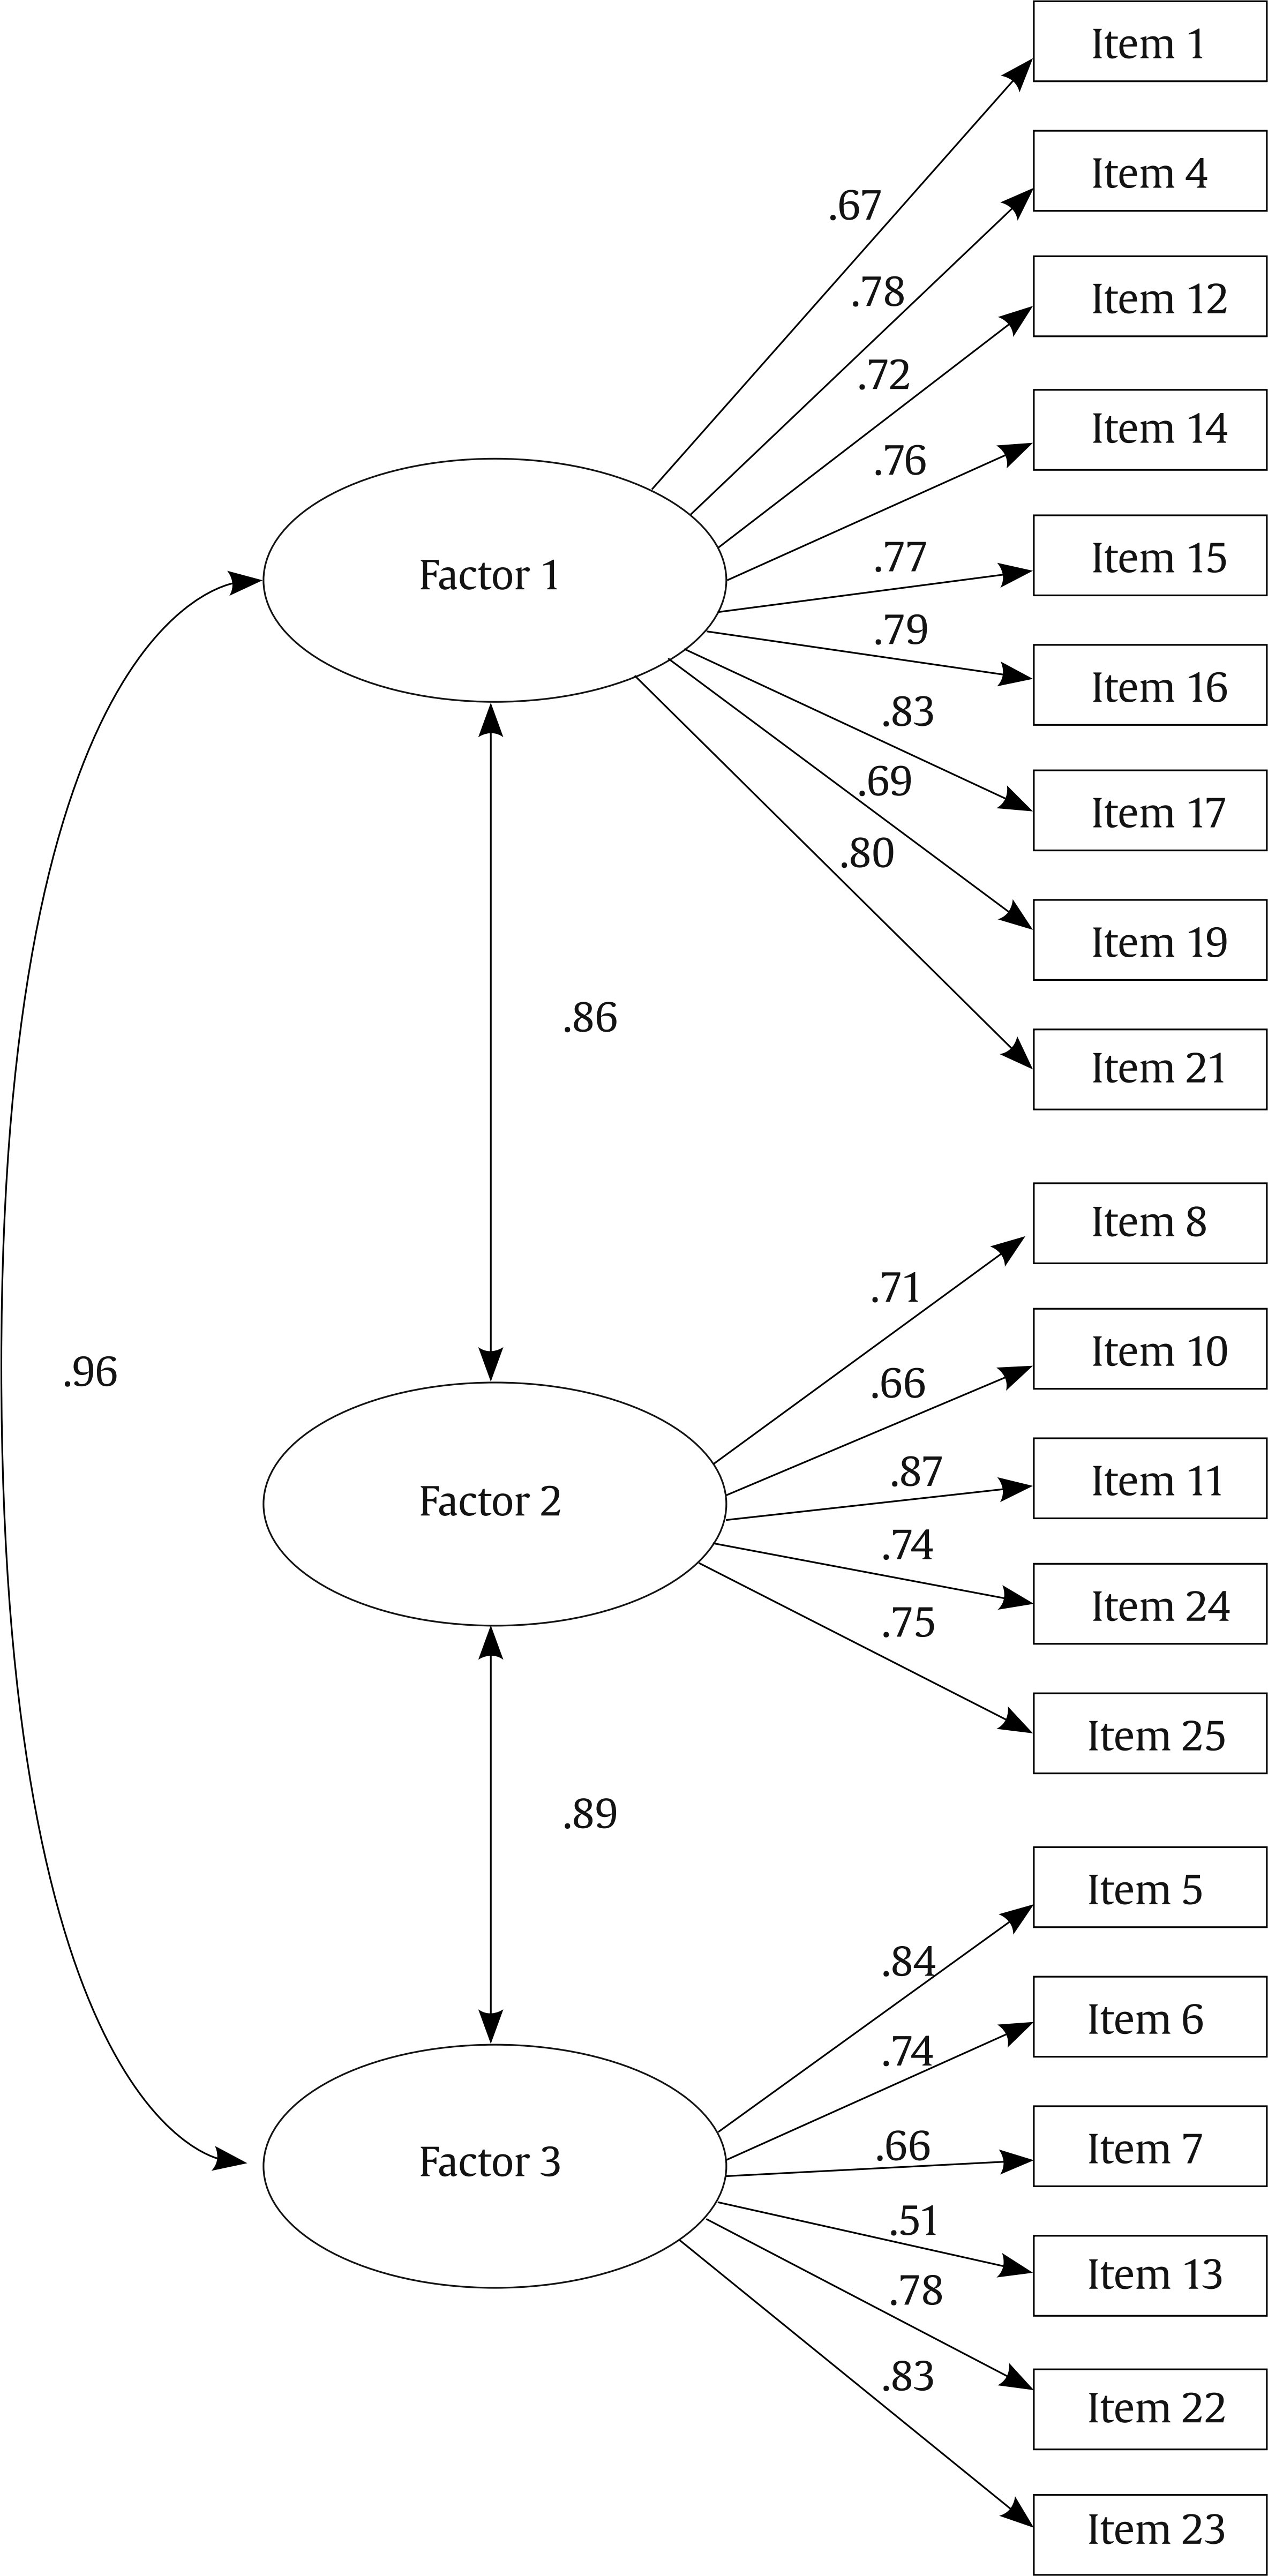 Note. Factor 1: Coping and persistence; Factor 2: Ability to overcome and achieve objectives; Factor 3: Positive appraisal. This study provides evidence on the psychometric validation of the Connor-Davidson Resilience scale (CD-RISC) among Spanish adults who have suffered an ABI. Validating a resilience scale in a sample of individuals with ABI is particularly relevant given the unique challenges this population faces in cognitive, emotional, physical, and social recovery. Resilience plays a critical role in how individuals with ABI adapt to these challenges, significantly influencing their psychological well-being and rehabilitation outcomes. Moreover, the findings of this study may differ from those observed in other populations due to the distinctive nature of ABI-related challenges, such as the effects of cognitive deficits, emotional dysregulation, and social isolation. Figure 2 Path diagram of the 10-item version of the CD-RISC. 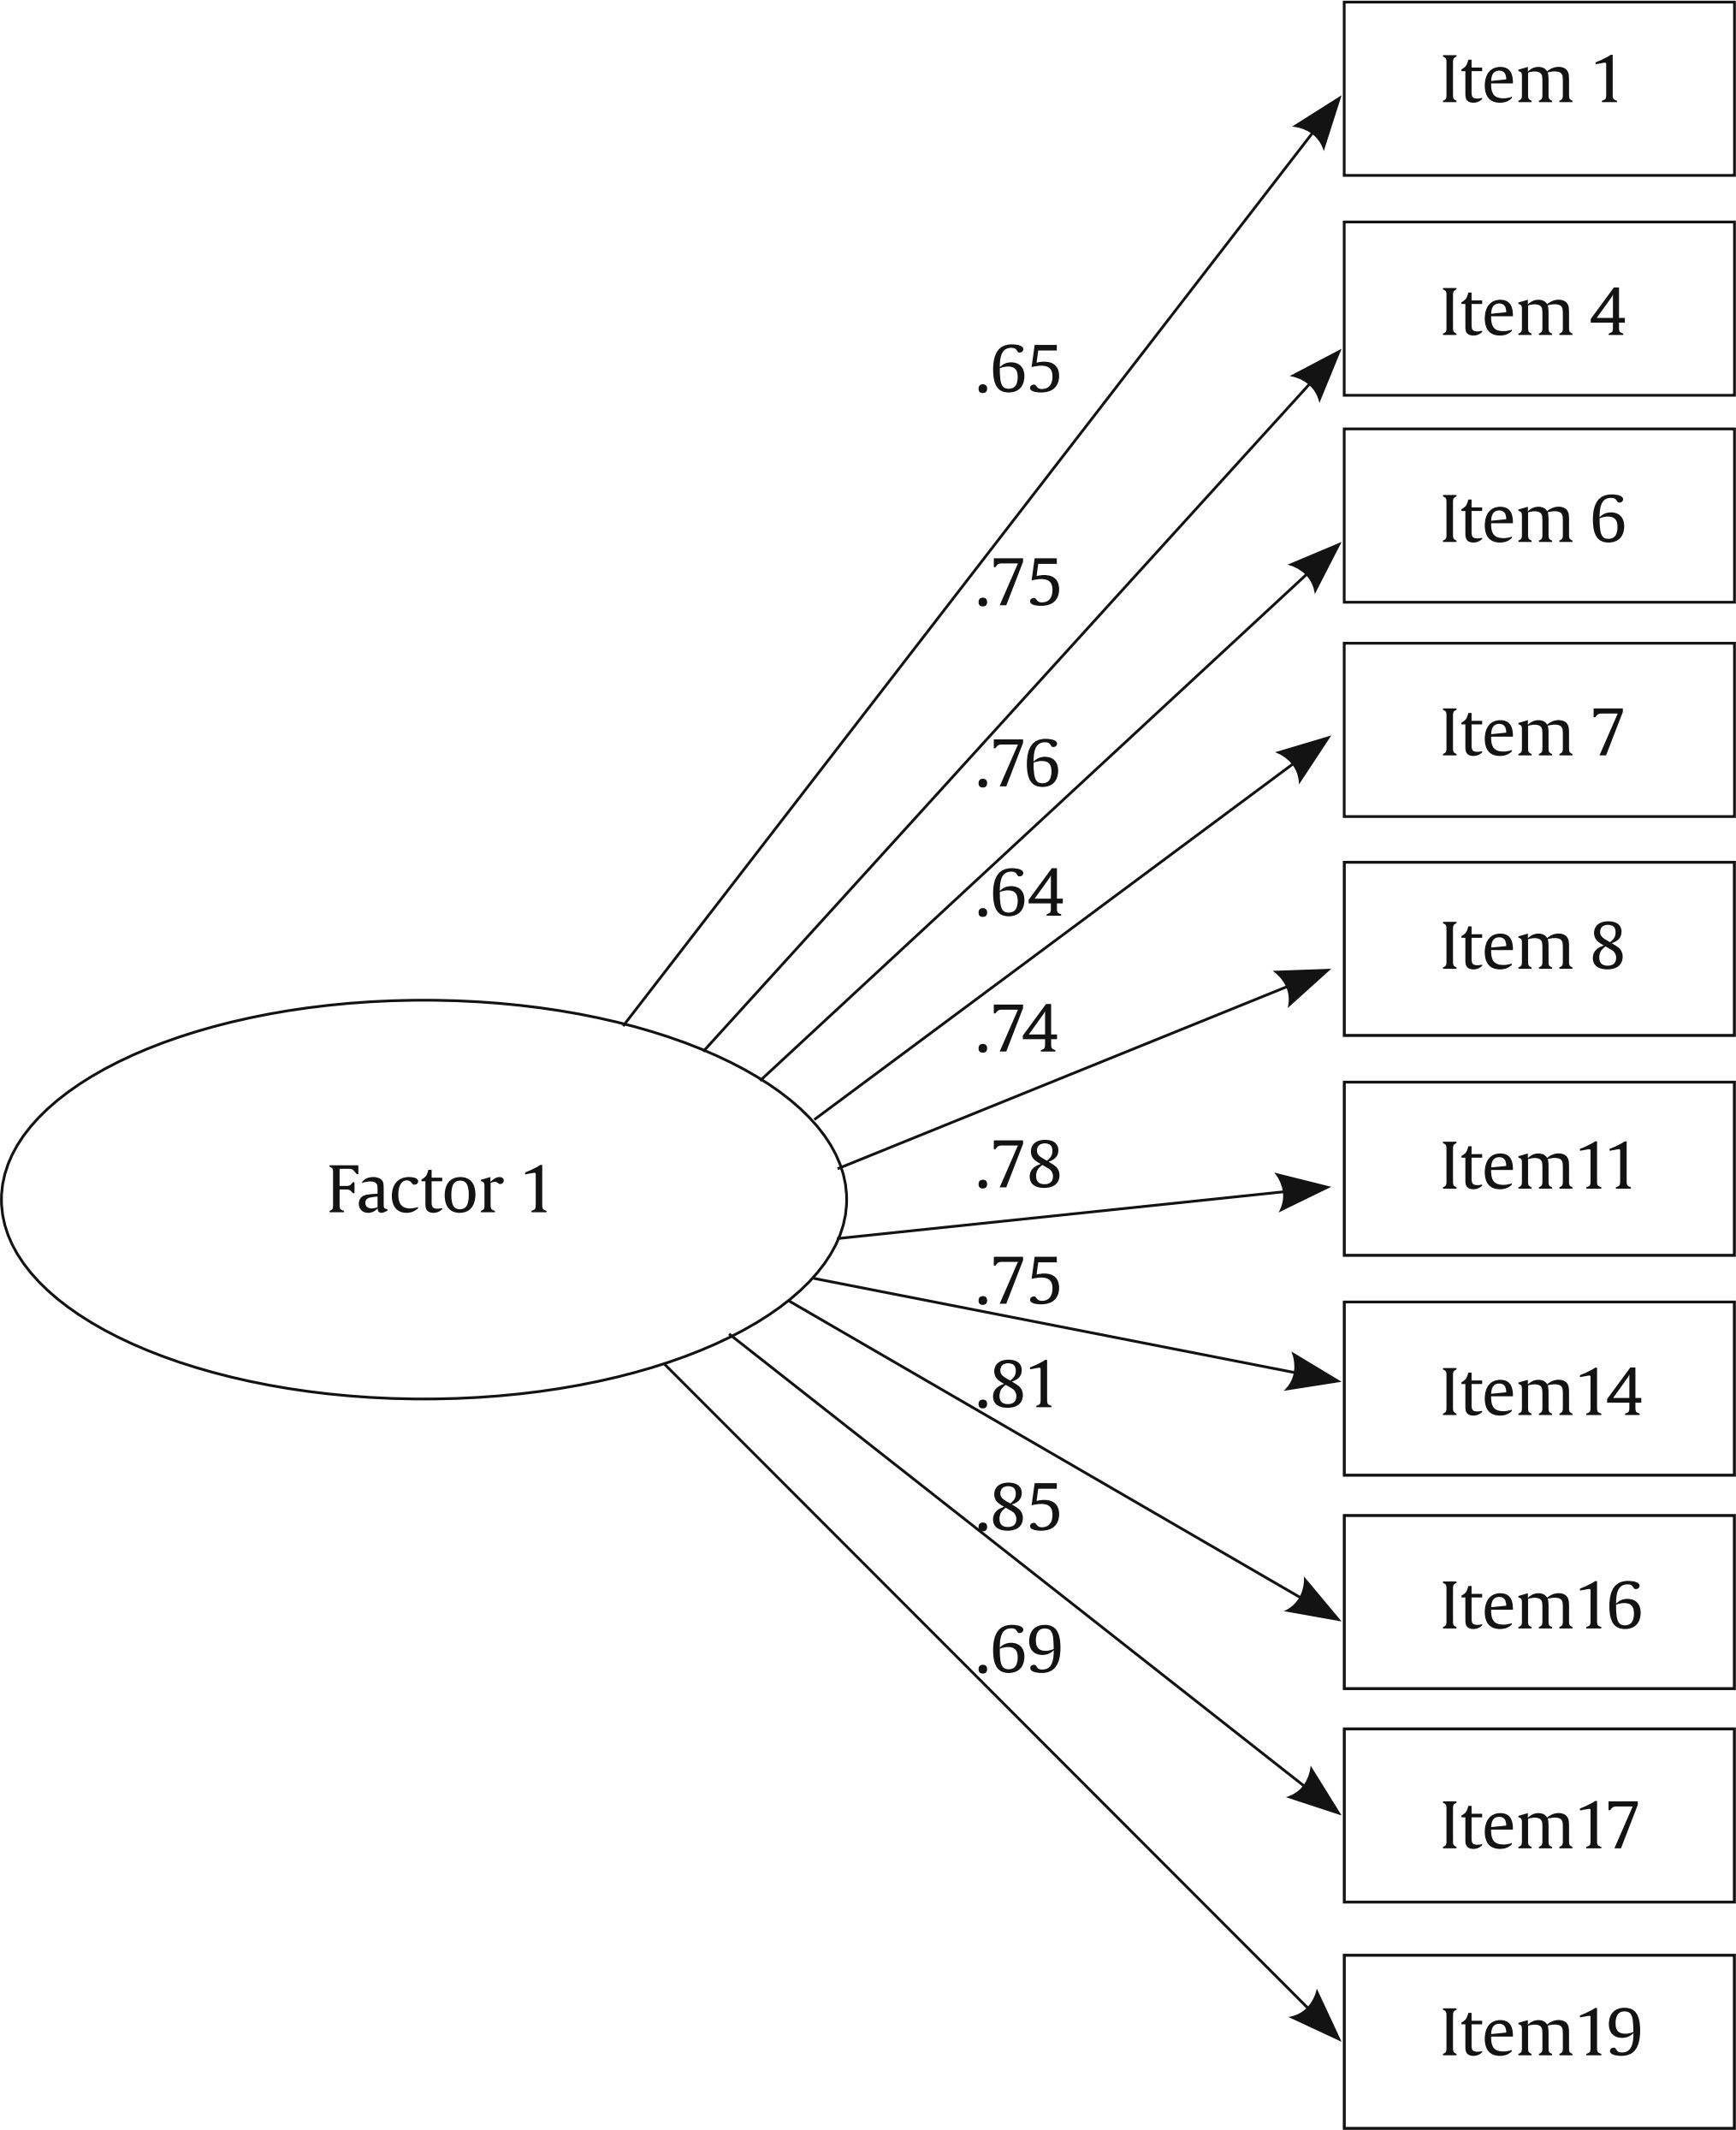 The CD-RISC is a promising instrument for assessing resilience in this population. Two major findings emerged. First, analysis of competing models indicated that the one-factor structure (10 items) (Campbell-Sills and Stein, 2007) and a three-factor structure (20 items) with coping and persistence, ability to excel and achieve goals, and positive appraisal as factors (modified version by Crespo et al., 2014), outperformed other internal representations (i.e., the original five-factor model with 25 items) in accounting for participants’ responses to the CD-RISC. Second, resilience scores were meaningfully correlated with depression and social support outcomes and broad QoL domains. Our analysis showed that the version proposed by Crespo et al. (2014), with a slight modification, yielded the best model fit in samples of the Spanish adult population with ABI. This model had convincing item-factor loadings in the three factors (λ ≥ .51), and the magnitude of the association between its factors (.68, .70, and .76) suggested a strong connection between them without rendering the distinction redundant. The modifications introduced addressed the reliability problems found by the authors in the last of their proposed factors, referring to the feeling of trust and meaning (with respect to others and one’s own life). This factor contained only two items of which, one of them (item 2 “Close and secure relationships”) was removed because of its poor reliability (i.e., a correlation of less than .40 with the total score). At the same time, item 21 (“Strong sense of purpose”) was regrouped into the first factor, due to its high factor load with it. Although the three-factor distribution may seem the best solution to the problem, it has been shown that the three-factor structure proposed by Manzano-García & Ayala Calvo (2013) does not fit the data well. Also, other studies (Yu & Zhang, 2007) showed good results with Three-factor models but without reaching a consensus on the items that should be included in each dimension. In line with Crespo et al. (2014), this research identified a first factor (Factor 1) related to coping and persistence, which appears to be closely related to the concept of hardiness. On the other hand, Factor 2 refers to the person’s ability to overcome and achieve goals and shares similarities with the Resourcefulness factor proposed by Manzano-García & Ayala Calvo (2013). Finally, a final factor (Factor 3) called optimism or positive assessment is included, understood as the belief that the person has about the success of their available coping resources, and that is common to both three-factor versions revised (Manzano-García & Ayala Calvo, 2013; Yu & Zhang, 2007). Factor 1 consistently contains the greatest number of items, specifically nine in the present research, and shows a much higher correlation with the reduced 10-item version (Campbell-Sills and Stein, 2007) compared to the other domains. This suggests that hardiness is a central component of the scale, encompassing one’s own instincts and strategies that facilitate resilience under stress, such as commitment, control, and challenge (Maddi, 2013). Another issue on which there seems to be agreement is that some items from the original version (Connor & Davidson, 2003) do not work well and should be removed from the scale. In fact, the elimination of some items that did not work properly, such as item 3 (“Sometimes fate or God can help”) and item 9 (“Things happen for a reason”), is not enough, and it is necessary to remove additional items such as item 18 (“Make unpopular or difficult decisions”) and item 20 (“Have to act on a hunch”) (as was done in the 21-item version). Item-total scale correlation analyses showed that items 3 and 20 had values below .30. In the case of items 3 and 9, they referred to concepts of spirituality, and although they have been shown to be important for many people, they may not be considered cross-cultural elements of the resilient personality. While a reduction in the original five-factor multidimensionality is confirmed, shorter versions of the scale has also emerged that advocate a one-dimensional structure, such as Campbell-Sills et al.'s (2007) 10-item version, which has shown an excellent model fit in this sample of the Spanish adult population with ABI. As mentioned above, there seems to be a clear correspondence between this version of the scale and the factor relating to coping and persistence. Therefore, it seems that the multidimensionality of the resilience construct is confirmed, highlighting the centrality of this factor. However, further research is needed to clarify the exact components of resilience. Another psychometric contribution of this study is the high internal consistency of the scale in the three domains included (similar to those reported by Crespo et al., 2014) and in the 10-item version of the CD-RISC. Furthermore, the Achieve Goals factor demonstrated reliable score consistency, which is particularly noteworthy given its construct breadth and length (five items). However, as noted above, the α and ω coefficients for the Positive Appraisal factor were lower, though they did not fall below the acceptable cut-offs for reliability indices (.70). Consistent with previous studies, our findings support that resilience is related to more positive wellbeing-related indicators (Huang et al., 2020; Lukow et al., 2015; Rapport et al., 2019; Zhou et al., 2020). Individuals who scored higher on the CD-RISC tended to describe QoL levels as higher. Although these associations have been studied using a total resilience score in other populations (Lee et al., 2017; Macía et al., 2020), this study demonstrates that scores on three factors proposed were meaningfully and positively correlated with QoL levels. Concerning the relationship between resilience and social support, it was found, as it had already been shown in other studies (Crespo et al., 2014), that the relationship with the satisfaction shown by the person is higher than with the number of social supports available to the person, giving greater importance to the subjective component than to the objective one of the concept. Within satisfaction with social support, a closer relationship was found with the optimism factor. This is possibly due to the fact that factors related to coping and overcoming stressful situations would be more linked to personal mechanisms of resilience (i.e., self-efficacy, self-esteem, use of coping strategies), while optimism is associated with more interpersonal mechanisms (Friborg et al., 2006). Finally, the widely demonstrated protective effect of high resilience, shown through significantly lower levels of depression, was confirmed (Southwick et al., 2005). Moreover, this effect was similar across the three factors studied, underscoring the importance of each in contributing to an individual’s well-being. Limitations and Future Research This study has some limitations that need to be considered. First, it is important to acknowledge that the sample was selected using a snowball method. This procedure is effective for obtaining population samples for validation studies; however, its non-probabilistic nature poses challenges for generalizing findings to the broader population. Nonetheless, the large and heterogeneous sample used mitigates concerns regarding representativeness. Future studies may consider the use of stratified sampling to enhance sample diversity. Second, the results rely on patients’ self-report data. This raises concept especially regarding communication problems arising from ABI and high levels of self-awareness. In this regard, it would be helpful to explore alternative methods of data collection, such as scale adaptations using a response format with visual aid systems. Finally, although this research was framed within a longitudinal study Verdugo et al. (2021), it was not possible to analyze the temporal stability values of the scale, since the evaluations were separated by at least 12 months, and this was an excessive time to psychometrically evaluate the properties of this concept. Despite these limitations, the results are promising and carry important implications for both theory and practice. This study provides evidence of the psychometric properties and factor structure of the Spanish version of the CD-RISC in adult population with ABI, demonstrating that it is a reliable tool for assessing resilience levels in adults with ABI. Since resilience is crucial for people coping with the numerous sequelae following an ABI, having a validated scale like the CD-RISC is extremely useful for evaluating the effectiveness of resilience-enhancing intervention programs for this population, for example, programs aimed at improving emotional regulation, strengthening coping mechanisms, promoting social support, or enhancing self-efficacy in managing daily challenges. Future studies should aim to confirm the factor distribution in samples from different countries and in populations with conditions other than ABI, including a healthy population. Additionally, incorporating the study of personality variables could provide valuable insights into the characteristics that define resilient individuals. Conflict of Interest The authors of this article declare no conflict of interest. Acknowledgments We gratefully acknowledge the funding and support from the Spanish Ministry of Economy and Competitiveness (Grant PID2019-110127GB-I00 [MINECO/FEDER, UE]) and the fellowships provided to Alba Aza Hernández (BES-2016-078252) and José Luis Castillo Laderas (PRE2020-093000) by the Spanish Ministry of Economy and Competitiveness and the Spanish Ministry of Science and Innovation, respectively, along with the European Social Fund: “ESF Invest in Your Future.” We extend our thanks to the individuals with brain injuries, their families, the professionals, and the organizations who completed the questionnaires and supported this project. Cite this article as: Aza, A., Fernández, M., Amor, A. M., Castillo, J. L., Verdugo, M. A. (2025). Resilience and brain injury: Validation of the connor-davidson scale in spanish individuals. Clinical and Health, 36(1), 37-45. https://doi.org/10.5093/clh2025a5 Funding Spanish Ministry of Economy and Competitiveness (Grant PID2019-110127GB-I00 [MINECO/FEDER, UE]) and the fellowships provided to Alba Aza Hernández (BES-2016-078252) and José Luis Castillo Laderas (PRE2020-093000) by the Spanish Ministry of Economy and Competitiveness and the Spanish Ministry of Science and Innovation, respectively, along with the European Social Fund: “ESF Invest in Your Future.” Ethics Approval Statement This study was approved by the Research Ethics Committee of the University of Salamanca (No: 20189990014185/ Record: 2018/REGSAL-1931). Written informed consent form was obtained from the ABI participants. Personal and clinical data were collected, stored, and protected in accordance with the Regulation (EU) 2016/679 of the European Parliament and of the Council of 27 April 2016 on the protection of natural persons with regard to the processing of personal data and on the free movement of such data and with the Organic Law 3/2018 of 5 December on Data Protection and the Guarantee of Digital Rights, so alphanumeric codes were assigned to all the participants to guarantee their anonymity. All procedures complied with the principles of the Declaration of Helsinki (World Medical Association, 2001) and its amendments. Highlights
The datasets used and analyzed during the current study are available from the corresponding author on reasonable request. References |
Cite this article as: Aza, A., Fernández, M., Amor, A. M., Castillo, J. L., & Verdugo, M. A. (2025). Resilience and Brain Injury: Validation of the Connor-Davidson Scale in Spanish Individuals. Clinical and Health, 36(1), 37 - 45. https://doi.org/10.5093/clh2025a5
Correspondence: azhernandez@usal.es (A. Aza).Copyright © 2026. Colegio Oficial de la Psicología de Madrid


 PDF
PDF CrossRef
 JATS
JATS Print
Print Send
SendEMAIL ALERT
Clinical and Health is licensed under a Creative Commons Attribution-NonCommercial-NoDerivatives 4.0 International License