Temporal Stability of Grit and School Performance in Adolescents: A Longitudinal Perspective
[La estabilidad temporal de la tenacidad y el rendimiento escolar en adolescentes: una perspectiva longitudinal]
Álvaro Postigo1, Marcelino Cuesta1, Rubén Fernández-Alonso1, Eduardo García-Cueto1, and José Muñiz2
1University of Oviedo, Spain; 2Nebrija University, Spain
https://doi.org/10.5093/psed2021a4
Received 1 March 2020, Accepted 26 October 2020
Abstract
Grit is a construct that is related to perseverance and passion for achieving set goals. Its relationship to school performance has been widely researched although the results are not conclusive. The aim of this study was to examine the temporal stability of grit and its relationship to adolescents’ school performance. A sample of 5,371 students were evaluated at two time points, four years apart. At first evaluation, mean age was 9.9 years old (SD = 0.41), at the second it was 13.87 (SD = 0.82). A longitudinal design was used, and the data were analysed using analysis of variance, factor analysis, and structural equations models. Adolescents’ academic grit and school achievement fall between ages of 10 and 14. Adolescents with higher levels of grit had higher academic achievement. The two constructs are correlated, which is why interventions aimed at improving academic grit could be important in improving school performance.
Resumen
La tenacidad es un constructo relacionado con la perseverancia y la pasión por conseguir los objetivos propuestos. Su relación con el rendimiento académico ha sido ampliamente investigada, si bien los resultados no son concluyentes. El objetivo del presente trabajo es analizar la estabilidad temporal de la tenacidad y su relación con el rendimiento académico de los adolescentes. Se utilizó una muestra de 5,371 estudiantes, que fueron evaluados en dos momentos temporales separados por un periodo de cuatro años. En la primera evaluación la media de edad fue de 9.9 años (DT = 0.41) y en la segunda, de 13.87 (DT = 0.82). Se utilizó un diseño longitudinal, analizando los datos mediante análisis de varianza, análisis factorial y modelos de ecuaciones estructurales. La tenacidad y rendimiento académico de los adolescentes descienden entre los 10 y los 14 años. Los que tenían mayor nivel de tenacidad académica mostraron mejores resultados escolares. Ambos constructos están correlacionados, por lo que el uso de programas de intervención para mejorar la tenacidad académica podría ser clave para mejorar su rendimiento académico.
Palabras clave
Tenacidad acad├ęmica, Rendimiento acad├ęmico, Longitudinal, AdolescentesKeywords
Academic grit, School performance, Longitudinal, AdolescentsCite this article as: Postigo, Á., Cuesta, M., Fernández-Alonso, R., García-Cueto, E., & Muñiz, J. (2020). Temporal Stability of Grit and School Performance in Adolescents: A Longitudinal Perspective. Psicolog├şa Educativa, 27(1), 77 - 84. https://doi.org/10.5093/psed2021a4
postigoalvaro@uniovi.es Correspondence: postigoalvaro@uniovi.es (├ü. Postigo).The development of students’ socio-affective and social skills is part of the general objectives of national curricula (Eurydice, 2018). These are extremely important aspects in the educational context as they are part of students’ overall development (Abrahams et al., 2019). In line with these curricular aims, large-scale evaluation programs have begun to include non-cognitive aspects. For example PISA 2015 included collaborative problem solving (OECD, 2017), and in 2018 it included global competence, conceptualized as the capacity to understand others’ perspectives and points of view (OECD, 2018, 2019). Educational evaluations with large samples in Latin America have explored socioeconomic factors associated with performance (Murillo & Hernández-Castilla, 2011). In the United States, The National Assessment of Educational Progress includes an adaptation of the Grit Scale (Duckworth et al., 2007). Grit is one of the non-cognitive variables that has appeared most often in the literature over the last ten years. It consists of a positive trait based on an individual’s perseverance, combined with the passion for achieving a long-term objective (Duckworth et al., 2007). As Duckworth (2016) put it, being gritty is holding on tightly to a meaningful objective, being gritty is falling seven times but getting up eight. Despite the increase in research into grit in the last ten years, results have not been conclusive. One of the most recent debates about grit is whether it should be considered as a general or specific domain (Cormier et al., 2019). Most studies have focused on grit as a general, transversal domain (e.g., Duckworth et al., 2007), but recent research has shown that when grit is considered as a specific academic domain, rather than a general domain, it demonstrates better predictive validity in a school context (Clark & Malecki, 2019; Schmidt et al., 2017). Actually, people tend to choose a single domain on which to spend their time and efforts (Salmela-Aro, 2009). All of this raises questions about whether grit has been measured equally in all contexts and reinforces the need to design and validate measuring instruments that will provide a rigorous evaluation of grit as a specific academic domain. Furthermore, the dimensionality of the construct remains open (Duckworth & Quinn, 2009). The short version of the Grit Scale (Duckworth et al., 2007) has been questioned in some studies. This well-known and widely-used scale was validated with 2 first-order factors (perseverance of effort and consistency of interests) and 1 second-order factor (grit) (Duckworth & Quinn, 2009), though, recent studies have proposed either a unidimensional structure (Areepattamannil & Khine, 2017; González et al., 2019) or a structure with two distinct factors (Abuhassán & Bates, 2017; Datu et al., 2016; Fosnacht et al., 2019; Wolters & Hussain, 2015). Finally, some authors have found low reliability for the Grit-S scale (Clark & Malecki, 2019). In Spain, for example, Arco-Tirado et al. (2018) validated the Grit-S scale with a sample of university students and found reliability below .50 for the perseverance of effort dimension. These disparate results have stimulated new studies into dimensionality, and along with that, into other measuring instruments (Clark & Malecki, 2019; Datu et al., 2018; Sturman & Zappala-Piemme, 2017). There has been a proliferation of research attempting to examine the relationship between grit and school performance. In a meta-analysis, Credé et al. (2017) showed that the relationship between grit and school performance was weak when it was modulated by other variables that grit is strongly related to, such as conscientiousness (Fite et al., 2017; Ivcevic & Brackett, 2014; Schmidt et al., 2018), self-efficacy (Usher et al., 2019), and self-control (Muenks et al., 2017). Nonetheless, many studies have found higher levels of grit to be related to better academic performance in university students (Akos & Kretchman, 2017; Bowman et al., 2015; Eskreis-Winkler et al., 2014; Fong & King, 2019; Hwang et al., 2018; Muenks, et al., 2017; Muenks et al., 2018), high school students (Duckworth & Quinn, 2009; Muenks et al., 2017, 2018; Steinmayr et al., 2018), and middle school students (Clark & Malecki, 2019; Dumfart & Neubauer, 2016; Hagger & Hamilton, 2018; Malanchini et al., 2018; Steinmayr et al., 2018; Tucker-Drob et al., 2016), and that grit plays a mediating role in the performance of students with low cognitive ability (Light & Nencka, 2019). Nonetheless, most of the work has been carried out with students in the USA, and few studies have been carried out in Europe (Dumfart & Neubauer, 2016; Steinmayr et al., 2018). Although the terms “academic performance”, “school performance”, and “academic success” cover different types of evaluations in the literature, the two most common are grade point average (GPA) and standardized tests. GPA, in contrast to standardized tests, is a grade awarded by the teacher, so it can be affected by other aspects, such as study habits, effort, or interest (Marsh et al., 2005). Most studies looking at grit and school performance have been based on a GPA, with very few using standardized tests (Duckworth & Quinn, 2009; Eskreis-Winkler et al., 2014; Malanchini et al., 2018; Tucker-Drob et al., 2016; Usher et al., 2019). When looking at gender, some studies have shown that girls exhibited higher levels of grit than boys, at ages ranging from 7 to 18 years old (Eskreis-Winkler et al., 2014; Oriol et al. , 2017), whereas others, such as Credé et al. (2017), have not found differences. In terms of progression over time, grit seems to be consistent over time and context (Duckworth et al., 2007), and some studies have even shown it increasing with age (Cosgrove et al., 2016; Peña & Duckworth, 2018). However, a recent longitudinal study with a cohort of middle school students found that grit scores decreased over a two year period (West et al., 2016). To date, very few studies have analysed the influence of grit on school performance longitudinally. In primary school students, Jiang et al. (2019) found that grit at the first time-point predicted subsequent school performance, controlling for previous achievement. Tang et al. (2019) found that grit at 13 or 14 years old (eighth grade) was related to academic success at 14 or 15 years old (ninth grade), after controlling for variables such as conscientiousness, prior academic achievement, and socioeconomic level. It seems clear that more longitudinal studies are needed to clarify the role of grit in school performance, and this is precisely the context of our study. We propose four specific objectives: the first is to rigorously analyse the psychometric properties of an academic grit scale, which will serve as the basis for subsequent examinations of the relationships between grit and other variables; the second objective is to attempt to clarify the progression of both academic grit and school performance over time in an adolescent population aged between 10 and 14 years old; the third is to examine the influence of the gender variable in the study of academic grit and on school grades; and the fourth and final objective is to analyse in detail the relationships between academic grit and school performance during a four-year period of adolescence. Participants The sample was made up of a total of 5,371 students attending schools in the Principality of Asturias, a region in northern Spain. The students were evaluated at two time-points separated by four years. The first evaluation was when students were in fourth year of primary school, with a mean age of 9.9 years (SD = 0.41). The second evaluation was when they were in second year of secondary school, with a mean age of 13.87 (SD = 0.82). The majority of students (92.7%) were of Spanish origin, and 49.6% were girls. Procedure Data collection was carried out within the framework of the Diagnostic Evaluation of the Education System program of the Asturian Government Department of Education and Culture. It is a “large-scale group score assessment”, in which cognitive tests and student context questionnaires are applied to participating students. By law, the test is controlled by the Asturian Department of Education and Culture and is performed in accordance with the manual of Instructions for Carrying out the Diagnostic Evaluation (Government of the Principality of Asturias, 2018). The school principals manage and coordinate application within their schools, and the school inspectorate monitors quality. The student context questionnaire, which included items making up the Academic Grit Scale, was applied in the same conditions at the two time-points. School grades were obtained from the Department of Education and Culture record system. Instruments Academic grit scale. Academic grit was measured using a scale comprising 5 items, each with a 4-category Likert-type response scale: never or almost never, sometimes, often, and always or almost always. The following items made up the Academic Grit Scale: 1) “I like studying”, 2) “I work hard to get good grades”, 3) “In class I make sure I pay attention to the teachers’ explanations”, 4) “I complete my tasks even if they are very hard”, and 5) “My assignments are neat and tidy”. The psychometric properties of the scale were analysed, and are presented in the Results section. Table 1 Descriptive Statistics of Academic Grit Scale 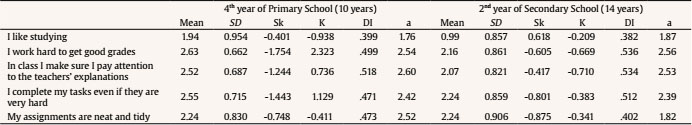 Note. SD = standard deviation; Sk = skewness; K = kurtosis; DI = discrimination index; a = discrimination index from Item Response Theory. School performance. School performance was measured using the mean grade in the corresponding school year (grade point average, GPA) in Spanish Language, Maths, and English (foreign language) at four time-points (fourth and sixth year of primary school, and second and fourth year of secondary school). The grade ranges from 0 to 10 in the three subjects, where 0 is very poor performance and 10 is outstanding performance. Data Analysis We analysed the psychometric properties of the Academic Grit Scale. Each of the properties was measured at the two time-points, looking for evidence of stability. We analysed the item-test correlations (discrimination index) of each item, with correlations above .20 being considered suitable (Muñiz et al., 2005; Muñiz & Fonseca-Pedrero, 2019). We performed an exploratory factor analysis on the polychoric correlation matrix to explore the dimensionality of the scale. We used KMO and Bartlett’s statistic to look at the suitability of the data for factor analysis. As an extraction method we used unweighted least squares (ULS; Flora et al., 2012). The number of factors to extract was determined via optimal implementation of parallel analysis (Timmerman & Lorenzo-Seva, 2011), using 1,000 resampling. We used the goodness of fit index (GFI) and the root mean square residual (RMSR) as indices of fit as they are the most suitable, and independent of the method of estimation (Calderón et al., 2019; Ferrando & Lorenzo-Seva, 2017); fit is considered adequate when GFI > .90 and RMSR < .08 (Kline, 2011). We also considered the percentage of variance explained. Reliability was examined via Cronbach’s alpha and McDonald’s omega coefficients (McDonald, 1999). The correlation between scores at two time-points was calculated to show temporal stability of scores. Using Samejima’s graduated model (Samejima, 1969) within the framework of item response theory, we calculated the “a” parameter of item discrimination, which is adequate for values above 0.64 and very high when above 1.7 (Baker, 1985). We assessed measurement invariance based on sex at two time-points, calculating configural, and metric invariance via multi-group confirmatory factor analysis (MG-CFA). Because we are dealing with nested models, to accept measurement invariance we allowed a change in CFI of less than -.01 (ΔCFI < -.01) and a change in RMSEA of less than .015 (ΔRMSEA < .015) (Chen, 2007). We used a repeated measures ANOVA in order to look at the progression of academic grit and school performance over time. Following that, we performed a mixed ANOVA with one within-factor (time) and one between-factor (sex) to examine the differences between boys and girls in these variables. We used F from Pillai’s trace as a test statistic (Meyers et al., 2016). Principal effects were examined in those situations where, despite the interaction being statistically significant, effect size was null. Effect size was analysed using Cohen’s d, also known as typified difference; d’s interpretation is like a standard deviation in a normal distribution (mean = 0, standard deviation = 1) (Cohen, 1988; Pardo & San Martin, 2010). We calculated Pearson correlations between academic grit and school performance, both transversally and longitudinally. Following that, we analysed a complete structural equations model. We used robust maximum likelihood (RML) as the method of estimation as it is best suited to the type of data in this study (variables do not meet the assumption of multivariate normality and homoscedasticity; given this, a robust procedure makes a better estimation of the parameters). The indices of fit used to examine model fit were CFI and RMSEA. The CFI should be ≥ .95 and RMSEA < .06 (Hu & Bentler, 1999). The gender variable has not been included in the model because it goes beyond the study of differences and it does not add an explanation regarding the influence of academic grit on school performance over time. Discrimination indices and descriptive statistics were calculated using SPSS 24 statistics package (IBM Corp, 2016). Exploratory factor analysis and McDonald’s omega coefficient were calculated using Factor 10.5.03 (Lorenzo-Seva & Ferrando, 2013). Item response theory analyses were performed using IRTPro (Cai et al., 2011). CFAs and the structural equations model was created using MPlus8 (Muthén & Muthén, 2017). Psychometric Properties of the Academic Grit Scale Descriptive statistics for items in the Academic Grit Scale are shown in Table 1. All of the items produced adequate indices of discrimination (Muñiz et al., 2005; Muñiz & Fonseca-Pedrero, 2019), between .399 and .536. The “a” parameter also yielded very high values for each of the items (Baker, 1985). In addition, it is worth highlighting the change in mean for item 1 (“I like studying”), between the first timepoint (1.94) and the second (0.99), which is explained mainly by reduced enjoyment of studying in the second year of secondary school. Bartlett statistic (p < .001) and KMO (> .78) at both time-points indicated the suitability of data for factor analysis. Despite the small number of items, the test exhibited good internal consistency at the first time point (α = .80, ω = .80) and was essentially unidimensional, based on the fact that the first factor explained 55.5% of the total variance, with excellent indices of fit (GFI = .999, RMSR = .022). At the second time-point, psychometric properties were similar. Internal consistency was adequate (α = .77, ω = .78) and the first factor explained 52.6% of variance, with very good indices of fit (GFI = .998, RMSR = .029). Factor loa-dings for all of the items were very high, between .523 and .748. According to this data, the scale should be considered essentially unidimensional (Calderón et al., 2019; Kline, 2011). Scores between two time-points showed temporal stability (r = .324 95% CI [.299, .349]), bearing in mind that there are four years of difference between both moments. Regarding to measurement invariance based on sex at two-time points (Table 2), invariance was confirmed at two levels examined (configural and metric) (Chen, 2007). Table 2 Fit Statistics for Measurement Invariance of Academic Grit Scale Based on Sex at Two Time-points 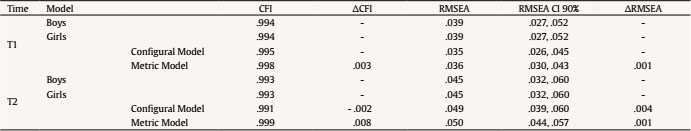 Note. T1 = time 1; T2 = time 2; CFI = comparative fit index; RMSEA = root mean square error of approximation; CI = confidence interval. Table 3 Descriptive Statistics of Academic Grit Scale 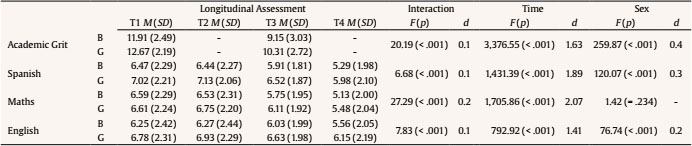 Note. B = boys; G = girls; T1 = 10 years old; T2 = 12 years old; T3 = 14 years old; T4 = 16 years old; M = mean; SD = standard deviation; F = Pillai’s trace statistic; p = significance level; d = effect size. Figure 1 Progression of Academic Grit between 4th Year Primary and 2nd Year Secondary School. 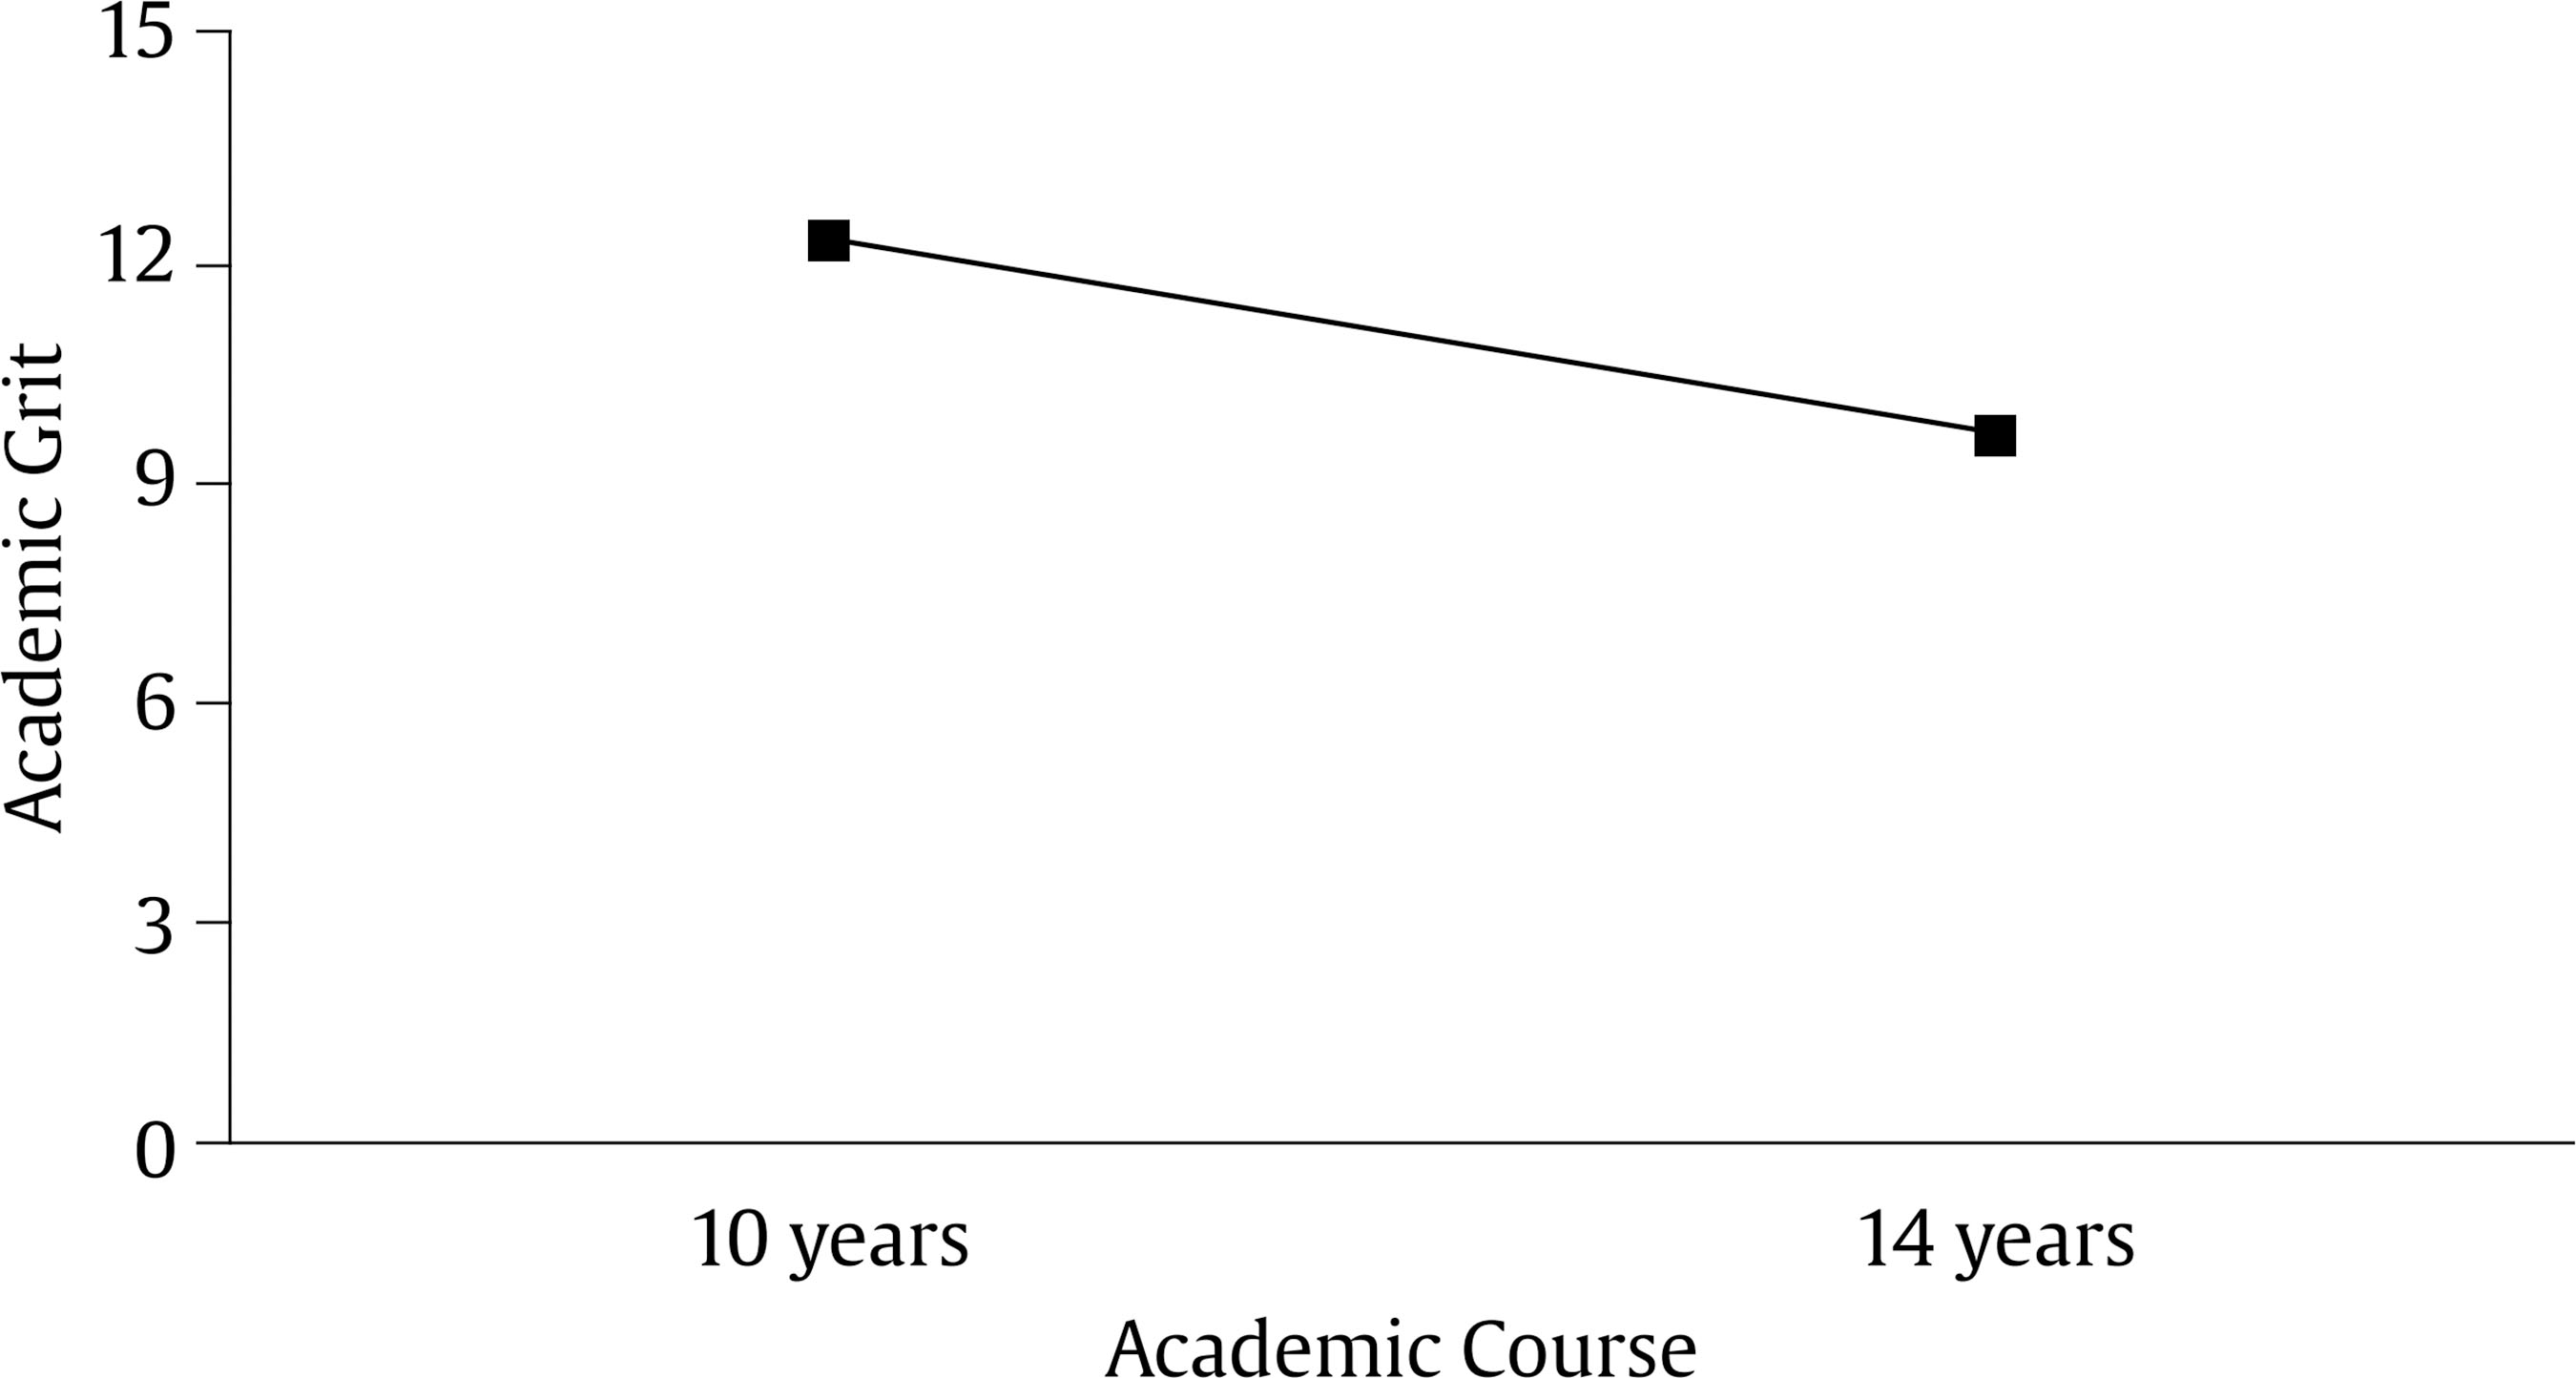 Note. In the Spanish education system these ages correspond to the following academic years: age 10 = 4th year primary school; age 14 = 2nd year secondary school Temporal Stability of the Academic Grit and School Performance We analysed the progression of students’ academic grit and school performance over time. Progression of academic grit is shown in Figure 1, where a clear fall in this variable was seen over time, differences being statistically significant (p < .001), with more than 1.5 standard deviations above between first and second moment (d = 1.63), so 94.8% of the scores of the first temporal moment are above those of the second temporal moment. Correlations between the grades in fourth-year primary and second-year secondary were .586 in Spanish, .577 in maths, and .616 in English. The study of the progression of school performance over time (Figure 2) showed that there were statistically significant differences over time (p < .001) for each of the different subjects making up school performance (Spanish, Maths, and English) with more than 1.3 standard deviations above over time (Spanish: d = 1.74; Maths: d = 1.91; English: d = 1.31), and maths showing the most notable change. Note that, in order to make the figure easier to interpret, the y axis in Figure 2 two goes from 5 to 8, as there was no value outside that range. Figure 2 Progression of Grades in Spanish, Maths, and English between Ages 10 and 16 at Four Time-points. 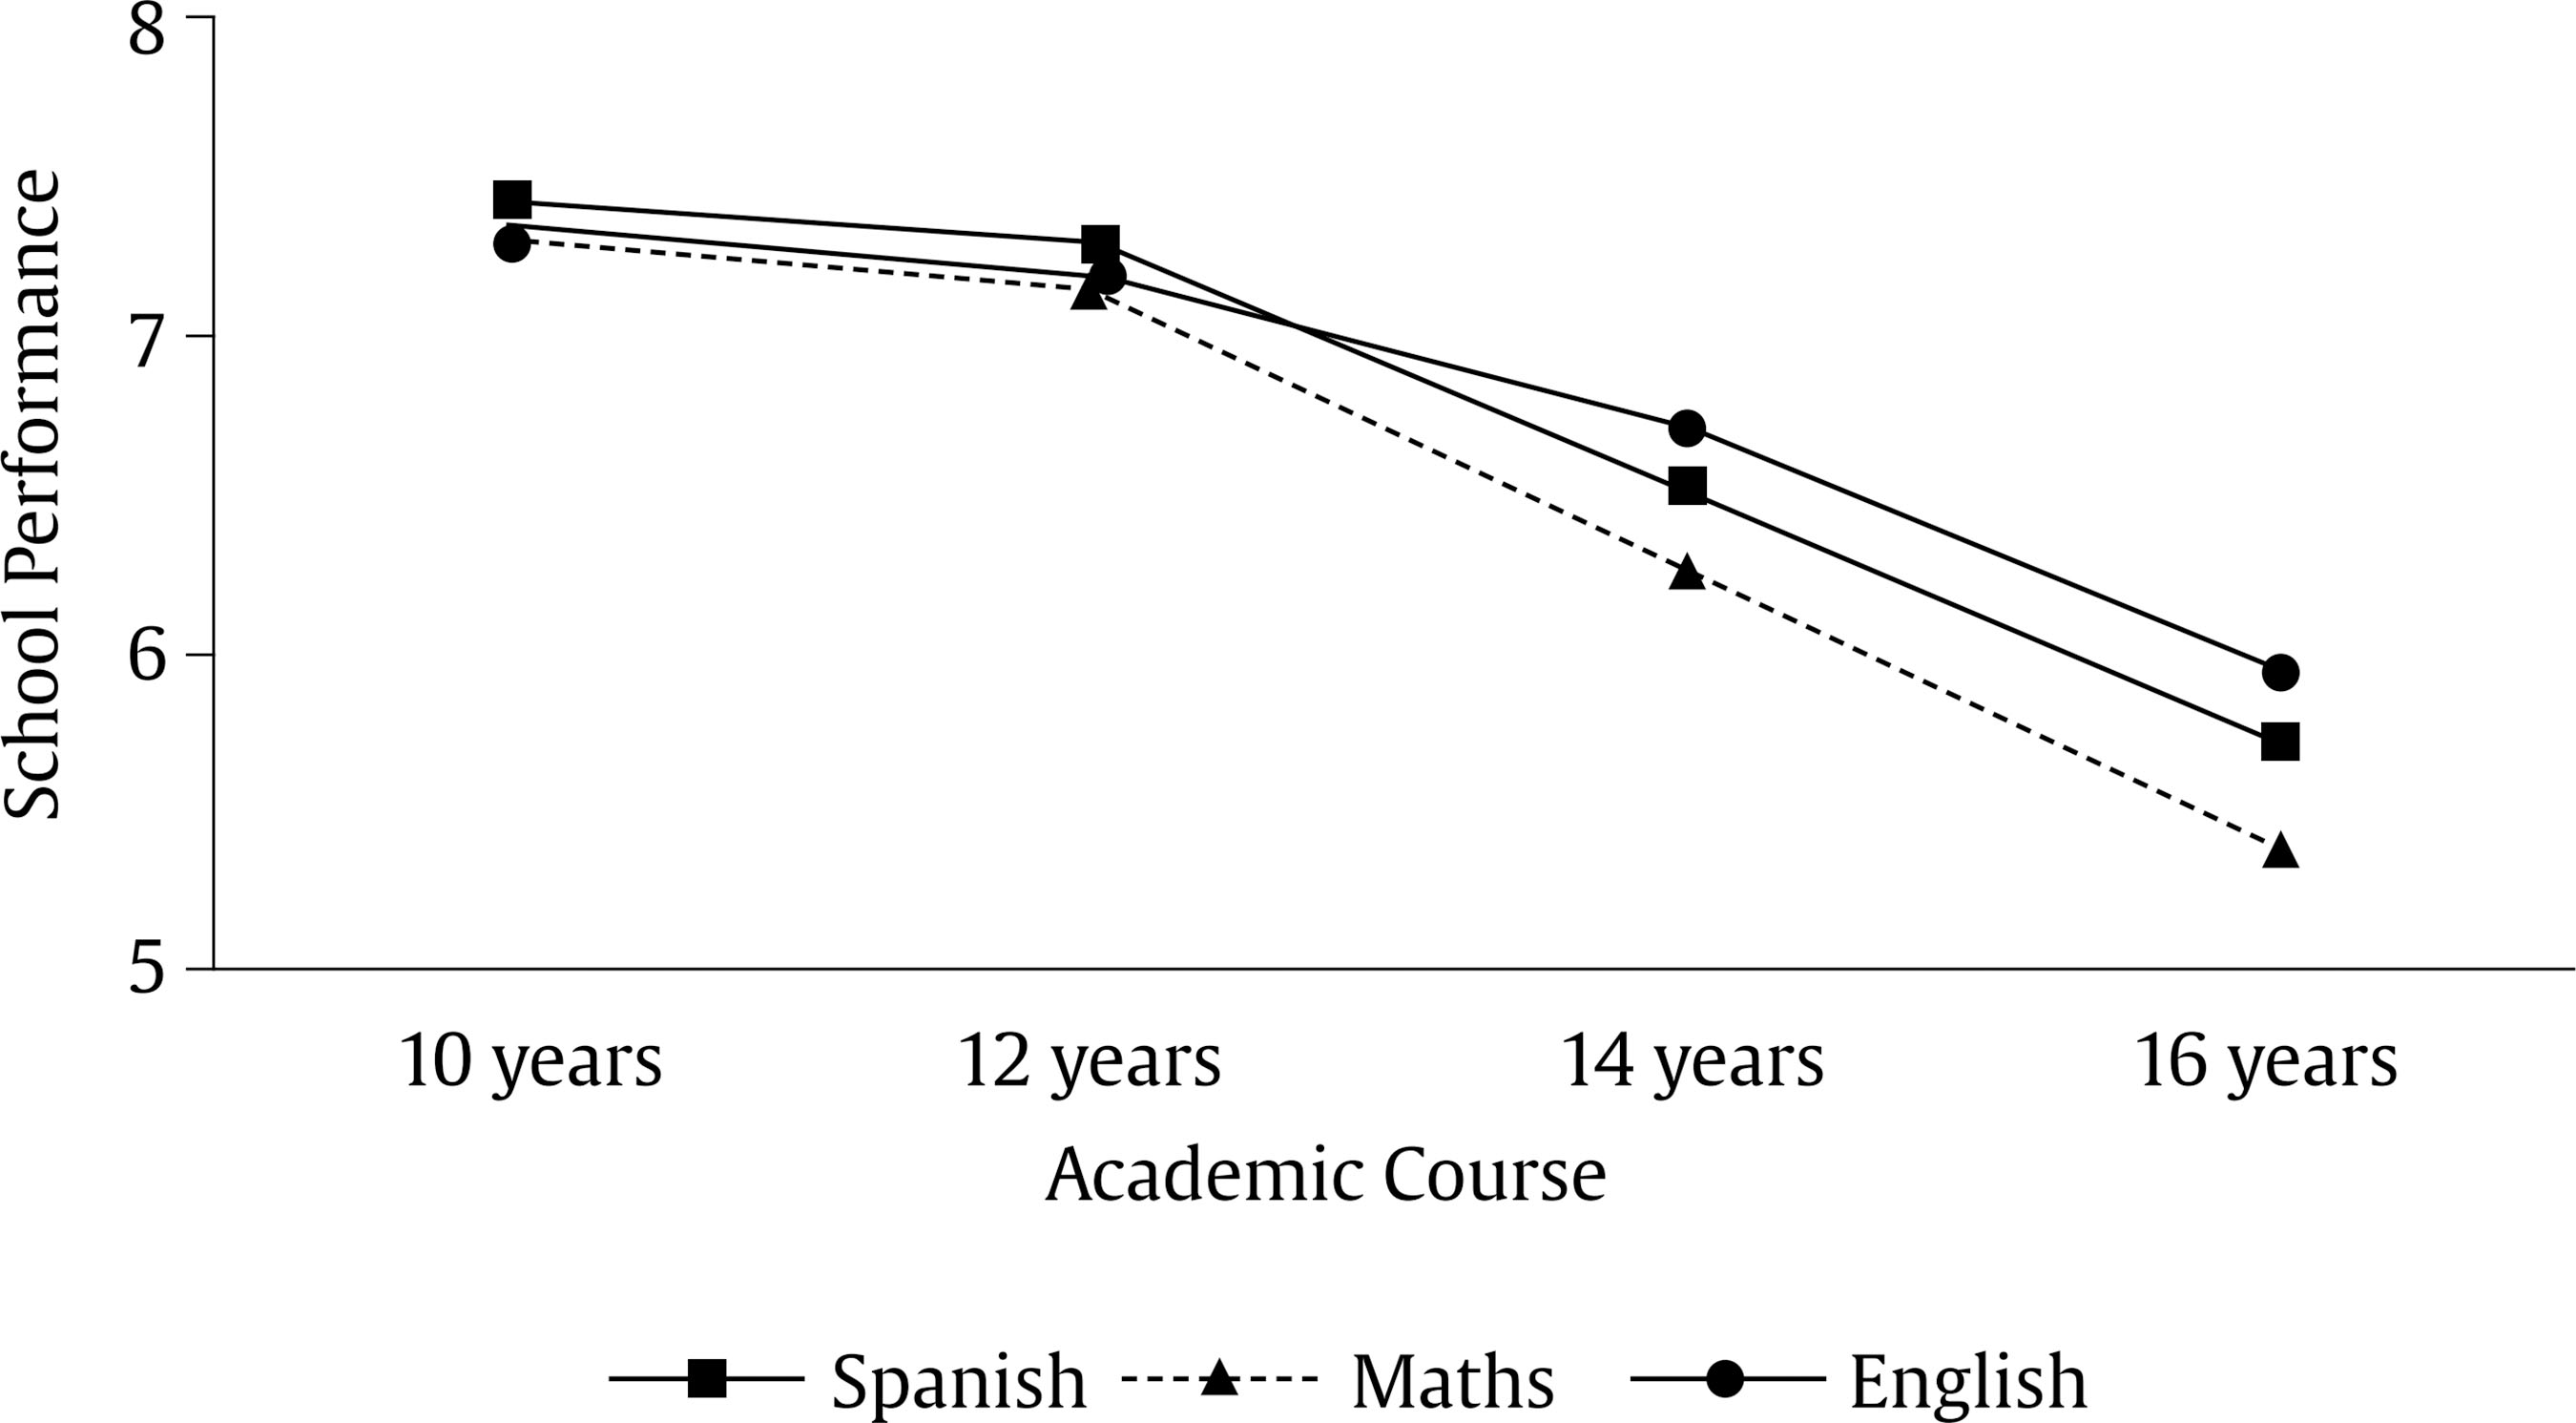 Note. In the Spanish education system these ages correspond to the following academic years: age 10 = 4th year primary school; age 12 = 6th year primary school; age 14 = 2nd year secondary school; age 16 = 4th year secondary school. Following that, we analysed the differences in the progression of academic grit and school performance between boys and girls (Table 3). Interaction for academic grit was statistically significant (p < .001), but the effect size was null. This may be due to the large sample size used in the present study. In terms of principal effects, the most notable differences were in the Time variable, with a fall in means between the two time-points in both boys and girls (d = 1.63), with girls exhibiting higher scores in academic grit at both time-points. In school performance, girls also had higher means than boys at both time-points for each subject. Although the interaction was statistically significant, the effect size in the three subjects was null, so we moved on to examine principal effects. The Time variable exhibited notable differences in the three subjects (d > 1). The Relationship between Academic Grit and School Performance Transversal correlations between academic grit and school performance are given in Table 3, ranging from .295 to .396. Table 4 also shows longitudinal correlations between academic grit in fourth-year primary and school performance in second-year secondary, and between school performance in fourth-year primary and academic grit in second-year secondary, which range between .160 and .298. Table 4 Correlations between Academic Grit and School Performance in 4th Year of Primary School and 2nd year of Secondary School 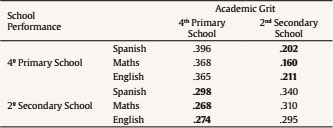 Note. Numbers in bold are the longitudinal correlations. Below, we present a structural equations model with four latent variables. The model gave the following indices of fit CFI = .96, RMSEA = .043, 90% CI [.041, -.045]. There were no high modification indices that could indicate areas of local imbalance. As Figure 3 shows, academic grit in fourth-year of primary school explains school performance in second-year of secondary school, modulated by academic grit of second-year secondary students and by previous school performance. The main objective of this study was to examine the strength of the relationship between grit and school performance, using a longitudinal approach with a sample of 5,371 adolescents at two time-points four years apart. This general objective was broken down into four more specific objectives. Firstly, the development of a psychometrically sound scale for evaluating academic grit. Secondly, to analyse the progression of academic grit and school performance over time. Thirdly, to study the influence of gender on the two variables. Lastly, modelling the relationship between academic grit and school performance using a structural equations model. Many studies have looked at the role of grit in school performance, but the study of grit as a specific domain (academic grit) has been much less common (Clark & Malecki, 2019; Cormier et al., 2019). The Academic Grit Scale we used showed good psychometric properties (Hernández et al., 2016) and demonstrated an essentially unidimensional internal structure (González et al., 2019). In terms of the progression of academic grit over time, we found that as adolescents got older, their levels of academic grit fell, which is in line with findings from previous studies (West et al., 2016). The fall in academic grit in the ages we studied (10-14 years) is outstanding, and it means that determination and pursuit of objectives is much worse in secondary school than in primary school. In terms of sex, and in line with results from other studies (Eskreis-Winkler et al., 2014; Oriol et al., 2017), girls scored higher in academic grit at both time-points, which indicates that girls demonstrate more determination and perseverance in an educational context between the ages of 10 and 14, adapting to school better than boys. When it comes to the progression of school performance over the six years of schooling, it is notable that school performance is constant in primary school, and declines when students start secondary school for the three subjects we looked at: Spanish, Maths, and English. This may be because, on the one hand, as students advance in their schooling, they have more challenges to face (Eurydice, 2018; Government of the Principality of Asturias, 2018), and on the other, a decline in non-cognitive variables such as academic grit. It is also worth noting that, despite the fall in school performance in all students, the girls had better grades throughout the period of their schooling that we studied, in line with previous studies (Voyer & Voyer, 2014). Finally, we examined the relationship that academic grit could have with school performance. Transversal correlations showed us some relationship between academic grit and the three subjects making up school performance. This also occurred longitudinally. This explanation is detailed in the proposed structural equations model (Figure 3). It shows that academic grit in fourth-year of primary school exhibits an indirect relationship with school performance in second-year of secondary school, which is modulated by academic grit in second-year of secondary school, and by previous performance. Students who make more effort in fourth-year of primary school tended to have higher GPAs four years later, as long as this effort was reflected in their performance in fourth-year of primary school and they continued to make efforts in second-year of secondary school. To put it another way, students who persevered over time (high levels of academic grit at both time-points) tended to have a better GPA in the second-year of secondary school. Similarly, students who persevered in the fourth year of primary school, whose efforts were reflected in their GPA at the time, tended to also have a better GPA in the second year of secondary school. In contrast, having high levels of grit in fourth-year of primary school by itself was not linked to a student having a good GPA in the future. Academic grit does influence school performance longitudinally, which indirectly confirms the results of previous research (Jiang et al., 2019; Tang et al., 2019). This relationship may be understood as positive experiences, such as getting good grades, making it easier to have better beliefs about oneself (Bandura, 1986), which improve the development of better determination and perseverance. Having appropriate beliefs about oneself in turn may help students reach long-standing learning goals, reflected in school results (Huang, 2011). Figure 3 Structural Equations Model for the Prediction of School Performance. 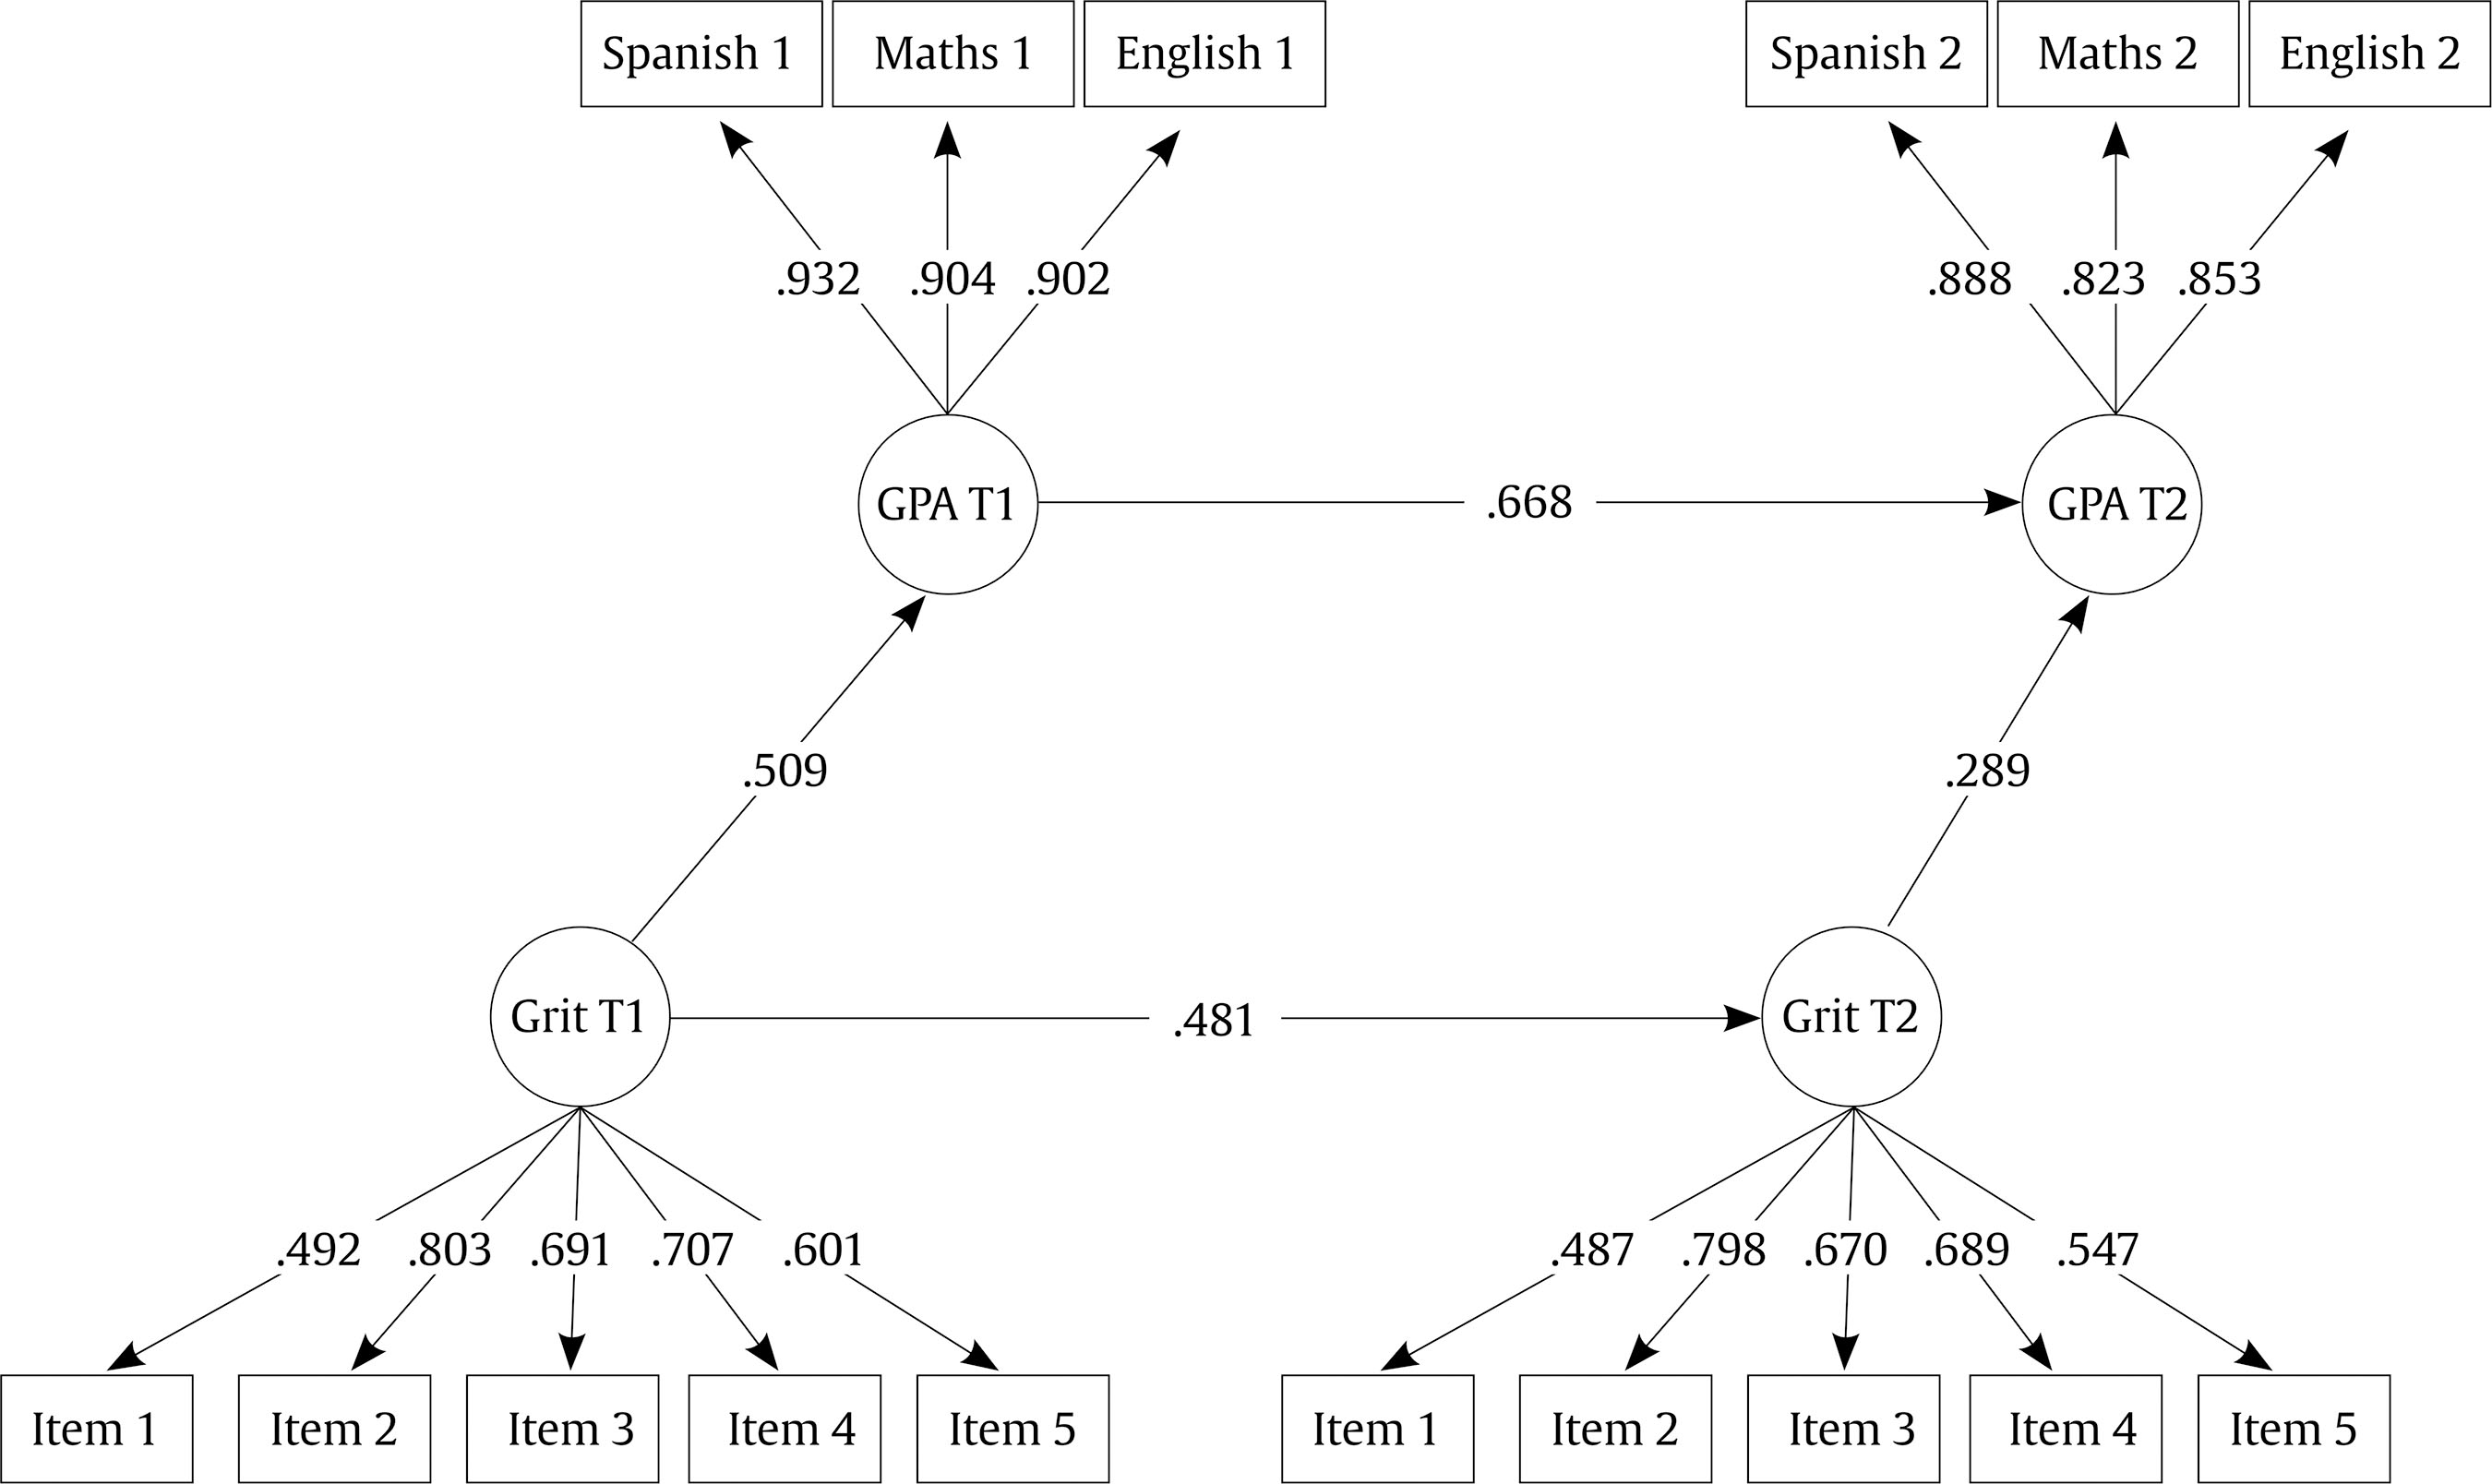 GPA = grade point average; T1 = 4th grade of Primary School (10 years); T2 = 2nd grade of Secondary School (14 years). Thanks to its brevity, the Academic Grit Scale used in this study could be a very useful instrument in practice, which could help teachers and education authorities to evaluate this construct and intervene with the aim of improving school performance in adolescents (Clark & Malecki, 2019; Cormier et al., 2019). Early intervention in academic grit may help improve achievement in secondary education (Kirchgasler, 2018; Shechtman et al., 2013). The main idea is that encouraging children to value learning as a good thing in and of itself may help them to maintain their interest and efforts towards long term goals (Park et al., 2018), as well as their motivation (Fryer & Ainley, 2019). In this vein, it would be helpful for future research to include more non-cognitive variables longitudinally, such as conscientiousness (Dumfart & Neubauer, 2016; Schmidt, et al., 2018), self-efficacy (Rakoczy et al., 2019; Usher et al., 2019), and self-control (Muenks et al., 2017), as well as socio-contextual aspects such as academic resilience (García-Crespo et al., 2019). This would help us to better understand student behaviours underlying academic success. The results of this study should be interpreted with some limitations in mind. Firstly, and generally, the potential biases of self-reports, including social desirability and acquiescence bias (Duckworth & Yeager, 2015; Suárez-Álvarez et al., 2018). In the future, to avoid these potential biases, the evaluation of non-cognitive variables like grit could use other strategies such as ipsative tests, situational judgement tests, or “anchoring vignettes” (Abrahams et al., 2019; Kyllonen, 2015; Moreno et al., 2018). Another aspect to highlight is that it might be interesting for future research to consider students’ cognitive capacity, given its significance in school performance (Chamorro-Premuzic & Furnham, 2004; Heckman & Kautz, 2012; Rosander & Backstrom, 2014). In this way, the extent of academic grit’s mediating role may be studied, over time, based on the students’ intellectual capabilities (Light & Nencka, 2019). Finally, it is important to reiterate that our results were obtained for a very specific age range (10-14), and so caution is advised when generalizing to other ages. Conflict of Interest The authors of this article declare no conflict of interest. Acknowledgments We would like to express our utmost gratitude to the Government of the Principality of Asturias (Spain), without whose collaboration this research would not have been possible. Cite this article as: Postigo, A., Cuesta, M., Fernández-Alonso, R., García-Cueto, E., & Muñiz, J. (2020). Temporal stability of grit and school performance in adolescents: A longitudinal perspective. Psicología Educativa. 27(1), 77-84. https://doi.org/10.5093/psed2021a4 Funding: This research has been funded by the Spanish Ministry of Economy and Competitiveness (PSI2017-85724-P), and by a predoctoral grant from the Principality of Asturias (BP17-78). References |
Cite this article as: Postigo, Á., Cuesta, M., Fernández-Alonso, R., García-Cueto, E., & Muñiz, J. (2020). Temporal Stability of Grit and School Performance in Adolescents: A Longitudinal Perspective. Psicolog├şa Educativa, 27(1), 77 - 84. https://doi.org/10.5093/psed2021a4
postigoalvaro@uniovi.es Correspondence: postigoalvaro@uniovi.es (├ü. Postigo).Copyright © 2026. Colegio Oficial de la Psicología de Madrid


 PDF
PDF e-PUB
e-PUB CrossRef
 JATS
JATS Imprimir
 Enviar
ALERTA POR E-MAIL
La Revista de Psicología Educativa está distribuida bajo una licencia de Creative Commons Reconocimiento-NoComercial-SinObra Derivada 4.0 Internacional.com