Are Dyslexic People more Creative? Myth or Reality: A Meta-analysis
[┬┐Son las personas disl├ęxicas m├ís creativas? Mito o realidad: metaan├ílisis]
Mónica Gutiérrez-Ortega1, Maryem Torres-Quesada2, Patricia Crespo2, Verónica López-Fernández2, Noemi Fariña2, and Analía Barbón2
1Universidad de Valladolid, Spain; 2Universidad Internacional de La Rioja, Logro├▒o, Spain
https://doi.org/10.5093/psed2023a1
Received 19 January 2022, Accepted 16 August 2022
Abstract
The claim that people with dyslexia are more creative than people without this learning disorder is widespread. But the complexity of creativity and the way it is measured means that this statement is sometimes inconsistent. The aim of this review is, on the one hand, to explore the relationship between dyslexia and creativity, as well as to analyze the categories of divergent thinking: fluency, originality, abstractness, elaboration, and flexibility. On the other hand, it also aims to identify moderators that may be influencing this relationship, such as age, country, or the test used. We retrieved 13 empirical studies that provided 39 effect sizes. The results show that there are no significant differences between people with and without dyslexia in terms of creativity when considering the construct as a whole. However, a significant relationship between the two constructs is observed when analyzing the categories of divergent thinking isolated.
Resumen
La afirmación de que las personas con dislexia son más creativas que las personas sin este trastorno específico del aprendizaje está muy extendida. Pero la complejidad del constructo de creatividad y la forma en que esta se mide, hace que esta afirmación sea contradictoria. El objetivo de esta revisión es doble; por un lado, pretende explorar la relación entre dislexia y creatividad, así como analizar las categorías del pensamiento divergente: fluidez, originalidad, abstracción, elaboración y flexibilidad; por otro, pretende identificar moderadores que puedan estar influyendo en esta relación, como la edad, el país o la prueba utilizada. Se recuperaron trece estudios empíricos, con un total de 39 tamaños de efecto. Los resultados muestran que no existen diferencias significativas en cuanto a la creatividad entre personas con dislexia y sin ella cuando se considera el constructo como un todo. Sin embargo, se observa una relación significativa entre ambos al analizar las categorías de pensamiento divergente de forma aislada.
Palabras clave
Creatividad, Dislexia, Metaanálisis, Aprendizaje, Desarrollo infantilKeywords
Creativity, Dyslexia, Meta-analysis, Learning, Child developmentCite this article as: Gutiérrez-Ortega, M., Torres-Quesada, M., Crespo, P., López-Fernández, V., Fariña, N., & Barbón, A. (2023). Are Dyslexic People more Creative? Myth or Reality: A Meta-analysis. Psicolog├şa Educativa, 29(1), 55 - 64. https://doi.org/10.5093/psed2023a1
Correspondence: patricia.crespo@unir.net (P. Crespo).At different times, it has been stated that people with dyslexia are more creative than people without dyslexia, especially as some authors have observed that there is a tendency of people with dyslexia to choose studies related to artistic education (Corlu et al., 2007). In fact, some reports have noted that the prevalence of individuals with dyslexia among students of art education may be 15% compared to the 1% in students of other disciplines, such as economics (Wolff & Lundberg, 2002). This claim has also been supported by the fact that some studies have indicated that people with dyslexia may have better global visual-spatial processing capacity (Karolyi et al., 2003) and even a more optimal profile in specific subproducts or products related to originality and fluidity (Cancer & Antonietti, 2019). However, other authors have pointed out that this could be because people with dyslexia somehow try to avoid educational areas in which writing is very relevant (Ott, 1997). To better understand this topic, it is important to define what is meant by creativity. Creativity is a complex construct that impacts different life areas (Runco et al., 2001). There are many definitions of creativity, so, to facilitate their study, they have traditionally been classified into four approaches, namely product, process, context, and person. Joining all of them, creativity can be understood as people’s ability to find solutions to problems that are valid and original, allowing them to obtain, through a process, new, original, and valid products (Runco & Jaeger, 2012) that are validated in a given context (Navarro, 2008). In this sense, most definitions conceptualize creativity as a problem-solving process or based on divergent thinking (a term coined by Guilford) as one of the ways to evaluate the construct (Fernández Díaz et al., 2019). In this regard, it should be noted that creativity and Guilford’s (1950) divergent thinking are not interchangeable terms (Baer, 2011). Thus, creativity refers to the “whole”, whereas divergent thinking refers to a part of that “whole.” Delving a little deeper into the differences, creativity implies the ability to find difficulties, ask questions about them, formulate hypotheses that could answer those questions, test them, modify them if necessary and, finally, communicate the results found (Torrance, 1966). Divergent thinking includes creativity in a more restricted way, in particular, focusing only on producing possible answers as a result of the questions raised. In this way, divergent thinking is a central component of the overall creative ability, but it does not imply the full apprehension of the construct. However, this has not prevented divergent thinking from being one of the most studied areas of creativity (Plucker & Renzulli, 1999; Runco, 2007), and the Torrance Tests of Creative Thinking (TTCT) (eminently divergent thinking) from being one of the most widely used instruments worldwide (Kim, 2006). It should be noted that the TTCT have been translated into 35 languages (Kapoula & Vernet, 2016). To assess divergent thinking, people are asked to generate ideas in response to instructions and patterns, which can be verbal or figurative (Kim, 2006; Wallach & Kogan, 1965). These productions, products, or specific subprocesses of creativity can be grouped into different categories: fluency (generating the greatest number of answers to open problems), originality (the number of unique responses), capacity for abstraction (the ability to capture the important part of the information involved), need or resistance for premature closure (the degree of psychological openness to diverse or ambiguous information), elaboration (the amount of detail in the responses), and flexibility (the number of different response categories), which reflect divergent thinking. In this line, within its complexity, creativity can also be evaluated from the perspective of the operations involved in the generation of ideas, such as “widening, connecting, and reorganizing” (Antonietti et al., 2011), so, in the scientific literature, there are also instruments that focus on evaluating these types of mental operations. Lyon et al. (2003, p. 2) define dyslexia as a learning disability of neurobiological origin, which “is characterized by difficulties with accurate and/or fluid recognition of words and poor spelling and decoding.” The present difficulties usually have their origin in a deficit in the phonological component of language, along with other multiple deficits (Koyama et al., 2013). Both intelligence and sensory abilities are normal, and there is no motor impairment that justifies the reading difficulties (Démonet et al., 2004). The cognitive profile of these students shows that they usually present reading comprehension problems, as well as a reduced lexicon as a result of their low reading interaction. For example, Hatcher et al. (2002) reported that students with dyslexia obtain lower scores in reading, writing, processing, and phonological skills, attention, and organization. The students only scored within the mean on the vocabulary tasks of the Weschler scale and the Raven test. The meta-analysis by Swanson and Hsieh (2009), in which they analyzed 52 previous studies, showed similar results: dyslexic people have a cognitive profile in which there are greater difficulties in writing, reading, phonological processing, retrieval of verbal information from the long-term memory, and also in arithmetic. In addition, they present persistent difficulties in their short-term memory, with shorter activation periods. Callens et al. (2012) found similar results, with lower scores (although the differences were not always significant) in the dyslexic student group compared to the control group. Previous studies have shown heterogeneity in the results regarding the relationship between creativity and dyslexia. On the one hand, several studies reported no differences in creativity between people with and without dyslexia. In this line, authors such as LaFrance (1995) found no significant differences when comparing the groups with and without dyslexia in creativity, although they concluded that the former were more open to considering different response alternatives. Nor did Everatt et al. (1999) find significant differences in the two groups, although the group of people with dyslexia scored higher in creativity than the control group. This same result was found in the work of Everatt et al. (2008). Also, Alves and de Cássia Nakano (2014) found no differences in the scores of children with and without dyslexia in creativity (although they found that scores in the control group were higher in total creativity, but in the group with dyslexia the means were higher in the most evaluated creative characteristics). On the other hand, other studies have found that people with dyslexia showed lower creativity, for example, studies that have compared the two groups in personality traits have shown that people in the group with dyslexia seem to score lower in originality, creativity, and emotional control (Gagliano et al., 2014). On the contrary, other authors have found significant differences in favor of the creativity group vs. the control group. For example, Tafti et al. (2009) claimed that students with dyslexia are more creative than students without dyslexia in figurative tasks. The study of Kapoula et al. (2016), also in this line, concluded that children and adolescents with dyslexia are more creative than controls. Hence, the purpose of this study is to clarify the relationship between creativity and dyslexia through a meta-analysis, as well as to identify moderators that may be influencing this relationship. The implications of this relationship could lead to a better knowledge of the construct of creativity in different populations, as well as to better adjustment, more adapted, and specialized to the needs of people with dyslexia. This could also determine which variables could have the greatest influence on this relationship: age, personality traits, time of diagnosis, and types of instruments used to assess creativity. The general goal of this meta-analysis is to determine whether people who have dyslexia are more creative than people who do not. As the construct of creativity can be approached in different ways, two specific objectives are proposed. First, we analyzed possible differences between the two groups when creativity is considered as a whole and, secondly, whether there are differences between the two groups when creativity is considered as specific subprocesses, such as fluency, originality, abstraction capacity, elaboration, and flexibility. Finally, a series of moderators were introduced to analyze whether or not this relationship between creativity as a whole and having dyslexia can be influenced by age, geographical area, and the test used. A systematic review (Šimíková, 2018) and two meta-analyses (Erbeli et al., 2021; Majeed et al.,2021) on the topic have been recently published. The studies by Šimíková (2018) and Majeed et al. (2021) conclude that there are no differences between the groups, pointing out that there are differences according to age, that is, there are significant differences in adult dyslexics but not in children. In the same line, Erbeli et al. (2021) focus on analyzing age, gender, and creativity domain (figurative vs. verbal creativity) as moderating variables. The authors conclude that, in general, there are no differences between the groups. As for age, differences do not seem stable, and differences were found between adolescents and adults, but not between children and adults. Concerning gender, females outperformed males in creativity. Finally, regarding the creative domain, the dyslexia group showed a significant performance disadvantage in verbal creativity relative to figural/ creativity compared with the control group. No study has analyzed in depth the different categories of creativity and the differences between them, so, as indicated above, the present study aims to delve into the way of conceiving the construct of creativity and to verify if there are differences between the groups based on that conception. Study Selection The elaboration of the meta-analysis followed the PRISMA protocol [preferred reporting items for systematic reviews and meta-analysis for protocols] (Page et al., 2021). The study followed the PICO method [population, intervention, comparison, and outcome] (Table 1). Table 1 PICO Worksheet 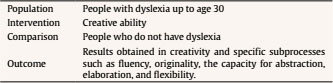 Prior to the start of the analysis, the meta-analysis was recorded in PROSPERO on May 30, 2021 (CRD42021252306). The search was carried out in two of the main scientific databases, Web of Science, and Scopus, from January 1, 2000, to December 31, 2020. The search was complemented with the results obtained in manual search of the reference lists. The search terms included, in different combinations, the following keywords: (dyslexi* OR “reading disabilities” OR “reading problems” OR “learning disabilities” OR “decoding deficits” OR “visual word recognition deficits”) AND (creativity OR “divergent thinking” OR “originality” “creative thinking” OR “imagination” OR “associative thinking”). We also searched for additional articles from the reference lists of existing reviews. Finally, the authors were contacted if any information was missing. The initial search identified 1,869 related studies. After removing duplicates (n = 548), the abstracts of 1,326 articles were reviewed, and only 45 met the inclusion requirements. Of them, 13 provided quantitative information to calculate the effect size (Figure 1). Figure 1 Flow Chart of the Inclusion and Exclusion of Studies. 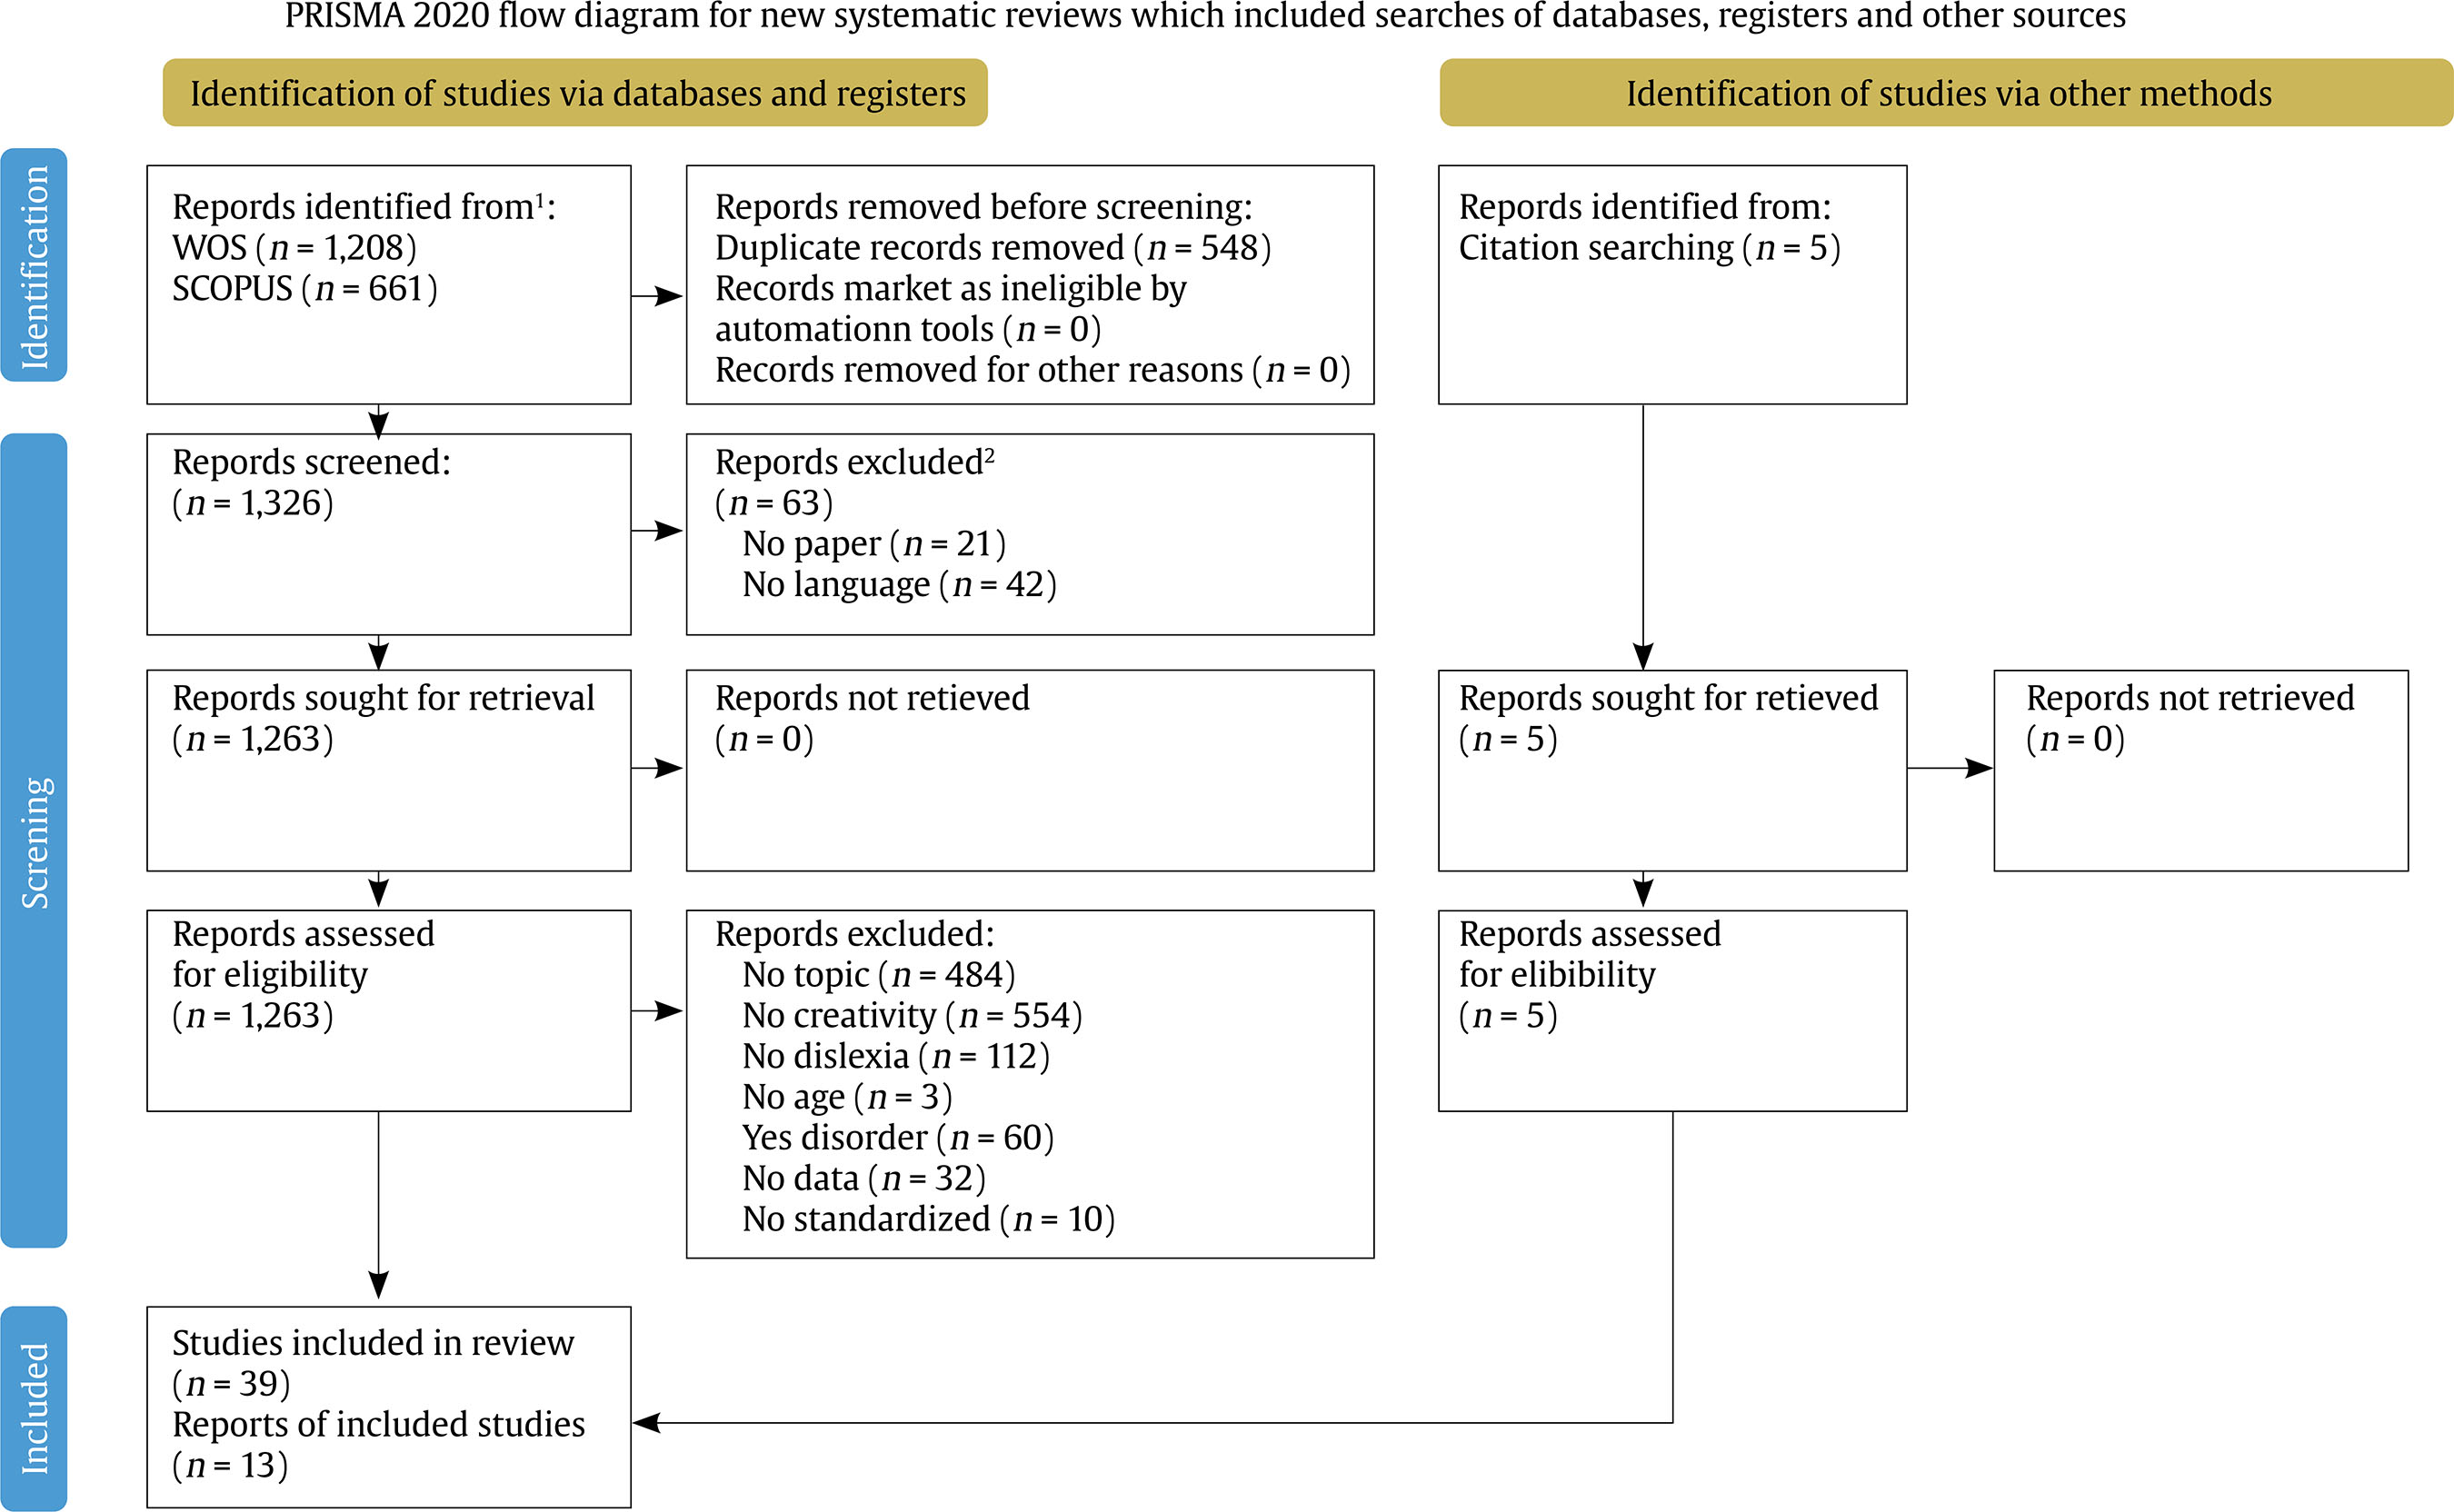 1Consider, if feasible to do so, reporting the number of records identified form each database or register searched (rather than the total number across all databases/registers). 2If automation tools were used, indicate how many records were excluded by a human and how many were excluded by automation tools. The eligibility of the studies in the meta-analysis took into account the following inclusion and exclusion criteria:
The included studies provide sufficient quantitative information (e.g., correlations, means, and standard deviations, odds ratios, F- or t-values) to calculate the effect size through meta-analysis. Studies that did not submit valid data for the study were excluded. The included studies were published as of 2000, and studies in English, Spanish, and Portuguese were included. Evaluation of the Quality of Studies Two researchers assessed the quality of each study independently using the Newcastle-Ottawa Scale (Wells et al., 2000). The risk of bias in the selection, comparability of the cohorts, and results was evaluated by assigning stars according to the following criteria. Firstly, selection (maximum 4 stars): the representativeness of the group of people with dyslexia, selection of the group of normo-readers, verification of the characteristics of the subjects, and demonstration that the variable of interest was present at the beginning of the study. Secondly, comparability (maximum 2 stars), that was evaluated based on the design and analysis of the study, controlling for one or more variables of interest (age, gender, socioeconomic level, etc.). Thirdly, results (maximum 3 stars), that analyzed the assessment of the outcome, the follow-up of the results, and the cohorts (controlling for missing cases). Studies with a score between 7 and 9 were considered to be of high methodological quality, between 4 and 6, moderate, and less than 4, low (Wells et al., 2014). Most studies had a high methodological quality according to Wells et al. (2014). The studies that obtained the lowest score were those of Alves and de Cássia Nakano (2014) and Kasirer and Mashal (2016). The study of Avitia (2019) obtained the highest score, 9 points. The results are shown in Table 2. Table 2 Quality Assessment of Studies Included in the Systematic Review. Newcastle Ottawa Scale (Risk of Bias) (Wells et al., 2009) 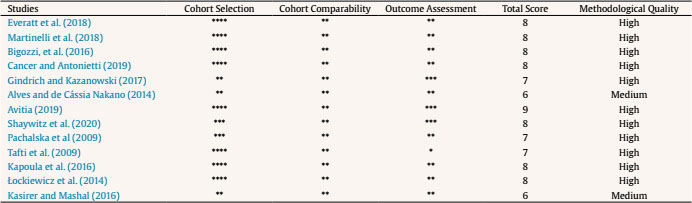 Data Extraction Following Lipsey and Wilson (2001), three researchers coded the information presented in the studies to carry out the systematic review and subsequently calculate the effect size (Table 3). Table 3 Characteristics of Studies Examining the Association of Dyslexia and Creativity 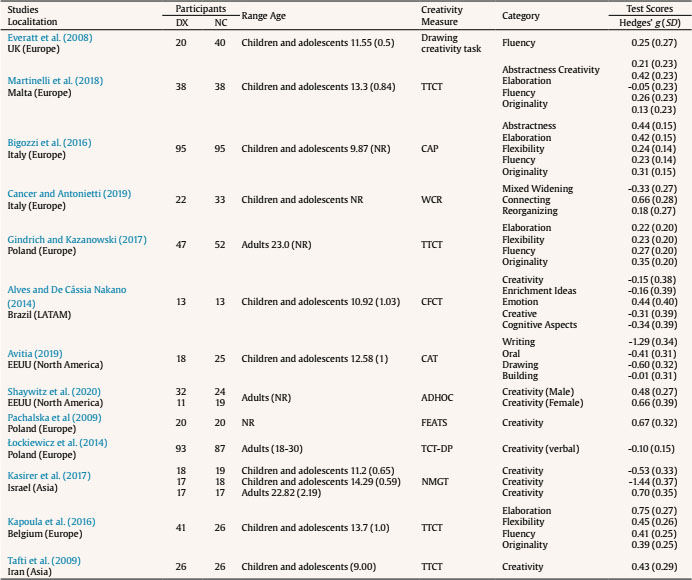 The selection of the relevant outcomes of each study was reached through consensus among the researchers. If a study reported outcomes for different age groups, the data for all age groups were recorded. If the results reported data at more than one time, the data from the first contact with the sample were chosen. If a study offered data from more than one category, all the categories identified were represented. Subsequently, three researchers analyzed the selected studies. The selection was made using Parsifal (Kitchenham & Charters, 2007) and articles were retrieved for full-text review. The authors analyzed the full text of these articles independently using the established inclusion and exclusion criteria. In case of doubt or disagreement, the data were reviewed by a third author and discussed until consensus was reached. From the included studies, three authors extracted the information according to the defined coding book. The extracted items included the main author, publication data (year, location), characteristics of the sample of people with dyslexia (n, age at the time of evaluation), and the control group, data associated with the study (mean scores, and standard deviation, tests used and their characteristics). Statistical Analyses The analyses were carried out with comprehensive meta-analysis (CMA, v.3.3.070; Borenstein et al., 2009). The calculations were made using the means, standard deviations, and size of the groups. We selected a random-effects model, given the high variability observed between the studies (Raudenbush, 2009) and, as an effect size index, the differences between the group with dyslexia and the control group Hedges’ g (Hedges & Olkin, 1985), which provides a more conservative estimate than Cohen’s d when the percentage of the samples is not very large, as in our case. The values of 0.2, 0.5, and 0.8 of Hedges’ g represent a small, medium, and large effect size, respectively. The Q test was used to assess the heterogeneity of the effect sizes (Cochran, 1977) along with the I2 index (Higgins & Thomson, 2002). A significant value in the Q index suggests that the distribution of the effect sizes around the mean is greater than would be expected only from a sampling error. The I2 statistic quantifies the degree of heterogeneity by estimating the percentage of variance that is attributable to the variability between studies. Values of about 25, 50, and 75% could be considered low, moderate, and high, respectively (Higgins et al., 2002). Moderator Analysis We also examined specifically the efects of three moderators on outcomes: (a) participants’ age, (b) type of test used, and (c) location of the study. As for creativity diferences in participant age, we decided to group by the following age criteria: children and adolescents for the range of 5 to 17 years and adults for the range of 18 to 30 years. In the case that a study offered a joint score for different ages within a group, the score was included in the age category in which the mean age was included. If a study offered different scores according to age groups, all scores were included (e.g., Kasirer et al., 2017). Meta-analytic Results The meta-analysis included 13 articles that analyzed the relationship between the presence of dyslexia and creativity (see Table 3). A total number of 2,985 subjects participated in these studies, distributed between the dyslexia group (1,474) and the control group (1,511). We obtained 39 effect sizes because we found that several articles subdivided the groups and provided different results from different samples. Each selected study compared the scores of a group with a diagnosis of dyslexia with those of a control group. The effect size is the standardized mean difference, Hedges’ g. The standardized difference of means was 0.16, and the confidence interval for the effect size was 0.04-0.28 (Z = 2.60, p = .01). These data suggest that people with dyslexia scored substantially higher on the creativity tests than people who did not have dyslexia. The effect sizes found in the studies varied depending on the variable analyzed. Table 4 presents the data related to the effect size and heterogeneity indices for each of the variables analyzed. On the one hand, it can be seen that studies that offered data on creativity as a “whole” presented a nonsignificant effect size (g = -0.03, Z = -0.28 p = .78). On the other hand, when analyzing the categories of divergent thinking, it can be seen that the effect sizes were significant and positive, varying slightly from one category to another, and those associated with Fluency (g = 0.27, Z = 2.95, p = .00) and Flexibility (g = -0.28, Z = 2.55, p = .01) presented lower effect sizes, and Abstractness (g = 0.37, Z = 3.05, p = .00), Elaboration (g = 0.33, Z = 2.29, p = .02), and Originality (g = 0.32, Z = 3.34, p = .00) provided slightly higher effect sizes. Table 4 Meta-analysis Results Categorized 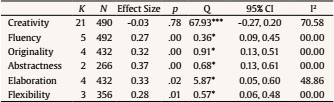 Note. K = number of effect sizes; N = sample of people with dyslexia and control group; Q = the Q-statistic is a chi-square statistic that indicates whether the heterogeneity of variance is significantly greater than zero; I2 is a proportion of unexplained variance (Q – df/Q). *p < .05, **p < .01, ***p < .001. Thus, the comparison indicates that people with dyslexia do not show the same creativity in all the areas analyzed. Variability due to heterogeneity was medium among the selected studies (I2 = 59.56, k = 39) but it was minimal in all categories except for Elaboration (I2 = 48.86, k = 4). All five categories were examined, resulting in additional comparisons that are shown below. Creativity as a Whole Of the 39 effect sizes, 21 presented data about the relationship between creativity and dyslexia. The mean effect size of the sample was non significant (Hedges’ g = -0.03, 95% CI [-0.27, 0.20], k = 39, Z = -0.28, p = .77). The effect sizes were heterogeneous, Q(20) = 67.93, p < .01, I2 = 70.58 (see Figure 2). Figure 2 Forest Plot of Creativity Category. 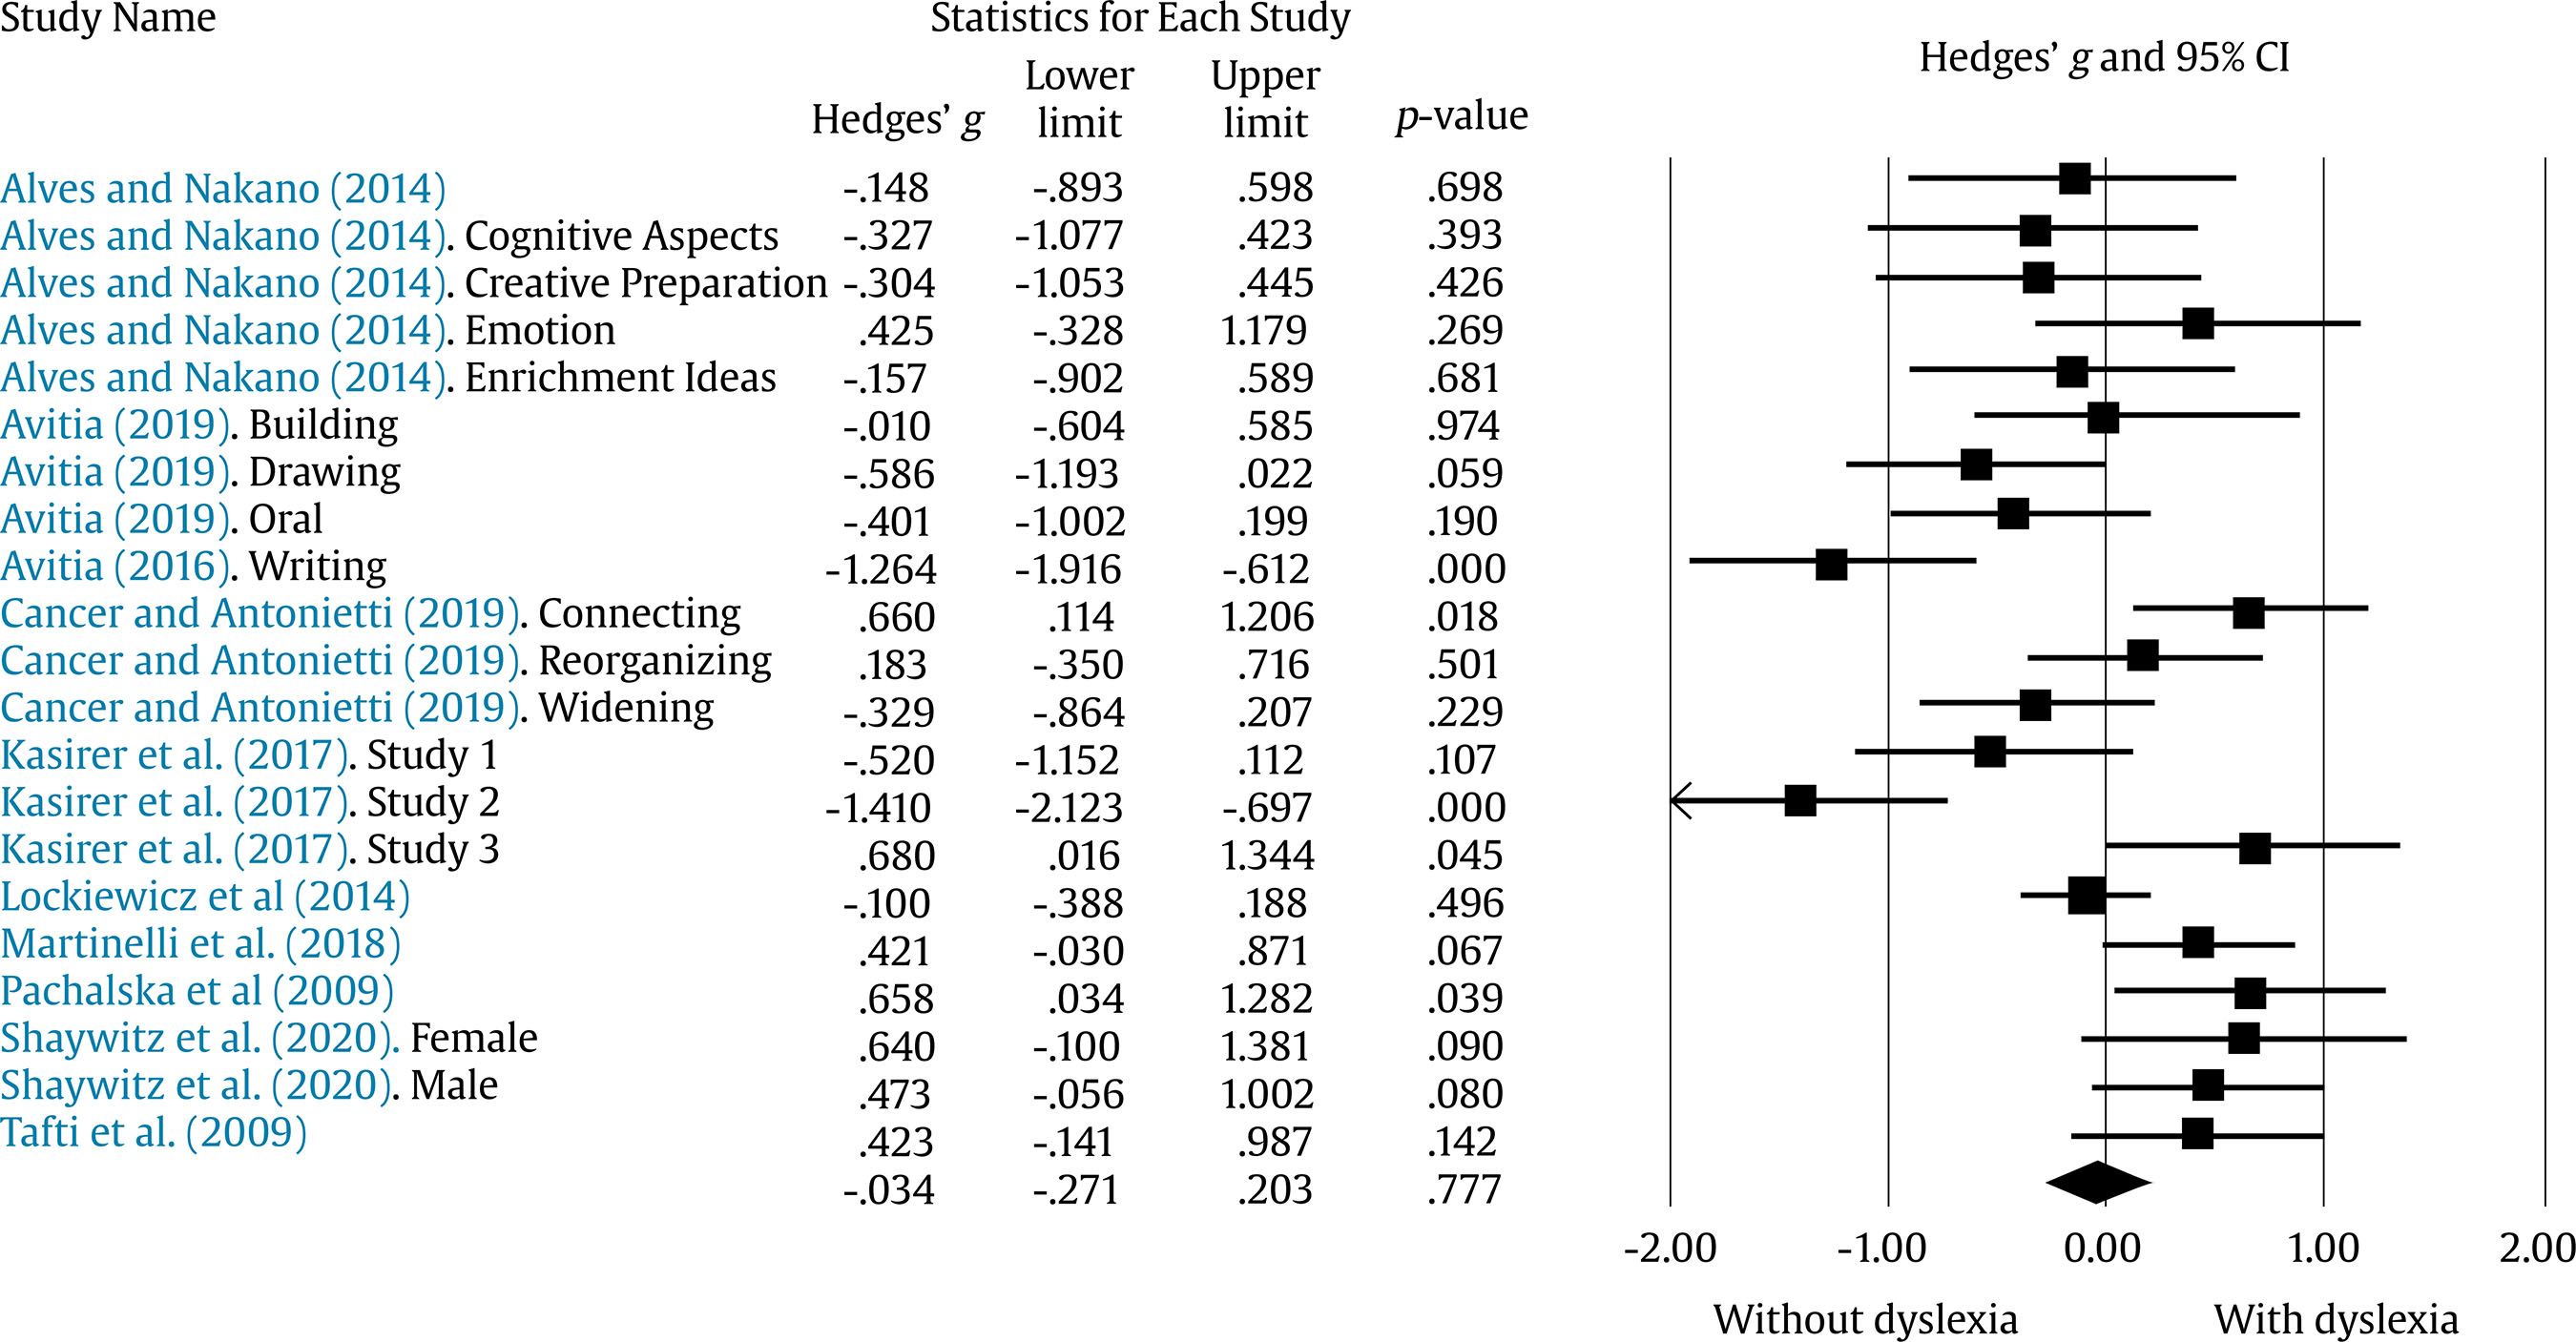 Creativity Categories Fluency. In 5 of the selected studies, we found data that specifically analyzed the fluency category. The mean effect size of the sample was significant (Hedges’ g = 0.27, 95% CI [-0.09, 0.45], k = 5, Z = 2.95, p = .00). The effect size did not show heterogeneity, Q(4) = 0.36, p < .01, I2 = 00.00 (see Figure 3). Figure 3 Forest Plot by Categories Linked to Divergent Thinking. 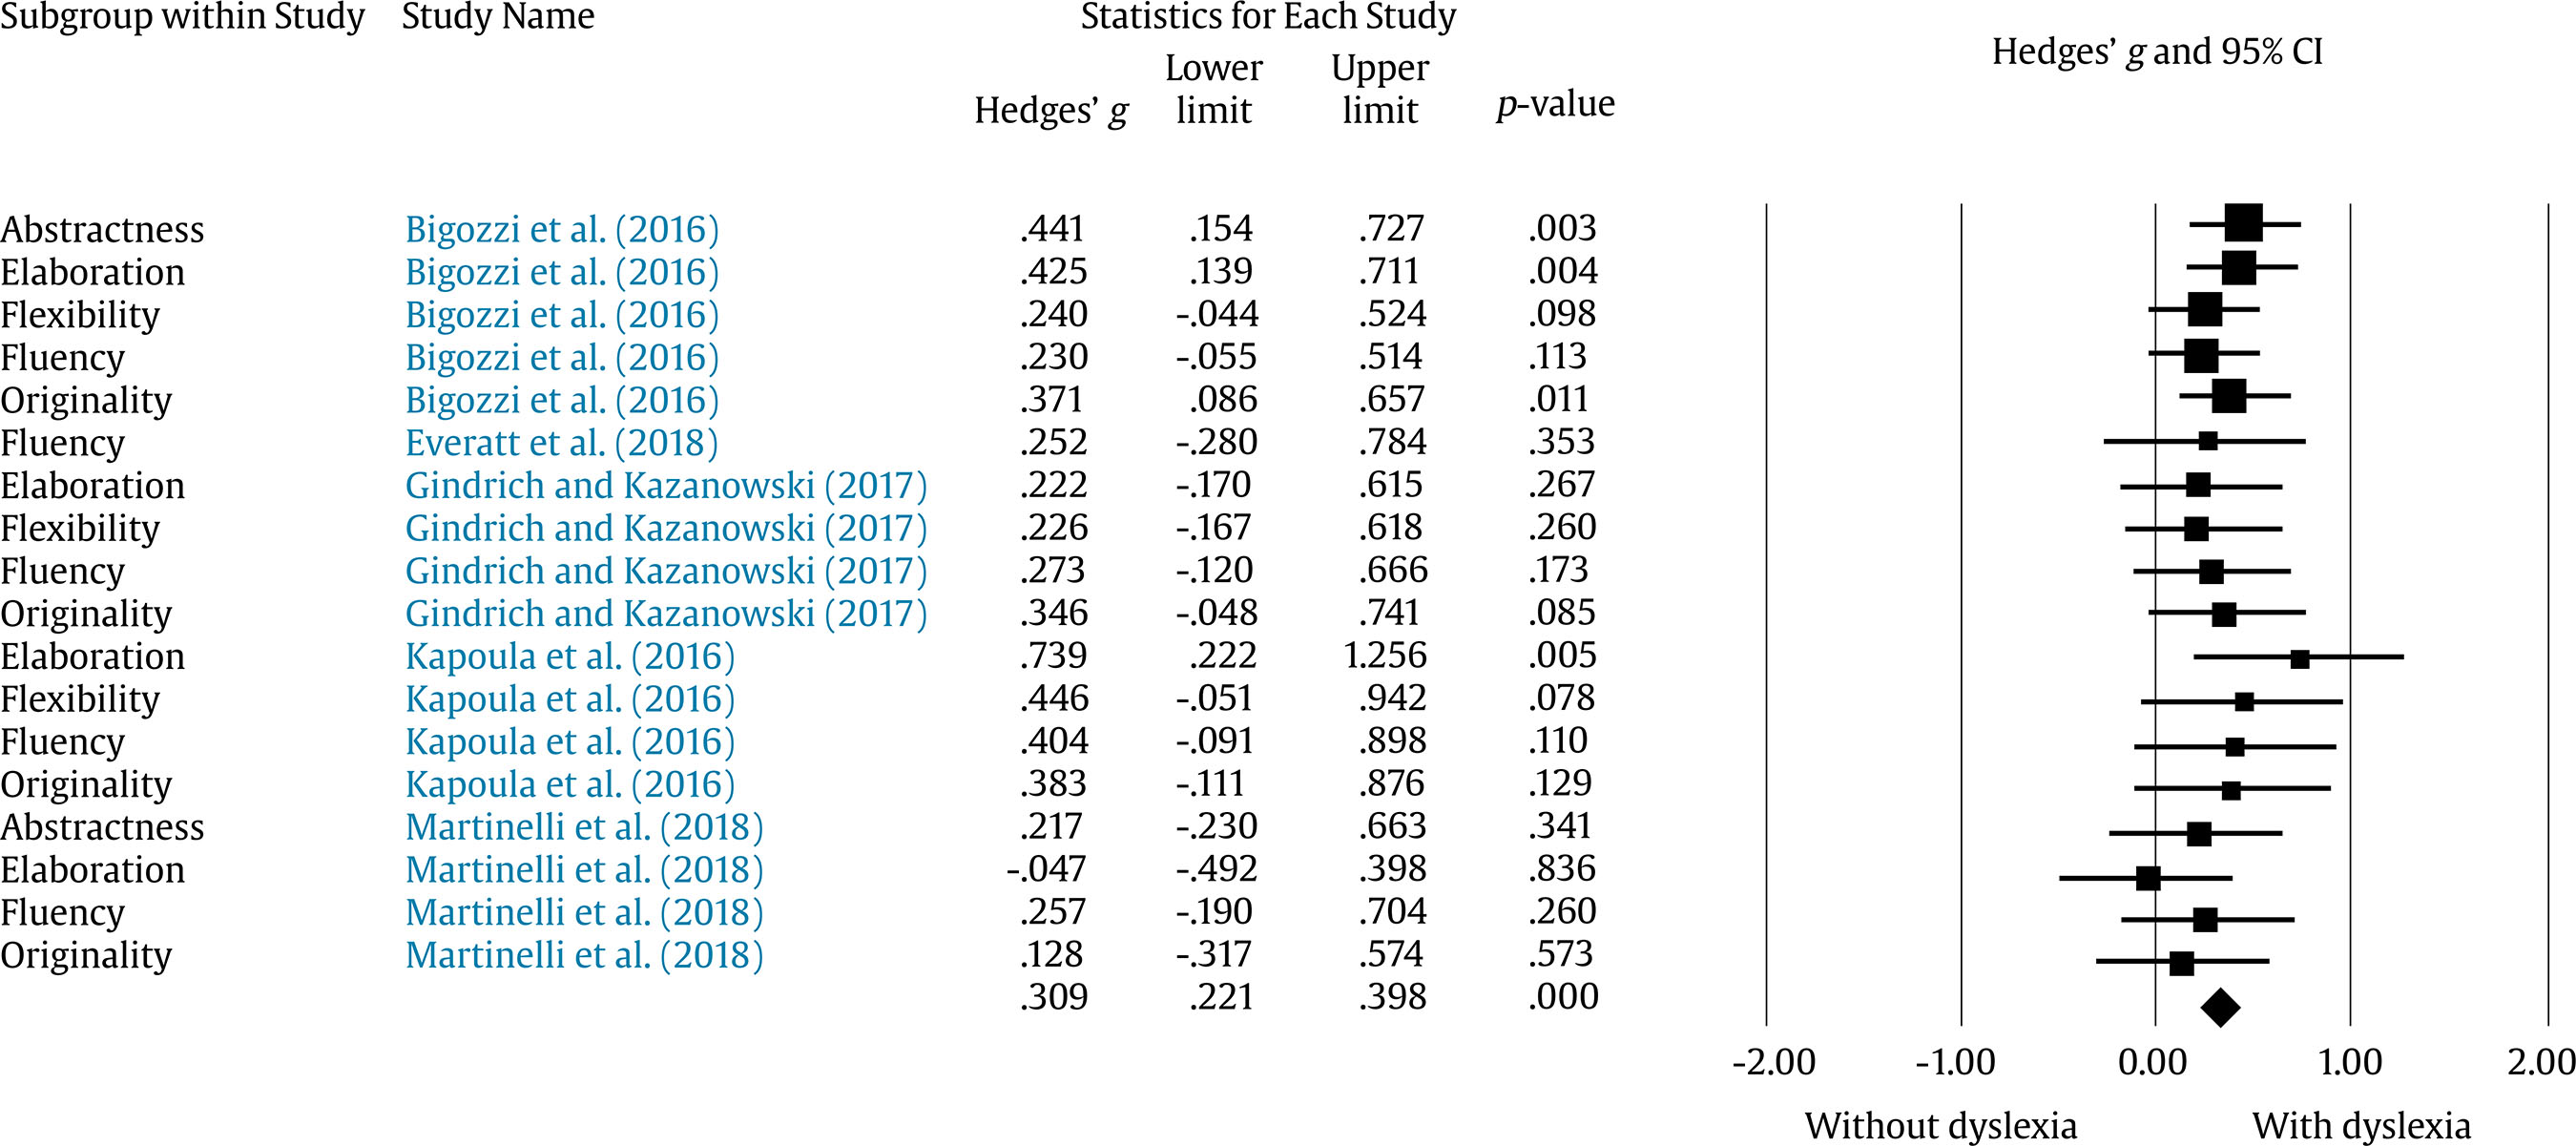 Originality. Four effect sizes offered information on originality. The results showed that people who have dyslexia score higher than those who do not (Hedges’ g = 0.32, 95% CI [0.13, 0.51], k = 4, Z = 3.34, p = .00). The effect size did not show heterogeneity, Q(3) = 0.91, p < .01, I2 = 00.00 (See Figure 3). Abstractness. Only two effect sizes provided information on the capacity of abstraction. The results indicated that people with dyslexia obtain higher results than people in the control group (Hedges’ g = 0.37, 95% CI [0.13, 0.61], k = 2, Z = 3.05, p = .00). The effect size did not present heterogeneity, Q(1) = 0.68, p < .01, I2 = 00.00 (see Figure 3). Elaboration. Out of the 39 effect sizes, 4 presented data on elaboration. The positive values indicate that the results obtained by people with dyslexia are higher than those obtained by people in the control group. The mean effect size of the sample was significant (Hedges’ g = 0.33, 95% CI [0.05, 0.60], k = 4, Z = 2.29 p = .02). The effect sizes did not show great heterogeneity, Q(3) = 5.87, p < .01, I2 = 48.86 see Figure 3). Flexibility. Three effects size provided information about flexibility, with a significant but low effect size (Hedges’ g = 0.28, 95% CI [-0.06, 0.48], k = 3, Z = 2.55 p = .01). The effect sizes were not very heterogeneous, Q(2) = 0.57, p < .01, I2 = 00.00 (see Figure 3). Moderator Analysis We also wished to examine the effect of several potential moderators of the effect size of the outcomes, specifically the effects of (a) the participant’s age, (b) the type of test used, and (c) the location of the study. First, we wanted to know whether the participants’ age significantly predicts the results of the effect size. For this purpose, participants’ age was grouped into two categories, children and adolescents for the age group of 5 to 17 years (Z = 0.18, p = .00), and adults for the range of 18 to 30 years (Z = 0.03, p = .69). No differences between the two age ranges were found. Secondly, we included the type of measurement of creative performance because the measures used in the studies vary. Therefore, the examination of the potential effects of the type of measurement could provide information on the possible influence of the instrument used in the studies. The results were classified into two categories: on the one hand, the Torrance Tests of Creative Thinking (TTCT) and, on the other, the rest of the instruments. The category of others includes measures such as the Child Figural Creativity Test (CFCT), the Consensual Assessment Technique (CAT), the Formal Elements Art Therapy Scale (FEATS), or the Widening Connecting Reorganizing Test (WCR). The use of the TTCT positively affects the results compared to the other tests used in the studies (Z = 1.99, p = .05). Finally, the demographic area where the study was carried out was analyzed to determine whether its variability influences the effect size. In this case, only the data for Europe were positive and significant (Z = 2.71, p = .01) which suggests that the data obtained in Europe are higher than those in North America. Effects of Publication Bias on the Studies and Sensitivity Analysis Publication bias was analyzed by visual inspection of the funnel plot graphs, in which no asymmetry was observed (Figure 4). Figure 4 Funnel Plot. 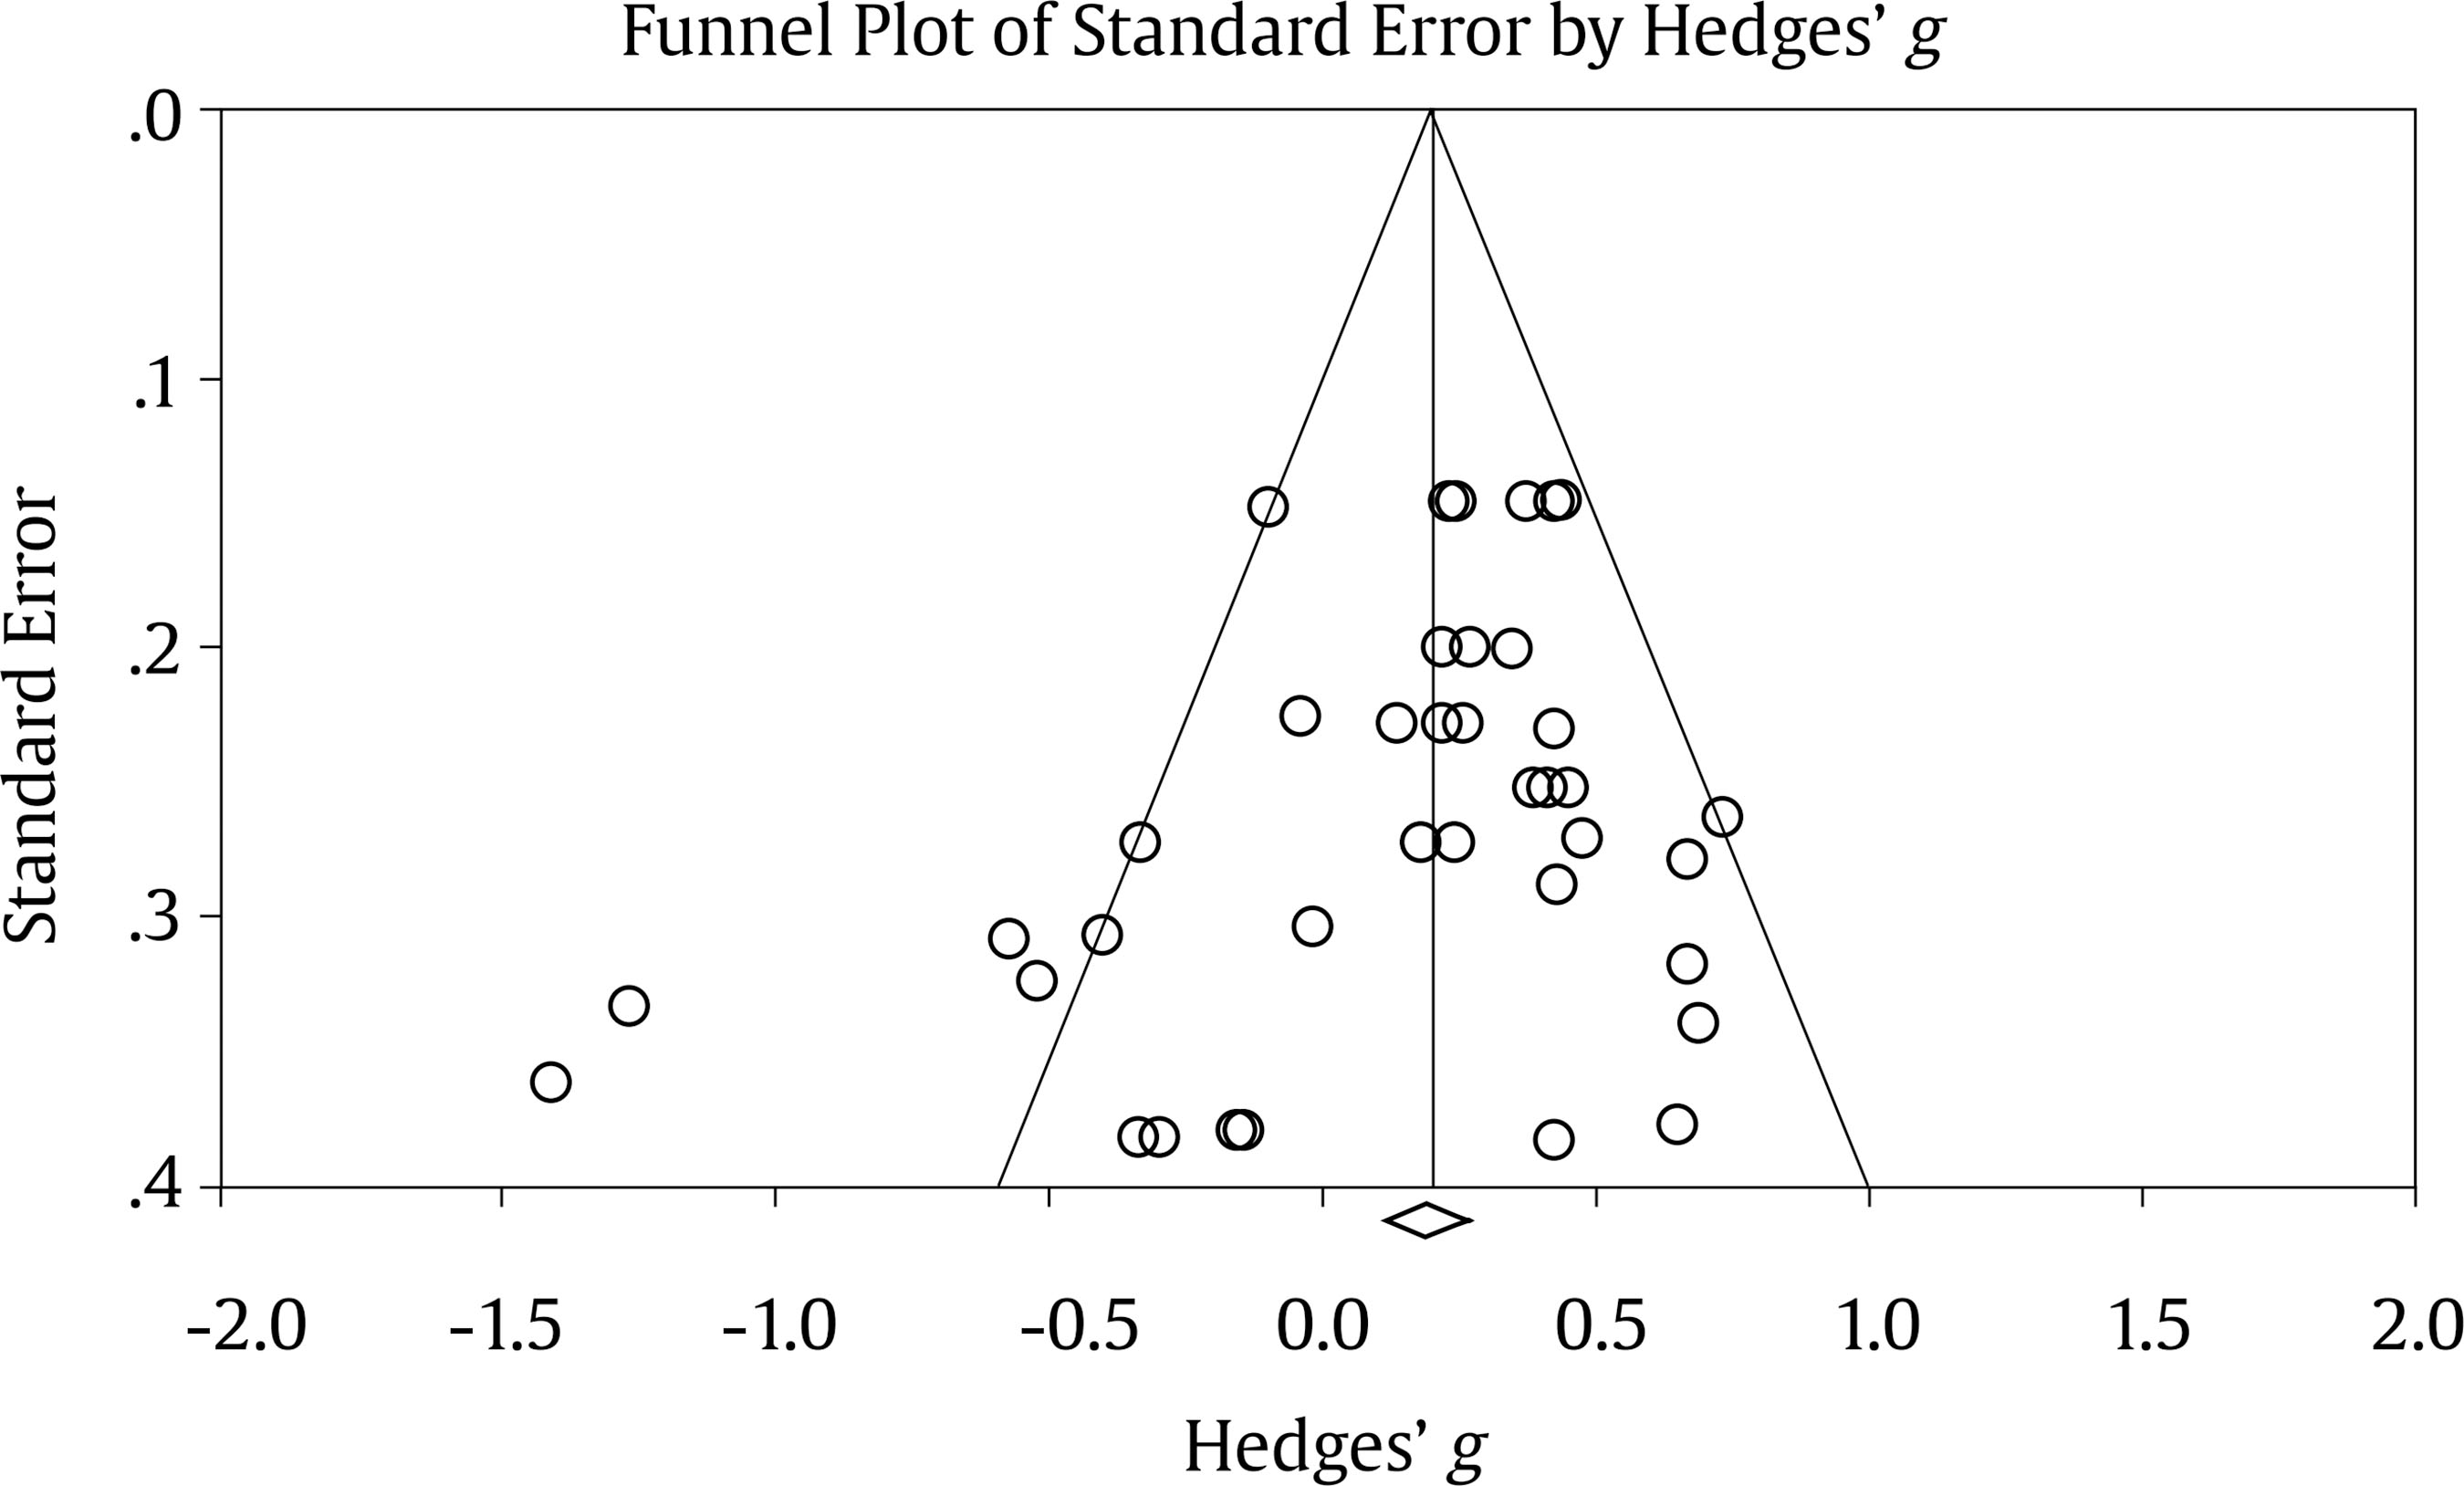 In order to determine whether the results of the meta-analysis could be affected by publication bias, we applied the Egger test (Sterne & Egger, 2005) on the effect size calculated on the global computation of all the outcome variables. Sensitivity analyses indicated that the size of the observed effect is robust, as the variation of the values of rho (ρ) did not produce differences. Egger’s funnel plot asymmetry test was significant, Z = -1.63, p < .05 (see Figure 4), suggesting some asymmetry in the estimates. The rho value of the regression commonly used to indicate the presence of bias is < .10. As noted in the introduction, despite the statement that people with dyslexia are more creative than people without dyslexia, the results in this regard are discrepant. To evaluate this statement and also to study the influence of other variables on creativity, the present meta-analysis was performed. The results indicate that when the relationship between creativity and dyslexia is analyzed without taking into account other factors the claim that people with dyslexia are more creative than people without dyslexia is confirmed. However, when analyzed considering the definition of the creativity construct, the results vary, showing that this statement is confirmed or disconfirmed depending on how creativity is defined. As described in the introduction, creativity can be defined in many ways and therefore assessed considering different aspects, which can lead to different outcomes when trying to compare studies. For this reason, in this paper we analyzed the relationship between dyslexia and creativity classifying the included studies into two blocks: a) the first block, in which creativity is understood as a “whole,” that is, as a global construct defined by the four approaches of process, product, context, and person, and which also includes other variables involved in the generation of ideas (e.g., widening, reorganizing, and connecting); b) the second block focuses on divergent thinking, whose commonly agreed categories are fluency, originality, abstractness, elaboration, and flexibility. The results obtained indicate that when creativity is considered as a “whole,” there are no significant differences in creativity between people with and without dyslexia, that is, the two groups score similarly on creative tasks. This result is in line with that of two recently published meta-analyses, which also analyze the validity of the affirmation of the relationship between dyslexia and creativity (Erbeli et al., 2021; Majeed et al., 2021). However, when analyzing the categories of divergent thinking separately in comparison with the results obtained when considering creativity as a global construct significant differences are found between people with and without dyslexia, that is, when we consider creativity as some category of divergent thinking (for example, creativity understood as fluency to generate ideas) people with dyslexia score higher in creativity than people without dyslexia. This result is observed for the categories of fluency, originality, abstractness, elaboration, and flexibility. This superiority in creativity tests can be explained by a more optimal profile of people with dyslexia in specific subprocesses or products related to originality and fluency (Cancer & Antonietti, 2019). It can also be explained by a greater global visual-spatial processing capacity, as some authors have defended (Karolyi et al., 2003). The fact that the statement that people with dyslexia are more creative than people without dyslexia is only confirmed when creativity is defined and evaluated from the perspective of divergent thinking and for each of the categories of divergent thinking shows the importance of divergent thinking within the construct of creativity. Perhaps this result is related to the fact that divergent thinking is the most frequent way of evaluating creativity, as well as the type of creativity most studied in the scientific literature (Plucker & Renzulli, 1999; Runco, 2007). Moreover, one of the instruments that evaluate the construct from the viewpoint of divergent thinking is the aforementioned TTCT, which has been translated into 35 languages (Kapoula & Vernet, 2016). The fact that creativity has been mostly explored from the viewpoint of divergent thinking implies that this type of measurement has been homogenized and standardized to a greater extent than other approaches, which can make the data more easily comparable. However, it is important to bear in mind that divergent thinking represents a limited space of total creativity, so it is essential to take into consideration at all times under which theoretical construct the construct of creativity is being evaluated—whether as problem-solving, divergent thinking, imagination, or remote associations, among other aspects—to better understand the results after evaluating samples of subjects, or when interpreting the different studies and their findings. Therefore, these results suggest that, given the complexity of the construct of creativity, one must take into account how to define and evaluate it when establishing its relationships with other factors. Regardless of how creativity is understood, and taking into account the included studies individually, there is great variability in the relationship between dyslexia and creativity between the different studies. At the methodological level, this manifests in a moderate heterogeneity between the studies. This heterogeneity, together with prior studies indicating the importance of the conditions in which creativity is evaluated (e.g., Plucker & Makel, 2010; Said-Metwaly et al., 2017), led to the analysis of possible moderators, that is, variables that could be influencing the relationship between dyslexia and creativity. For example, it has been pointed out that creativity can be expressed in different ways at each stage of the life cycle (González et al., 2019). In fact, it has recently been found that adults with dyslexia score higher in creativity than those without dyslexia, but not in other age ranges (Erbeli et al., 2021; Majeed et al., 2021). Another factor that can influence the results is the type of instrument used to evaluate creativity because, as mentioned, the type of instrument used is related to the definition of creativity on which the study is based, implying that the evaluation focuses on a certain aspect of creativity. Similarly, the geographical area of the study is also a condition to be taken into account (e.g., Niu & Sternberg, 2003). Thus, the analyzed moderators were age, the type of instrument used, and the geographical area of the study. Of these moderators, the type of instrument used and the geographical location where the study was conducted yielded significant results. Specifically, concerning the instrument used, it was observed that the TTCT had a positive influence compared to the rest of the instruments, that is, in the studies that used this instrument, a positive relationship between dyslexia and creativity was observed. In a meta-analysis carried out by Said-Metwaly et al. (2018), where they tested the factorial structure of the TTCT, they concluded that the test presents a two-factor model (innovation and adaptation) rather than a one-dimensional model of creativity. These two factors represent the categories of divergent thinking (fluency, originality, abstractness, need or resistance for premature closure, elaboration, and flexibility). This aligns with the results found in the present work, as the largest effect sizes are found when analyzing the categories of divergent thinking isolated. With regard to the geographical area, a significant and positive effect of Europe compared to other geographical areas was observed. As Majeed et al. (2021) pointed out, this could be explained by the different educational systems, and these may differ in the methodological approaches and in how creativity is addressed in the different countries (e.g., Niu & Sternberg, 2003). In addition to the possible influence on creativity of the educational systems, which take place in different contexts, it is important to consider how its assessment is perceived in the different cultures. Thus, for example, the pressure to obtain high scores, competitiveness, and the need for adaptation may differ depending on the context, culture, or country. Recently, Said-Metwaly et al. (2019) found an effect of context, educational level, and time limits on originality as a creative characteristic. Given these findings, the authors also considered that the pressure and the need for adaptation and acceptance could be a possible explanation for the differences found in the university context versus the pre-university context, with the latter context being associated with greater tension and demand. On the contrary, age does not act as a moderator, which differs from the result recently found both by Erbeli et al. (2021) and Majeed et al. (2021). This discrepancy can be explained by differences in the sample and the categorization of the variable age. For example, whereas Erbeli et al. classified age into three categories (children, adolescents, and adults), in the present study only two categories (children and adolescents, and adults) were used. However, the results have shown several limitations, so we should be cautious about extrapolating their interpretation and consider the descriptions as suggestions for future research. Firstly, these results are based on a small number of studies, which makes it difficult to generalize them. Secondly, there is a category of divergent thinking that was not included as it is not reported by the studies analyzed in the meta-analysis, which is “the need or resistance for premature closure.” Thirdly, with regard to age, there are no data above 30 years, which makes it difficult to study this variable as a moderator because, as mentioned, creativity varies in the different evolutionary phases. Finally, how the studies report the diagnosis of dyslexia and the subtype, without providing specific specifications, is also considered a limitation, which makes it difficult to analyze dyslexia and creativity more precisely because creativity can be mediated by different processes involved in dyslexia or by certain subtypes. In summary, the results of this meta-analysis indicate that the claim that people with dyslexia are more creative than people without dyslexia depends on how the construct of creativity is defined, which would explain the large discrepancy in the results found. Specifically, the results suggest that there is no relationship between dyslexia and creativity when considering creativity as a whole. However, a relationship between the two variables is observed when creativity is conceived of from the approach of divergent thinking and its categories, with people with dyslexia being more creative than people without dyslexia. On another hand, it is also found that the type of instrument and the geographical area where the studies are carried out influence this relationship. With these results, and taking into account the specified limitations, we can conclude that the claim that people with dyslexia are more creative than people without dyslexia may be partially true, but that it cannot be considered conclusive because of the methodological differences found in the studies that analyze this statement. Therefore, it is important for future research on the subject to define some key aspects to provide more conclusive results: 1) a more detailed description of the diagnostic profile of children with dyslexia; 2) the teaching methodology, describing how creativity is immersed in the curricular contents; 3) taking the approach to the construct of creativity into account, as well as the conditions in which creativity is evaluated (type of instrument used). Conflict of Interest The authors of this article declare no conflict of interest. Cite this article as: Gutiérrez-Ortega, M., Torres-Quesada, M., Crespo, P., López-Fernández, V., Fariña, N., & Barbón, A. (2023). Are dyslexic people more creative? Myth or reality: A meta-analysis. Psicología Educativa, 29(1), 55-64. https://doi.org/10.5093/psed2023a1 References |
Cite this article as: Gutiérrez-Ortega, M., Torres-Quesada, M., Crespo, P., López-Fernández, V., Fariña, N., & Barbón, A. (2023). Are Dyslexic People more Creative? Myth or Reality: A Meta-analysis. Psicolog├şa Educativa, 29(1), 55 - 64. https://doi.org/10.5093/psed2023a1
Correspondence: patricia.crespo@unir.net (P. Crespo).Copyright © 2026. Colegio Oficial de la Psicología de Madrid


 PDF
PDF e-PUB
e-PUB CrossRef
 JATS
JATS Imprimir
 Enviar
ALERTA POR E-MAIL
La Revista de Psicología Educativa está distribuida bajo una licencia de Creative Commons Reconocimiento-NoComercial-SinObra Derivada 4.0 Internacional.com