Psychometric Properties of the Revised Child Mathematics Anxiety Questionnaire (CMAQ-R) for Spanish Speaking Children
[Las propiedades psicométricas del cuestionario revisado de ansiedad matemática infantil (CMAQ-R) para niños de habla hispana]
Bárbara Guzmán1, Cristina Rodríguez1, 2, Roberto A. Ferreira3, and Juan A. Hernández-Cabrera2
1Universidad Católica de la SantÃsima Concepción, Chile; 2Universidad de la Laguna, Spain; 3Pontificia Universidad Católica de Chile, Chile
https://doi.org/10.5093/psed2020a17
Received 13 November 2019, Accepted 11 May 2020
Abstract
Mathematics anxiety (MA) has primarily been studied in adults and children over 8 years of age in English-speaking countries. Few studies have examined MA in younger children and in Spanish-speaking contexts due to the lack of suitable instruments. In the present study we examine the psychometric properties of the Child Mathematics Anxiety Questionnaire (CMAQ-R), an instrument widely used in English-speaking primary school children. A total of 810 Chilean second-grade students (50% boys) from different school types (26% public, 11% private, 63% private-subsidised) completed a Spanish version of CMAQ-R. The results showed adequate internal consistency in line with the original instrument. Confirmatory factor analyses showed that scores from the CMAQ-R version best fit a two correlated-factor structure, which was invariant across gender and school type. This study offers evidence regarding the usefulness of the CMAQ-R in contexts culturally different to the original and supports the multidimensionality of MA.
Resumen
La ansiedad matemática (AM) se ha medido principalmente en adultos y niños mayores de 8 años en países anglófonos. Debido a la dificultad de encontrar instrumentos apropiados, pocos estudios han examinado la AM en niños menores y en contextos hispanoparlantes. En el presente estudio, examinamos las propiedades psicométricas del Cuestionario de Ansiedad Matemática (CMAQ-R), un instrumento ampliamente utilizado en la evaluación de AM en niños de escuela primaria de habla inglesa. Un total de 810 estudiantes chilenos de segundo grado (50% niños) de diferentes tipos de escuela (26% pública, 11% privada, 63% subsidiada) completaron una versión en español de CMAQ-R. Los resultados mostraron una adecuada consistencia interna, al igual que el instrumento original. Los análisis factoriales confirmatorios mostraron que las puntuaciones de la versión traducida de CMAQ-R se ajustan mejor a una estructura de dos factores correlacionados, que es invariante por género y tipo de escuela. Este estudio proporciona evidencia sobre la utilidad de CMAQ-R en contextos culturales diferentes y respalda la multidimensionalidad de AM.
Palabras clave
Ansiedad matemática, Matemáticas, Niños de habla hispana, Escala de valoración, EmociónKeywords
Math anxiety, Mathematics, Spanish-speaking children, Rating scale, EmotionCite this article as: Guzmán, B., Rodríguez, C., Ferreira, R. A., and Hernández-Cabrera, J. A. (2021). Psychometric Properties of the Revised Child Mathematics Anxiety Questionnaire (CMAQ-R) for Spanish Speaking Children. PsicologÃa Educativa, 27(2), 115 - 122. https://doi.org/10.5093/psed2020a17
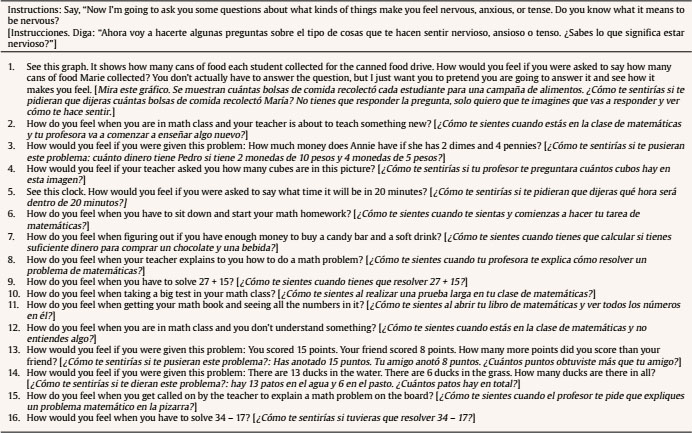
crodri@ull.es Correspondence: crodri@ull.es (C. RodrÃguez)There is a close association between emotional variables and academic achievement. In particular, evidence suggests that mathematics anxiety (MA), defined as a state of tension or a negative emotional response to numerical, arithmetic and/or problematic situations (Ashcraft & Faust, 1994; Dowker et al., 2016; Suárez-Pellicioni et al., 2016), is probably one of the most important emotional variables given its negative association with achievement in mathematics (Maloney & Beilock, 2012). There is considerable evidence that people with MA present cognitive overload when carrying out numerical and arithmetic tasks, leading to poorer performance in these activities (Cargnelutti et al., 2017; Hill et al., 2016; Ramirez et al., 2016). In fact, the results of the PISA 2012 report (Organisation for Economic Co-operation and Development [OECD, 2013]) show that levels of MA explain 14% of variation in mathematics performance. It is a worrying fact that a large section of the world’s population presents some degree of MA (e.g., Ganley & McGraw, 2016; OECD, 2013; Ramirez et al., 2016) and that a global increase in average levels of MA has been observed in recent years (OECD, 2013). For example, in the United Kingdom, results obtained by Johnston-Wilder et al. (2014) show that approximately 48% of adolescents present signs of MA. Ganley and McGraw (2016) suggest that 33.1% of first grade students in the USA present high levels of MA. The figures reported vary considerably between countries, suggesting the relevance of cultural differences MA evaluation, as well as the need for measures adapted to and validated in the particular student context. MA results from the PISA 2012 report indicate that participating countries, particularly Latin American countries, are among those with the highest levels of MA and the poorest performance in mathematics (OECD, 2013). The report ranks Chile among the ten countries with the highest instances of MA. In a nationwide study, more than half of Chilean students – evaluated at all levels of schooling – reported feelings of apprehension at the prospect of numerical tasks at school: 52% in fourth grade, 56% in eighth grade, and 56% in tenth grade (Ministerio de Educación [MINEDUC, 2016]). Despite these figures, to the best of our knowledge no validated instruments exist for the early measurement of MA in Latin America’s population. In general, measurement of MA has been achieved using self-descriptive techniques based on ordinal measures (Dowker et al., 2016). Over the past decade, in addition to scales used for MA measurement in adults, scales applicable to children have also been developed and adapted in countries such as the USA (e.g., Carey et al., 2017), Italy (e.g., Caviola et al., 2017), and the UK (e.g., Zirk-Sadowski et al., 2014). However, the majority of these scales are aimed at children over 8 years of age, and scales suitable for measurement of MA at earlier stages, and indeed within the Spanish-speaking context are scarce. Today, only seven scales exist for children under 8 years of age: the Scale for Early Mathematics Anxiety (SEMA; Wu et al., 2012), the Child Math Anxiety Questionnaire and its revised version (CMAQ; Ramirez et al., 2013; CMAQ-R; Ramirez et al., 2016), the Mathematics Anxiety Scale for Young Children and its revised version (MASYC; Harari et al., 2013; MASYC-R; Ganley & McGraw, 2016), the Children’s Anxiety in Math Scale (CAMS; Jameson, 2013), the Math Anxiety Questionnaire (MAQ; Thomas & Dowker, 2000), and the Children’s Mathematics Anxiety Scale UK (CMAS-UK; Petronzi et al., 2019). The existence of a multidimensional structure identical to that of studies for adults has been confirmed for some of them (Ganley & McGraw, 2016; Harari et al., 2013). Harari et al. (2013) found three dimensions for the MASYC scale, designed for first-grade children: negative reactions, worry, and numerical confidence. The first two are linked to physical manifestations and states of excessive restlessness in numerical situations, while the third may be associated primarily with an attitudinal construct rather than an emotional one (Ganley & McGraw, 2016). In fact, some of the items of this dimension are proposed based on positive concepts that are relatively opposed to MA, such as interest (e.g., “I like to raise my hand in mathematics class”). Jameson (2013) also confirmed the multidimensional nature of MA in his study of the CAMS scale, designed for first- to fifth-grade students, identifying three dimensions: general mathematics anxiety, mathematics performance anxiety, and mathematics error anxiety. Similarly, in an exploratory factor analysis of the SEMA scale designed for first- and second-grade children, Wu et al. (2012) identified a two-factor structure: numerical processing anxiety and situational and performance anxiety. Evidence regarding the suitability of the psychometric characteristics of the scales designed for children under 8 years of age is limited, despite their use in a number of studies. The majority of studies in which these scales have been applied used small samples, and in only a few of them was the internal structure confirmed. This is the case of the Child Mathematics Anxiety Questionnaire-Revised CMAQ-R (Ramirez et al., 2016), one of the most widely used measures of MA over the past four years according to the literature (e.g., Gunderson et al., 2018; Van Mier et al., 2019). This scale, based on the MARS-E questionnaire (Suinn et al., 1988), has reported a good level of reliability, but the multidimensionality of its internal structure has not been examined by any studies to date. CMAQ-R uses vocabulary that is understandable by first- and second-grade children and its pictographic scale representing an emotional gradient is consistent with estimations of emotional magnitudes of which children in this age group are capable (Holmes & Lourenco, 2011). This makes the scale more accessible and allows more precise measurement of MA levels than may be achieved using a numerical scale (DeLoache, 2000). Furthermore, its questions are formulated to avoid posterior reverse scores. In other words, CMAQ-R is an ideal scale for use with small children, pending validation. The aim of the present study was to examine the psychometric properties of the adapted Spanish version of the scale for use with Chilean second-grade children. To do so, its construct validity, reliability, and internal structure were analysed (Flake et al., 2017). Once the CMAQ-R structure most suitable to Chilean context had been defined, a second aim was to verify the invariance of the instrument according to gender and school type. Participants Participants were 810 Chilean second-grade students (50% boys; age, M =77.96 months, SD = 4.85) from 21 public, private, and private-subsidised schools. The empirical distribution of school types reflected the statistics reported by the Chilean Ministry of Education (MINEDUC, 2016), χ2(2) = 4.15, p =.13 (see Table 1 for descriptive statistics). Table 1 Demographic Information of Participants 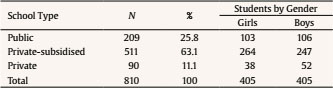 Materials Mathematics anxiety. The Child Mathematics Anxiety Questionnaire-Revised (CMAQ-R; Ramirez et al., 2016) is applied on an individual basis to first- and second-grade children and is a revised version of the Child Mathematics Anxiety Questionnaire (CMAQ; Ramirez et al., 2013). The questionnaire was translated and adapted to Chilean Spanish in readiness for application by the present study (see Translation and adaptation section below). It covers 16 situations relating to mathematics, including specific mathematical problems and mathematical situations in the classroom. Using a scale of five faces that express an emotional range from no anxiety to very, very anxious, the children were required to indicate the face which expresses the level of anxiety that they feel in each of the proposed situations. The original scale has been treated unidimensionally and the total mathematics anxiety score is calculated based on the total responses of each item in a range of 16 to 80 points. The original CMAQ-R has high internal consistency, and a Chronbach’s alpha of .83 has been reported (Ramirez et al., 2016). Translation and adaptation to Spanish, CMAQ-R. CMAQ-R was translated to Spanish in accordance with the procedures generally recommended for adaptation of tests (Muñiz et al., 2013; Tassé & Craig, 1999). Two of the authors involved in the present study translated the original scale into Spanish, and a bilingual translator subsequently reverse translated it. Discrepancies between the translations were discussed by two experts (researchers and university teachers). All of the comments were analysed and discussed by the authors, and two context-related modifications were made. The literal translation of the word “cans” [latas] was changed to bolsas [bags] in reference to the food in item 1, and references to centavos were changed to pesos in item 3 (see Appendix for details of the translation and adaptation). Procedure The present study was approved by the Ethics Committee of Universidad Católica de la Santísima Concepción, Chile. The parents or guardians of participants were required to sign consent forms prior to the evaluation, and the permission of the children was also obtained. In order to ensure anonymity during data processing, a numerical code was assigned to each participant. The evaluation was conducted on an individual basis in a quiet room free of distractions by examiners who received training beforehand. The instructions were read aloud, and then to ensure children’s understanding of the pictographic scale, they were presented with a practice problem covering a subject unconnected to those simulated during the study (e.g., “How anxious do you feel when you look down from the top floor of a building?”). The children were asked to use their index finger to select the face that best expressed their level of anxiety. The same procedure was used for all items. In the event that participants had questions or failed to understand an item, they were free to consult with the examiners. Application of the questionnaire took place during June, halfway through the school year, and lasted approximately 15 minutes. Data Analysis The data were analysed using R version 3.3.5 (R Core Team, 2017), the Lavaan package (Rosseel, 2012), and the syntax described by ULLRToolbox (Hernández & Betancort, 2018). In order to determine the factor structure of the CMAQ-R scale, two confirmatory factor analyses (CFA) were conducted. The first CFA (Model 1) examined the fit obtained for a unidimensional model representing all problematic situations associated with mathematics anxiety (MA), as has been done in previous studies (e.g., Gunderson et al., 2018; Maloney et al., 2015; Ramirez et al., 2016; Van Mier et al., 2019). The second CFA (Model 2) included two global factors: “mathematics anxiety towards explicit numerical situations” (ENS) and “mathematics anxiety towards general classroom situations” (GCS). The definition of factors was based on the review conducted by Haase et al. (2019), who indicate that two dimensions may be observed in the measurement structure: attitudes about problem-solving and specific situations. Assignment of items to each factor was based on the description of the measure reported by previous studies which indicate that some items refer to feelings of nervousness regarding solving particular mathematical problems, while others refer to nervousness towards more general situations experienced in the mathematics classroom (e.g., Gunderson et al., 2018; Maloney et al., 2015; Ramirez et al., 2016; Van Mier et al., 2019). As such, 9 items were assigned to factor ENS, referring to solving explicit mathematical problems, and 7 items were assigned to factor GCS, referring to general problems in the mathematics classroom. Estimation was done using the robust weighted least squares (WLSMV) method recommended for the modelling of ordinal variables, including in cases where the assumption of normality of the data is not met (Abad et al., 2011). The goodness of fit of the models was assessed by means of the standardised root mean square residual (SRMR), the root mean square error of approximation (RMSEA, CI 90%), the comparative fit index (CFI), and the Tucker-Lewis index (TLI). In order to achieve a good fit, the following criteria were considered for each of the indices: RMSEA (≤ .06), SRMR (≤ .08), CFI (≥ .95), TLI (≥ .95) (Brown, 2015; Hu & Bentler, 1999), with a χ2/df relationship less than 2 (Kline, 2016). In order to statistically compare the unidimensional model and the correlated two-factor model, we used the χ2 difference test. The reliability of CMAQ-R was assessed using coefficient omega (McDonald, 1999). While Cronbach’s alpha is one of the most widely used coefficients in the literature, it does have some limitations. For instance, it assumes that data are continuous (Gadermann et al., 2012) and it is dependent upon the number of items and their normal distributions (Taber, 2018). In addition, test items need to meet the assumption of the tau-equivalent model, which further implies equal factor loadings for each item in each factor (Cho, 2016; Teo & Fan, 2013). When the above assumptions are not met, estimation of reliability using Cronbach’s alpha is not accurate. In such cases, coefficient omega is more appropriate for assessment of reliability because it is calculated directly using the parameter estimates from the CFA, displaying much greater stability when dealing with non-continuous data (Dunn et al., 2014; Gadermann et al., 2012). Finally, to test whether the factor structure found was similar between girls and boys and between schools (public, private, private-subsidised), multi-group CFAs were used to test the configural invariance. The test for configural invariance shows whether the same items are associated with the same construct. If fit indices are within the range of acceptable values, the configural model is considered invariant. When the configural invariance model is supported, metric invariance can be tested. This is achieved by constraining the factor loadings of similar items to be equal across the different groups. To determine the metric invariance of groups, a Δχ2 test was conducted (Sass, 2011). If the metric model does not differ from the configural model, metric invariance is inferred. Descriptive Statistics and Correlations Prior to CFA, descriptive statistics were calculated for the items (median for central tendency and frequencies for variability). The descriptive statistics for each CMAQ-R item are presented in Table 2. Table 2 Descriptive Statistics of the CMAQ-R 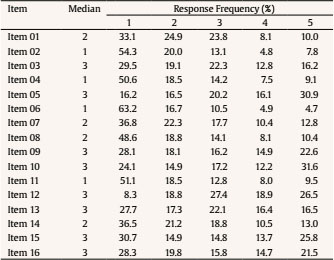 Note. Some rows may not add to 100% due to rounding. Items scores ranging from 1 (no anxiety) to 5 (very, very anxious) The correlation analysis of the items was performed based on a polychoric correlation matrix. Current suggestions indicate that the polychoric correlation coefficient is more appropriate than Pearson’s for estimating the relationship between the items of a Likert scale (Martínez-Abad & Rodríguez-Conde, 2017). Results showed positive and statistically significant correlations between items. Table 3 present the correlations between the items and the corrected item-total correlations. The results showed adequate correlations across all items of the CMAQ-R scale within each of its dimensions. Table 3 Polychoric Correlation Matrix of the CMAQ-R and Corrected Item-Total Correlations 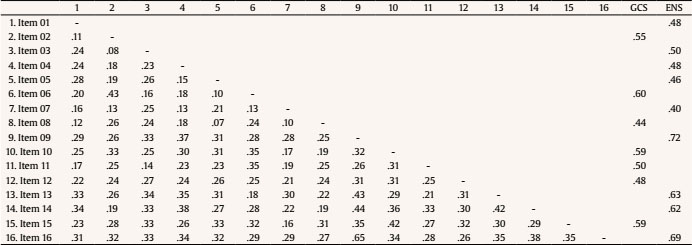 Note. GCS factor = mathematics anxiety; ENS factor = mathematics anxiety towards explicit numerical situations Reliability The results indicated acceptable internal consistency reliability for both the GCS (ω = .76) and ENS factors (ω = .70). Similarly, composite reliability values for GCS (CR = .75) and ENS (CR = .80), as well as average variance extracted for GCS (AVE = .30) and ENS (AVE = .31), suggest good model reliability (Hair et al., 2010). CMAQ-R Factor Structure Two confirmatory models were tested for CMAQ-R: the unidimensional model and the correlated two-factor model (see Table 4). For both models, correlations between error terms for items 9 and 16 were allowed. This specification assumes that the two indicators are linked in part by the shared influence of the ENS factor, but part of their covariance is due also to different sources of the common factor, which in this case is explained by the similar wording of the two items (¿Cómo te sientes cuando tienes que resolver 27 + 15?/¿Cómo te sentirías si tuvieras que resolver 34 - 17?) (Brown, 2015). Table 4 Model Comparison: Summary of Goodness-of-Fit Statistics  A comparison between the unidimensional model and the correlated two-factor model revealed a significant difference, Δχ2(1) = 68.384, p < .000. The latter presented a significantly better fit for the data than the unidimensional model and, as such, is considered the best of the two. Figure 1 shows the best fitting model and the standardised trajectory coefficients for each observed variable. All of the item loadings were found to be at an acceptable level (≥ .39) and all of the parameter estimates were significantly different to 0. The latent correlation index between the model factors was r = .80. Figure 1 CMAQ-R Factor Solution Model 2. 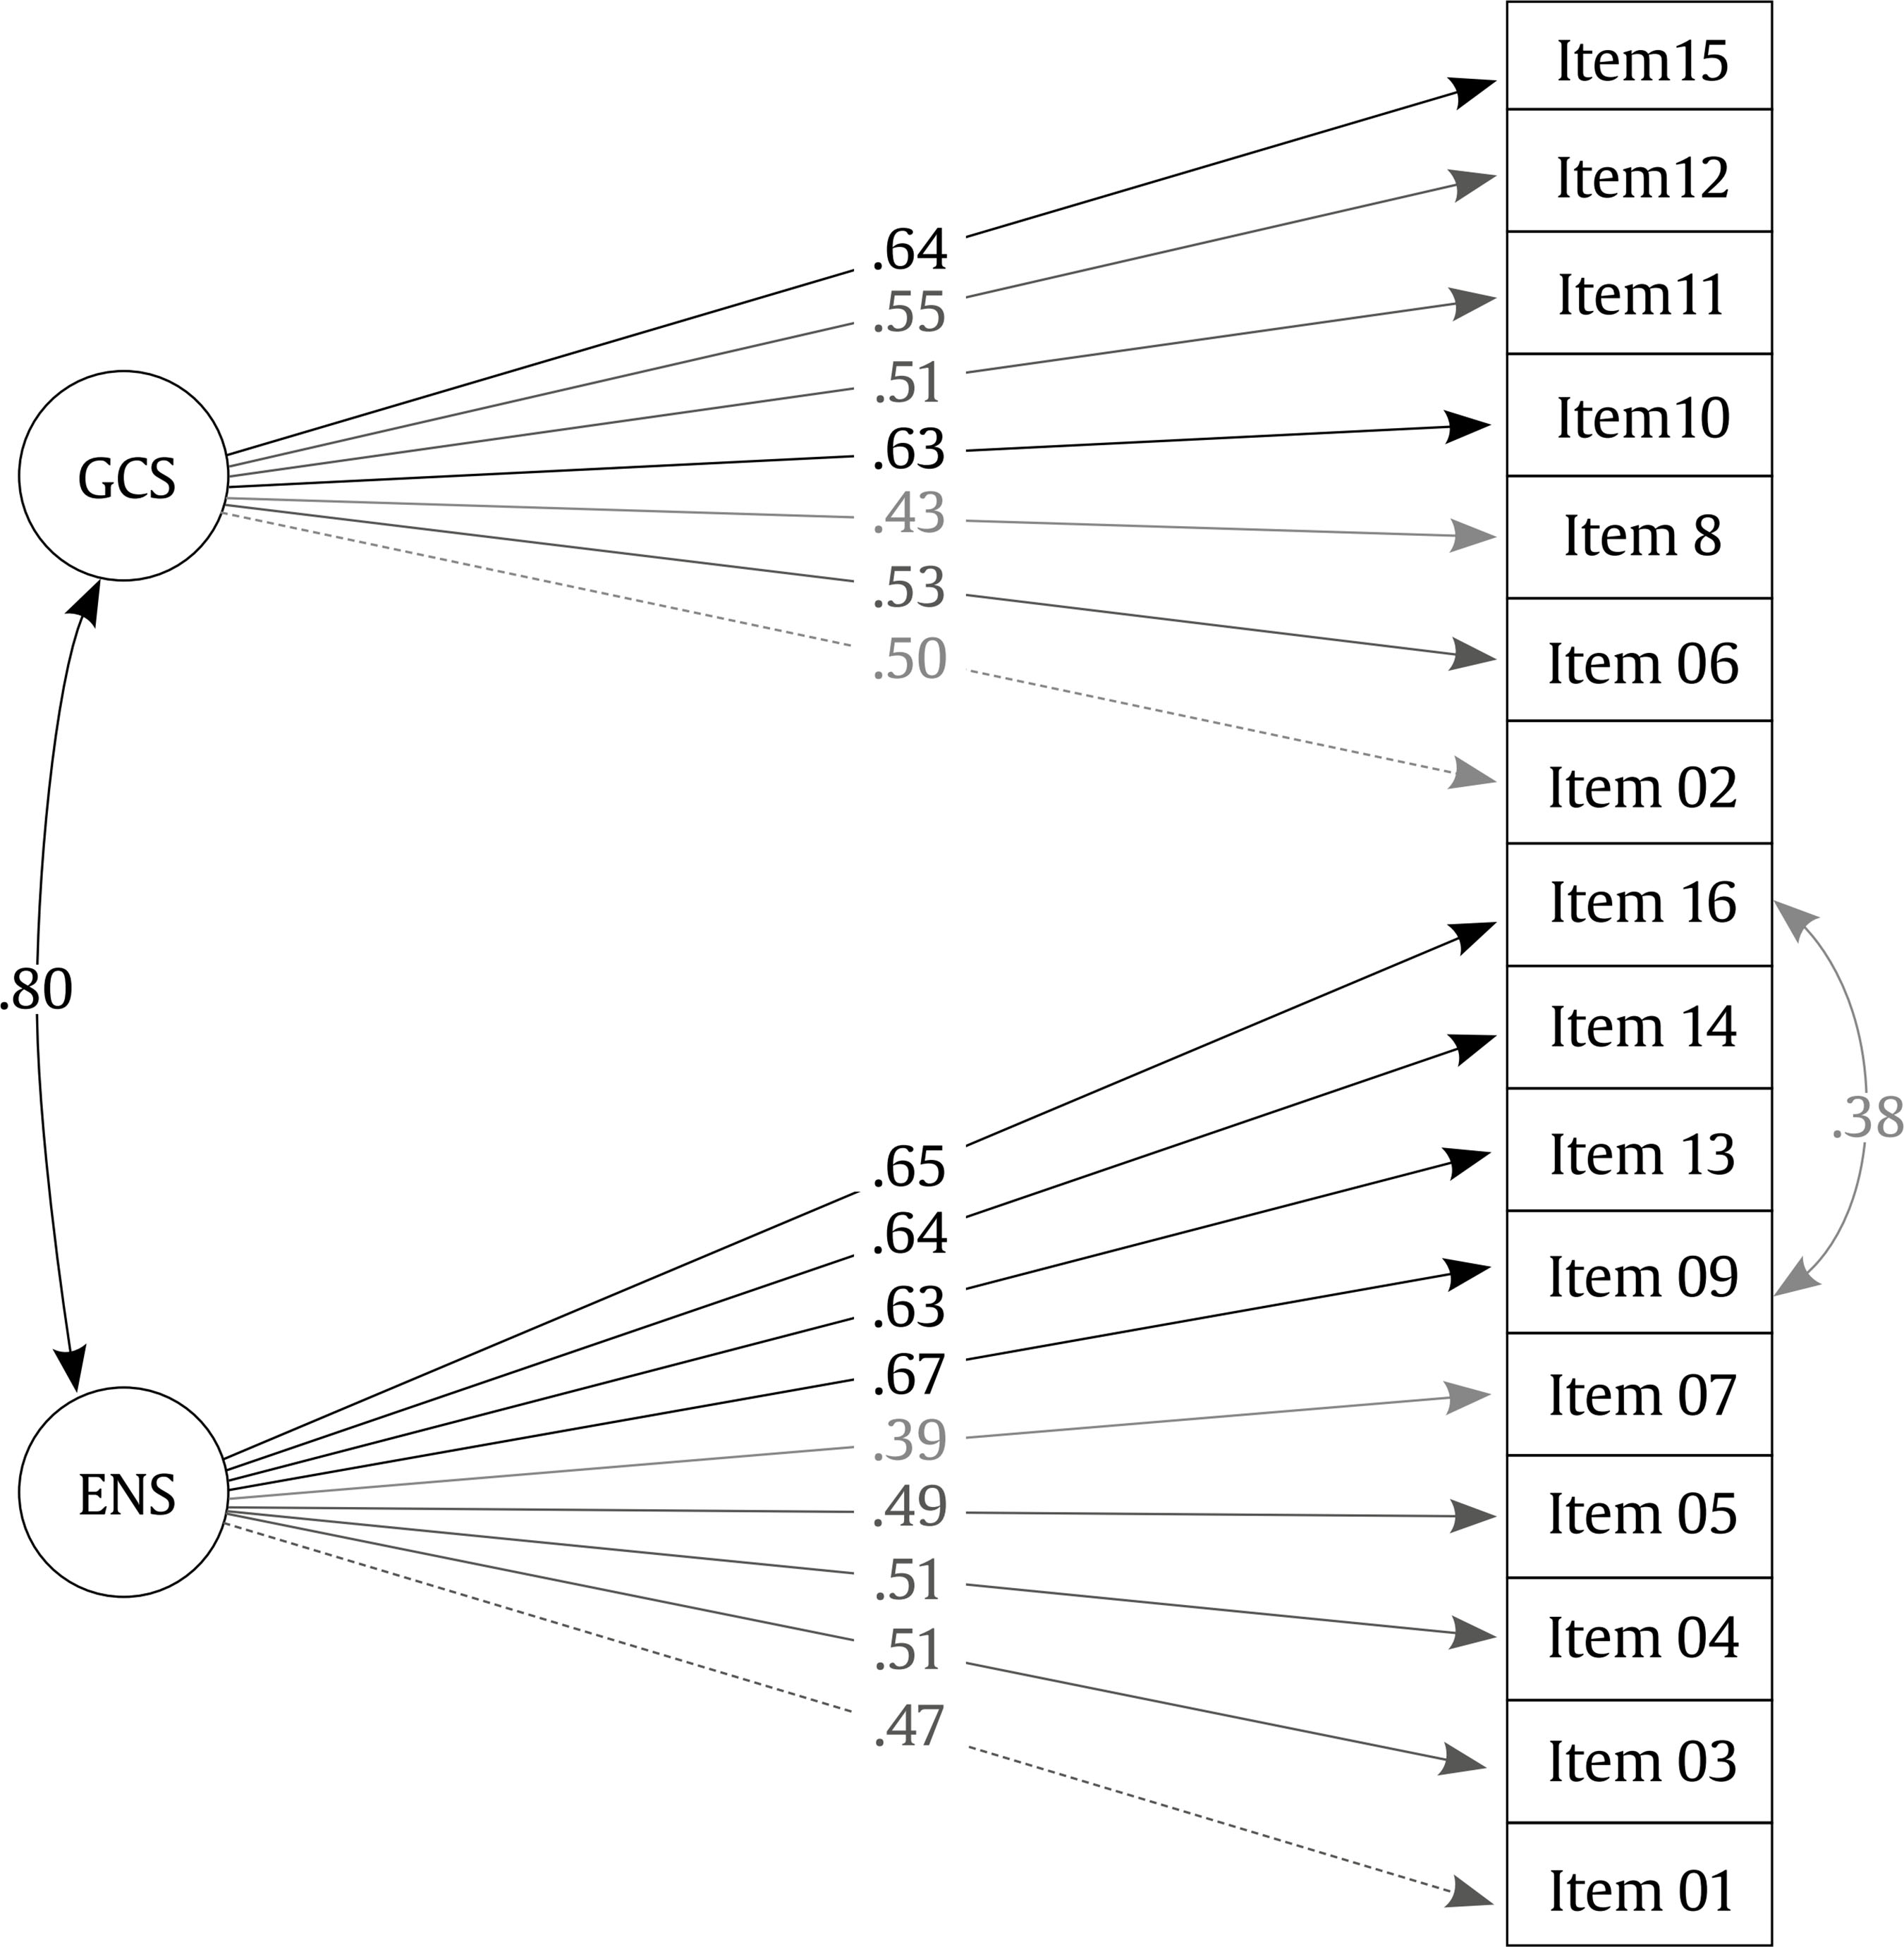 Invariance of CMAQ-R Factor Structure Multi-group confirmatory factor analysis. To test whether the factor structure was similar across gender and school type (configural invariance test), parameters were estimated simultaneously for each level of gender (boys, girls) and school type (public, private, private-subsidised). Fit indices of the multi-group CFA by gender and school type were acceptable (see Table 5). It can therefore be concluded that both the number of factors and the factor loading pattern of CMAQ-R scale’s items are similar across gender and school type. Table 5 Test for Invariance of CMAQ-R 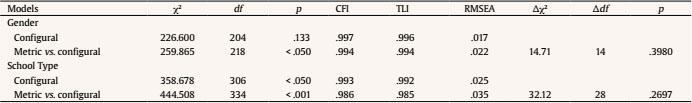 With regard to metric invariance (whether factor loadings are the same for all groups), the fit indices were acceptable across gender and school type (see Table 5). The results show that there were no differences in fit indices between the configural model and the metric model for gender (Δχ2 = 14.71, Δdf = 14, p = .398) and school type (Δχ2 = 32.12, Δdf = 28, p = .269). As such, there was also support for metric invariance for both gender and school type. The aim of the present study was to examine the psychometric properties of the CMAQ-R scale in the Chilean child population. Two theoretical structural models were identified. The first model was based on the unidimensional treatment of the scale used in previous studies (e.g., Gunderson et al., 2018; Maloney et al., 2015; Ramirez et al., 2016; Van Mier et al., 2019). In the second model, an internal two-dimensional structure was tested (mathematics anxiety towards explicit numerical situations and mathematics anxiety towards general situations) and found to be in line with current theoretical reviews and with the description proposed by studies that have used the scale (Gunderson et al., 2018; Haase et al., 2019; Van Mier et al., 2019). In terms of reliability, the results indicate an adequate internal consistency of the general scale, in line with the original study (Ramirez et al., 2016). This shows that modifications made during the translation of CMAQ-R and its application in a new context do not affect the internal consistency of the scale. With regard to the internal structure, findings show that the two structural models presented adequate fit indices; however, the two-factor model offered the best fit for the data. These findings suggest that the CMAQ-R scale may be conceived as two subscales, an approach that has not been considered by previous studies (e.g., Gunderson et al., 2018; Ramirez et al., 2015; Van Mier et al., 2019). To date, the instrument has been used unidimensionally in terms of the total or average score derived from the general scale, with no consideration given to the relative weight of each item. As such, use of the measure has been limited to the identification of a general level of MA and has not addressed different identifiable elements which could usefully become the subject of intervention. The fact that two factors were found by the present work enables us to better identify those situations which trigger anxiety in a subject and thus to intervene more effectively in levels of anxiety in children; this is not possible when only MA level is reported. As mentioned previously, the CMAQ-R scale is based on the MARS-E questionnaire (Suinn et al., 1988) and also has a two-factor structure. CMAQ-R is therefore a suitable measure of MA in children entering formal education, being aimed at an age range that is not covered by MARS-E. Furthermore, girls do not differ from girls in CMAQ-R scale, and this is important given significant gender differences in MA levels reported by a number of studies (e.g., Devine et al., 2012; Stoet et al., 2016). The scale is also invariant across school type, which is relevant, given that school type and socio-economic status (SES) are almost interchangeable in Chile (Ortiz, 2015), and because SES has been found to influence MA (Adimora et al., 2015; Geyik, 2015). Identification of two CMAQ-R factors for second-grade children is in line with findings by Wu et al. (2012), who developed SEMA scale, also based on MARS-E. The study identified two factors of MA: numerical processing anxiety and situational and performance anxiety. However, these two factors, extracted using EFA, were not confirmed by CFA, and the psychometric properties reported for SEMA were lower than those of the Spanish version of CMAQ-R. For example, the SEMA scale reports 8.5% of variance explained by the ‘situational and performance anxiety’ factor, while for CMAQ-R (Spanish version) 30% of variance is explained by the ‘mathematics anxiety towards general situations’ factor. A positive aspect of the present study was that it used the largest sample of any study of CMAQ-R published to date. However, all of the participants were second-grade students and it is therefore essential that future studies that use the scale examine whether CMAQ-R factor structure may be used with first-grade students. Additionally, in light of the evidence suggesting that MA is linked to contextual factors (Chang & Beilock, 2016; Rubinsten et al., 2018) and has a significant impact on mathematics performance (Carey et al., 2017), future studies could use the present instrument to examine the impact of classroom dynamics and teacher characteristics on the development of MA and its relation to subsequent mathematics performance. In conclusion, the present study contributes evidence as to the usefulness of the CMAQ-R scale in contexts that are culturally different to the original, and supports the multidimensionality of MA. In addition, given the limited number of studies that have explored this phenomenon in Latin America, and particularly in Chile, the present paper makes a real contribution to the research on the subject and offers an instrument that may be easily applied and interpreted by teachers and education professionals in general. The study of MA, particularly during early school years, has been systematically overlooked in comparison with other competence factors. As such, the existence of a validated and reliable measure will enable early identification of students at risk of MA and support the implementation of preventive strategies and specific interventions within the school context. Conflict of Interest The authors of this article declare no conflict of interest. Acknowledgement We gratefully acknowledge Gerardo Ramírez for facilitating access to the English version of the Revised Child Mathematics Anxiety Questionnaire (CMAQ-R). The first author was supported by Doctoral Fellowship No 21182003, ANID, Chile. Funding: This study was supported by CONICYT-Chile (FONDECYT REGULAR Nº 1191589) and the Spanish Ministry of Economy and Competitiveness (Programa Ramón y Cajal, RYC-2014-16948). Cite this article as: Guzmán, B., Rodríguez, C., Ferreira, R. A., & Hernández-Cabrera, J. A. (2020). Psychometric properties of the revised child mathematics anxiety questionnaire (CMAQ-R) for Spanish speaking children. Psicología Educativa, 27(2), 115-122. https://doi.org/10.5093/psed2020a17 References |
Cite this article as: Guzmán, B., Rodríguez, C., Ferreira, R. A., and Hernández-Cabrera, J. A. (2021). Psychometric Properties of the Revised Child Mathematics Anxiety Questionnaire (CMAQ-R) for Spanish Speaking Children. PsicologÃa Educativa, 27(2), 115 - 122. https://doi.org/10.5093/psed2020a17
crodri@ull.es Correspondence: crodri@ull.es (C. RodrÃguez)Copyright © 2026. Colegio Oficial de la Psicología de Madrid


 PDF
PDF e-PUB
e-PUB CrossRef
 JATS
JATS Imprimir
 Enviar
ALERTA POR E-MAIL
La Revista de Psicología Educativa está distribuida bajo una licencia de Creative Commons Reconocimiento-NoComercial-SinObra Derivada 4.0 Internacional.com