Self-assessment and Customized Learning Strategies Training Via a Smartphone App in Higher Education: The Self-Regulation Learning Scale’s Development and Psychometric Analysis
[La autoevaluación y el entrenamiento de estrategias de aprendizaje personalizadas mediante una aplicación para teléfonos móviles en educación superior: el desarrollo y análisis psicométrico de la Escala de Autorregulación del Aprendizaje]
Agustín Freiberg-Hoffmann1, 2, Agustín Romero-Medina3, Carlos Vigh2, 4, Fabiana Uriel2, Mercedes Fernández-Liporace1, & 2
1Consejo Nacional de Investigaciones CientĂficas y TĂ©cnicas, Argentina; 2Universidad de Buenos Aires, Argentina; 3Universidad de Murcia, España; 4Universidad Nacional de General Sarmiento, Instituto de Ciencias, Argentina
https://doi.org/10.5093/psed2026a14
Received 6 May 2025, Accepted 8 January 2026
Abstract
The study aims to develop a scale to measure self-regulated learning and estimate its psychometric indices. It is framed on a wider development of a smartphone app containing tools for college undergraduates to self-assess and train their self-regulated learning strategies. Therefore, 209 items were created using a mixed rational-empirical approach. Content and face validity analyses led to retaining 68 items, later examined via exploratory factor analysis. The extracted solution retained 31 items, grouped into 5 factors − Cognitive, Meta-Cognitive, Motivational, Emotional, and Social. Such structure was tested via an exploratory structural equation modeling analysis, obtaining optimal fit indices as well. Factorial invariance, criterion validity, and stability-reliability were also verified. In sum, a scale with adequate psychometric features is here introduced. It has been added to the smartphone app that lets students get the results of their learning strategies self-assessment and recommendations to self-regulate them.
Resumen
El estudio busca desarrollar una escala para medir el aprendizaje autorregulado y calcular sus índices psicométricos. Se enmarca en el desarrollo más amplio de una aplicación para teléfonos móviles que contiene herramientas para que estudiantes universitarios autoevalúen y entrenen sus estrategias de aprendizaje autorregulado. Se crearon 209 ítems utilizando un enfoque racional-empírico mixto. Los análisis de contenido y validez aparente permitieron retener 68 ítems, que posteriormente se examinaron mediante análisis factorial exploratorio. La solución extraída conservó 31 ítems, agrupados en cinco factores: cognitivo, metacognitivo, motivacional, emocional y social. Dicha estructura se probó mediante un análisis exploratorio de modelos de ecuaciones estructurales, obteniendo índices de ajuste óptimos. También se verificaron la invariancia factorial, la validez de criterio y la estabilidad-fiabilidad. En resumen, se presenta una escala con características psicométricas adecuadas. Se ha añadido a la aplicación para teléfonos móviles, lo que permite a los estudiantes obtener los resultados de la autoevaluación de sus estrategias de aprendizaje y recomendaciones para su autorregulación.
Palabras clave
Aprendizaje autorregulado, Autoevaluación, Propiedades psicométricas, Estudiantes universitarios, Aplicación para teléfonos móvilesKeywords
Self-regulated learning, Self-assessment, Psychometric properties, Undergraduates, Smartphone appCite this article as: Freiberg-Hoffmann, A., Romero-Medina, A., Vigh, C., Uriel, F., & Fernández-Liporace, M. (2026). Self-assessment and Customized Learning Strategies Training Via a Smartphone App in Higher Education: The Self-Regulation Learning Scale’s Development and Psychometric Analysis. PsicologĂa Educativa, 32, Article e260457. https://doi.org/10.5093/psed2026a14
Correspondence: agustinfreiberg@gmail.com (A. Freiberg-Hoffmann).Issues such as delay, failure, and academic dropout are commonplace in higher education worldwide (e.g., Aina & Pastore, 2020; Álvarez, 2021; Bryson, 2023; Ibáñez-Cubillas et al., 2023; Lorenzo-Quiles et al., 2023). Argentina is far from being in a good place either: on the one hand, 38% of freshmen drop out of university, and 22% change majors in the first or the second year (Ministerio de Educación, Secretaría de Políticas Universitarias, 2021); on the other hand, delays in graduation are also customary, with only 25% of students getting their degrees in the stipulated term (Ministerio de Educación, Secretaría de Políticas Universitarias, 2019). Such delays are partly explained by courses pass-fail: official reports show that 35.7% of students cannot pass any course per academic term whereas 15.3% pass only one; a meager 14.8% pass the required number of courses per year to get their degrees in the stipulated time (Fundación Libertad, 2019). Moreover, delay usually ends up in dropout either in the mean or the long term (Seminara & Graffigna-Vaggione, 2021). Those academic issues − delay, failure, and dropout − stem from multiple factors such as demographic, environmental, academic, didactic, and psychological, among others (Alonazi, 2018; Çizel et al., 2017; Najimi et al., 2013; Stăiculescu & Richiţeanu-Năstase, 2018; Trejo-Sánchez, 2019; Van Rooij et al., 2017; Yu et al., 2018). Among the abovementioned, psychological resources employed to deal with academic activities stand out − i.e., cognitive, meta-cognitive, motivational, behavioral, emotional, and social (Schunk & Greene, 2018). Knowing how students use such resources is valuable not only for teachers but also for students themselves. Teachers could plan their methods and strategies accordingly and students can change their study habits and strategies to manage self-regulated learning (Tekkol & Demirel, 2018). Models of self-regulated learning coincide, in general, in conceiving the notion as a process with different stages: these stages are usually described as task definition, goal setting and planning, execution and monitoring, as well as evaluation. The latter entails a reflection on results and contributes to regulating behavior to adapt it further. The circuit is constantly feedbacking and evolving (Muis & Singh, 2018; Panadero, 2017). It is worth mentioning that not every stage occurs necessarily in every learning situation. Occasionally, students learn some contents implicitly or involuntarily, making the self-regulatory process unnecessary (Boekaerts, 2011; Pintrich, 2000; Winne, 2011). Even though several models of self-regulated learning were posed, some of them stand out on the grounds of their conceptual and instrumental importance (Hernández-Barrios & Camargo-Uribe, 2017; Panadero, 2017; Zhu et al., 2020). Nevertheless, each one is focused on a unique dimension of self-regulation − either cognition, motivation, or emotion, among others −, disregarding the rest of them (e.g. Boekaerts, 2011; Pintrich, 2000; Winne & Hadwin, 1998; Zimmerman, 1989). Yet, there is a consensus in describing self-regulated learning as a process in which students develop actively their knowledge as a result of setting certain goals. Accordingly, students monitor, regulate, and control not only their cognitions, motives, emotions, and behaviors but also the environment to achieve those goals (Boekaerts, 2011; Pintrich, 2000; Winne, 2011). Studies repeatedly verified the liaison between self-regulated learning and academic achievement − i.e., significant correlations between them, the role of the former in predicting the latter, and even meta-analyses verifying such relationship as a proven effect (Almalki, 2019; Alotaibi et al., 2017; Dent & Koenka, 2015; Ergen & Kanadli, 2017; Hernández-Barrios & Camargo-Uribe, 2017; Nabizadeh et al., 2019; Sitzmann & Ely, 2011; Vaezi et al., 2018; Yip, 2019). Considering the above and since self-regulated learning can be trained, academics recommend its promotion using different existing methods such as on-site or online workshops, tutored sessions, and the use of technology (Boekaerts et al., 2000; Broadbent et al., 2020; Núñez et al., 2011; Pintrich et al., 1987; Raaijmakers et al., 2017; Roces-Montero & Sierra, 2017; Tuckman, 2003; Weinstein & Underwood, 1985; Zimmerman, 2015). It is noteworthy that, no matter what the methodology is, acquiring and modifying learning habits and strategies depends mostly on the student’s deliberate action (Ericsson & Lehman, 1996; Kitsantas et al., 2013). This is the reason for the use of hypermedia-based environments and intelligent tutoring systems: they work as a scaffolding structure; whereas at first those auxiliary means are intensively introduced, they are gradually retired as students become more experts in regulating their competence (Lajoie & Azevedo, 2006; Poitras & Lajoie, 2018). Thus, identifying those strategies that are less developed but potentially useful to succeed in learning activities arises as paramount: such diagnosis will let students start their customized training by themselves given the scaffold strategically organized to do so (Kim et al., 2020). As a consequence of the above, developing a smartphone app for higher education students to self-assess and train their self-regulated learning strategies is the ultimate goal to achieve. Framed on that plan, this study constitutes such endeavor’s first stage, aimed at developing a valid and reliable scale to measure the dimensions of self-regulated learning. It will be specifically intended to be useful for students attending different majors. So, the objectives are as follows: 1) developing a scale to self-assess regulated learning habits and strategies in Argentinean higher education students, using theoretical and empirical criteria; 2) analyzing content and face validity evidence; 3) examining its factorial structure and internal consistency; 4) estimating the scores’ stability-reliability; and 5) analyzing criterion validity evidence. Participants The Scale’s Development Seven Argentinean teachers from different majors − Psychology, Medicine, Nutrition, Dentistry, Sociology, Physics, and Industrial Engineering − were interviewed, as well as ten deans from different Faculties of Spain − Mathematics, Computer Engineering, Psychology, Sociology, Philosophy, Chemistry, Biology, Veterinary, Medicine, and Law. Moreover, six focus groups with Argentinean students from different majors − Physics, Nutrition, Medicine, Dentistry, Psychology, and Sociology, one group per major, and two groups from Spain − Speech Therapy and Psychology − were conducted. Content and Face Validity Evidence Analyses Seven experts analyzed the items’ content: four Argentinean, two Spanish, and one Uruguayan. The face validity analysis was conducted in two stages with Argentinean students: 128 attending different majors − 51% Mathematics and Biology, 28% Medicine, 11% Engineering, and 10% Psychology − participated in the first stage; 47 students from Psychology, Mathematics and Biology, and Engineering participated in the second − 40%, 27%, and 33%. Internal Structure Analysis The sample was composed of 740 Argentinean students (72.3% female, 27.2% male, 0.5% other) from 17 to 69 years old (M = 28.84, SD = 9.53). Students attended majors in different faculties (21.8% Sociology, 19.9% Medicine, 18.2% Engineering, 15.4% Mathematics and Biology, 6.8% Economics, 6.2% Psychology, 5.1% Philosophy, 3.8% Law, 1.4% Architecture and Design, 0.8% Dentistry, and 0.6% Agronomy). Regarding different stages of their academic path, they were distributed as follows: 20.5% 1st year term, 18.9% 2nd year, 22.2% 3rd year, 18% 4th year, 9.6% 5th year, 10.8% 6th year; 72% of them responded online and 28% on paper and pencil. Exploratory Structural Equation Modeling Analysis (ESEM) 1,605 Argentinean college students participated (69.6% females, 30% males, 0.4% other) between 17 and 70 years old (M = 27.3, SD = 9.11). Students attended different majors (23% Medicine, 18.6% Engineering, 18.5% Sociology, 17.7% Psychology, 10.7% Mathematics and Biology, 4.1% Economics, 3% Law, 2.4% Philosophy, 1% Pharmacy and Biochemistry, and 1% Architecture and Design) grouped into five fields of study (26.2% Social Sciences, 21.2% Applied Sciences, 21.2% Health Sciences, 18.5% Human Sciences, and 13% Basic Sciences). As for the different stages of their academic path, 19.7% attended their 1st year term, 18.9% 2nd year 26.9% 3rd year, 18.9% 4th year, 7.9% 5th year, and 7.7% 6th year; 65.7% of them responded online and 34.3% on paper and pencil. Factorial Invariance Analysis The same sample used in the ESEM study was analyzed. Stability Reliability Analysis Sixty seven Argentinean Psychology students (88.1% females, 11.9% males, 0% other) between 20 and 48 years old (M = 25.82; SD = 6.10) participated. Criterion Validity Evidence Analysis The sample was composed of 344 college students from Argentina (71.8% females, 27.6% males, .6% others) between 18 and 59 years old (M = 23.88, SD = 6.51). They attended different majors (55.1% Psychology, 23.6% Medicine, and 21.3% Mathematics and Biology). Instruments Self-Regulation Learning Scale (SRLS) It was specially developed for this study, following theoretical and empirical criteria; it includes several dimensions of self-regulated learning: Cognitive, Metacognitive, Motivational, Behavioral, Emotional, and Social. University Student Engagement Inventory (USEI; Maroco et al., 2016) An adapted version for Argentinean college students (author) was employed. It verified its internal structure and obtained adequate internal consistency indices. The USEI includes three first-order dimensions that assess Behavioral engagement (αordinal = .65), Emotional engagement (αordinal = .84), and Cognitive engagement (αordinal = .85), and one second-order dimension assessing General engagement (αordinal = .85). Examinees must respond to 15 items employing a five-point Likert scale. Tuckman Procrastination Scale (TPS; Tuckman, 1991) The version adapted to Argentinean college students (author) was employed. That adaptation study verified the one-factor structure posed by Tuckman and obtained an ordinal alpha coefficient of .90. The scale measures a unique dimension of academic procrastination employing 15 items and a five-point Likert response scale. Learning and Study Strategies Inventory (LASSI; Weinstein et al., 1987) The version adapted to Argentinean college students (author) was used. It obtained satisfactory content and construct validity evidence on the one hand, and adequate stability-reliability as well as internal consistency on the other. It is composed of 33 items responded via a five-option Likert scale, assessing five types of strategies; they are Collaborative Learning (αordinal = .84), Motivation (αordinal = .78), Abilities to Rank Information (αordinal = .73), Resources for Learning (αordinal = .72), and Information 2.0 Management (αordinal = .54). Procedure The Scale’s Development The initial pool of items was created following a mixed theoretical-empirical criterion. The theoretical one included widely accepted models of self-regulated learning (e.g., Boekaerts, 2011; Pintrich, 2000; Winne & Hadwin, 1998; Zimmerman, 1989), whereas information about the use of self-regulated learning in higher education was gathered to meet the empirical criterion. To do so, online and in-person focus groups with students and online and in-person interviews with teachers and deans from different majors/faculties were conducted (Stewart & Shamdasani, 2017). Content and Face Validity Evidence Analysis Regarding the content validity study, a file containing the description of self-regulated learning and its dimensions − Cognitive, Metacognitive, Motivational, Behavioral, Emotional, and Social − along with the items operationalizing them was either sent or handed to each expert. Experts should evaluate the degree of adequacy between each item content and the dimension that it had been originally developed to represent. A four-point Likert response scale was employed, from 1 = completely inadequate to 4 = completely adequate, following current recommendations on the matter (Yusoff, 2019). The information gathered at this stage was used to calculate the content validity index (I-CVI) for each item. Values for this index vary from 0 = nil agreement to 1 = absolute agreement. Items with I-CVI over .83 were retained, as suggested when the number of participant experts is between six and eight (Yusoff, 2019). The first stage of the face validity study was conducted simultaneously with the content validity analysis. Items were sent to students attending different majors via Google Forms; the instructions requested to read each item and indicate whether its content was adequate in terms of the major students attended. The goal was to retain items applicable to the widest possible variety of majors to reduce random and biased responses (Boateng et al., 2018). To conduct this procedure, the method applied in the content validity analysis was also employed: students were asked to indicate how suitable was each item for their major’s uses via a four-point Likert scale from 1 = completely inadequate to 4 = completely adequate. Later, the I-CVI index was estimated for each item; those that obtained an I-CVI over .78 were retained since more than nine participants were included (Yusoff, 2019). A pilot study was later performed on the resulting version. After receiving the new version via Google Forms, they were asked to point out which expressions were difficult to understand either in the items or in the instructions. Changes were performed when suggestions reached a minimum consensus of 70% (Snape et al., 2014). Besides, different alternative Likert scales with different anchoring points − identification, frequency, and agreement − were rated by students in terms of their suitability. Afterwards, an exploratory factor analysis was performed with the aim of analyzing the construct’s dimensionality. Then, an exploratory structural equation modeling analysis was conducted to confirm the model extracted from the previous procedure. Both analyses were carried out on two different samples in order to ensure the results’ independence (T. Brown, 2015). Exploratory Factor Analysis Polychoric correlation matrices and the minimum rank factor analysis method (Author) were employed. A double criterion was assumed to determine whether an item was to be retained or not: factorial loadings needed to reach a value of at least .40, and this minimal value should be exclusive to that unique item, not loading on two factors simultaneously (Howard, 2023). The factor determinacy index (FDI), the sensitivity ratio (SR), and the expected percentage of true differences (EPTD) indices were used to evaluate the fit adequacy; values should be higher than .90 for FDI, than 2 for SR, and over 90% for EPTD (Ferrando & Lorenzo-Seva, 2018). H indices of construct replicability were also considered; they should be over .80 (Hammer, 2016). McDonald’s omega coefficients were also calculated (McDonald, 1999). Exploratory Structural Equation Modeling The factorial structure extracted in the exploratory stage was tested via exploratory structural equation modeling (ESEM). Instead of performing a confirmatory factor analysis, an ESEM procedure was applied since it is the one recommended to verify the structure obtained in an exploratory factor analysis when interfactorial loadings overestimation is to be avoided in multifactor structures (Gomes & Gjikuria, 2017; Marsh & Alamer, 2024). Polychoric correlation matrices and the weighted least square-mean method (WLSM) were employed, as suggested by DiStefano and Morgan (2014), and Kyriazos and Poga-Kyriazou (2023). The model fit was evaluated via the Comparative Fit Index (CFI), the Tucker Lewis index (TLI), the Root Mean Square Error of Approximation (RMSEA), and the Standardized Root Mean Square Residual (SRMR). Values higher than .90 for CFI and TLI, and lower than .08 for RMSEA and SRMR were considered adequate (Jordan-Muiños, 2021; Wang & Wang, 2020). Factorial Invariance Analysis The model’s metric equivalence was tested by type of administration (i.e., online/paper-pencil), given that the instrument developed in this study is to be used both in-person and via an app for smartphones, according to the original framework’s purpose of the research. Moreover, the model’s metric equivalence was also analyzed by fields of study (Social Sciences, Applied Sciences, Health Sciences, Human Sciences, and Basic Sciences) since the instrument is meant to be used by students from different majors. Additionally, considering it is expected that students train and monitor their learning strategies throughout their academic path while using the test included in the smartphone’s app, the model’s metric equivalence was examined by stage of the academic path as well. To do the latter, the sample was split into three categories: beginners (1st and 2nd year-term), intermediate (3rd year), and advanced (4th, 5th, 6th year). That three-categories grouping was due to the need to analyze samples of the same size. A metric equivalence analysis according to gender was also applied, given that the instrument is intended for both men and women students. The WLSM estimation method was run and six different nested models with different constraint levels were examined: 1) configural − without constraints; 2) weak invariance − constraint factor loadings; 3) strong invariance − constraint factor loadings and intercepts; 4) strict invariance − constraint factor loadings, intercepts, and item uniqueness; 5) latent variance-covariance − constraint factor loadings, intercepts, item uniqueness, and latent variance/covariance; and 6) latent means − constraint factor loadings, intercepts, item uniqueness, latent variance/covariance and latent factors means (Millsap, 2011). Stability Reliability Analysis The scores’ stability reliability was analyzed for each dimension via a test-retest study. The same sample was examined twice, with a 30-day interval. Intraclass correlational coefficients (ICC) and paired sample t-tests were calculated. Criterion Validity Evidence Analyses The dimension’s scores from the Self-Regulation Learning Scale were correlated with the scores of the University Student Engagement Inventory, the Tuckman Procrastination Scale, the Learning and Study Strategies Inventory, and the Academic Achievement scores. Since dimensions did not meet the normality assumption, Spearman’s rho coefficient was calculated. Table 1 Exploratory Factor Analysis of SRLS 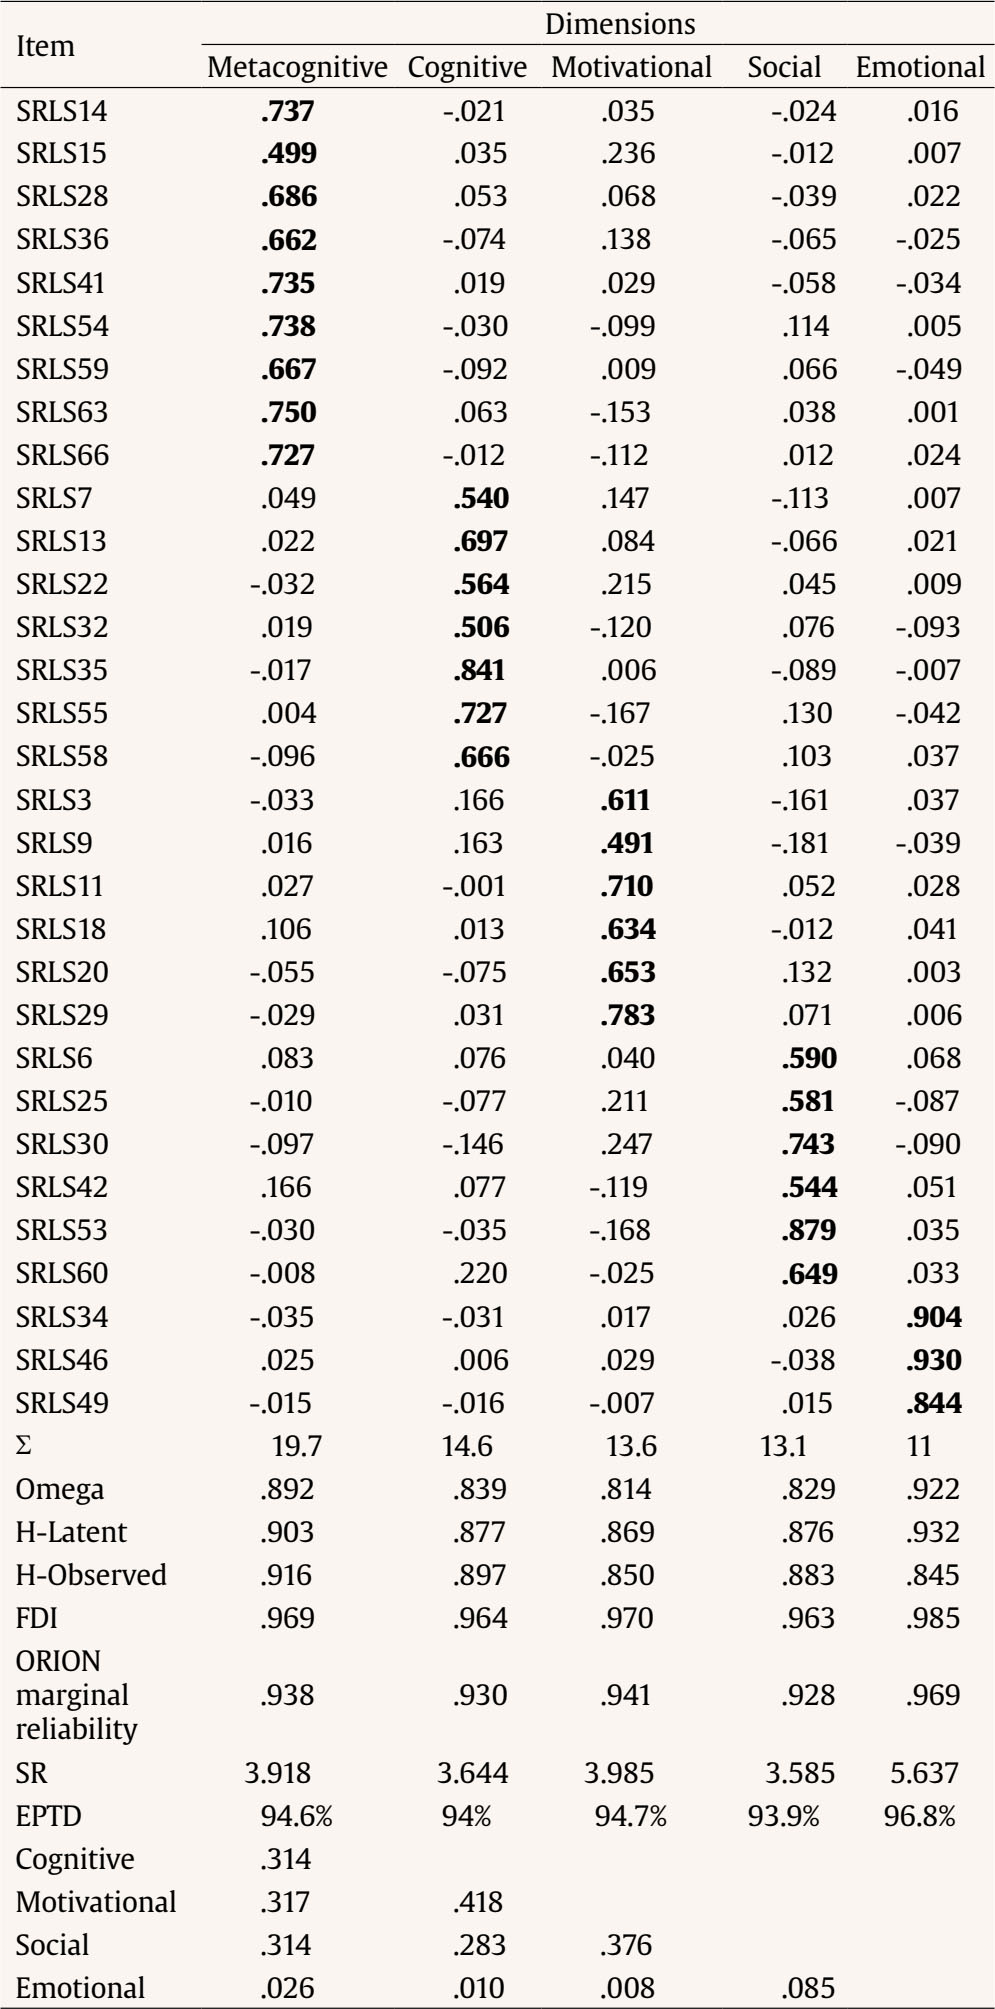 Data Analysis The exploratory factor analysis was performed via FACTOR 12 software, whereas Mplus 8.9 was used for both the exploratory structural equation modeling and factorial invariance analysis (De Beer & Morin, 2022; van Zyl & ten Klooster, 2022). The SPSS 21 software was also employed for conducting a stability reliability analysis and criterion validity evidence analyses. The Scale’s Development Following the theoretical and empirical criteria, 244 items were developed (85 with a rational criterion and 159 with an empirical criterion); 35 out of the original 244 were eliminated due to redundancy. Thus, the first version included 209 items grouped into six dimensions of self-regulated learning − 43 Cognitive-, 28 Metacognitive-, 29 Motivational-, 56 Behavioral-, 34 Emotional-, and 19 Social dimension − according to different theoretical models. Content and Face Validity Evidence Analysis The content of the 209 items was examined by the selected experts. Also, an initial face validity study was conducted with students attending different majors. As a result, 68 items were retained. The 141 eliminated items were the ones that did not meet I-CVI over .83 criterion in the content validity analysis and/or .78 at the first stage of the pilot study. The remaining 68 items were examined in a second face validity analysis. This new stage of the pilot study did not report the need to perform changes to the instructions or the items either. Regarding the response scale, 74% preferred the identification anchoring response (1 = not identified at all to 5 = completely identified). Exploratory Factor Analysis An exploratory factor analysis with promin rotation was run. After testing several solutions, and considering the abovementioned criteria for retaining or not an item (factor loadings over .40 in a unique factor), a five-factor-31-item structure was selected. It explained 72% of the common variance. All factors obtained optimal consistency indices, over .80 (Table 1). Exploratory Structural Equation Modeling Analysis The resulting factor solution was tested in a new sample via an exploratory structural equation modeling analysis. The model obtained optimal indices (CFI = .970, TLI = .956, RMSEA = .061, CI [.059, .064], SRMR=.028), verifying an adequate fit to data. All the item parameters were statistically significant and achieved the highest factorial loadings in the dimensions they were originally developed for (Table 2). Table 2 Items Statistics for the ESEM Model 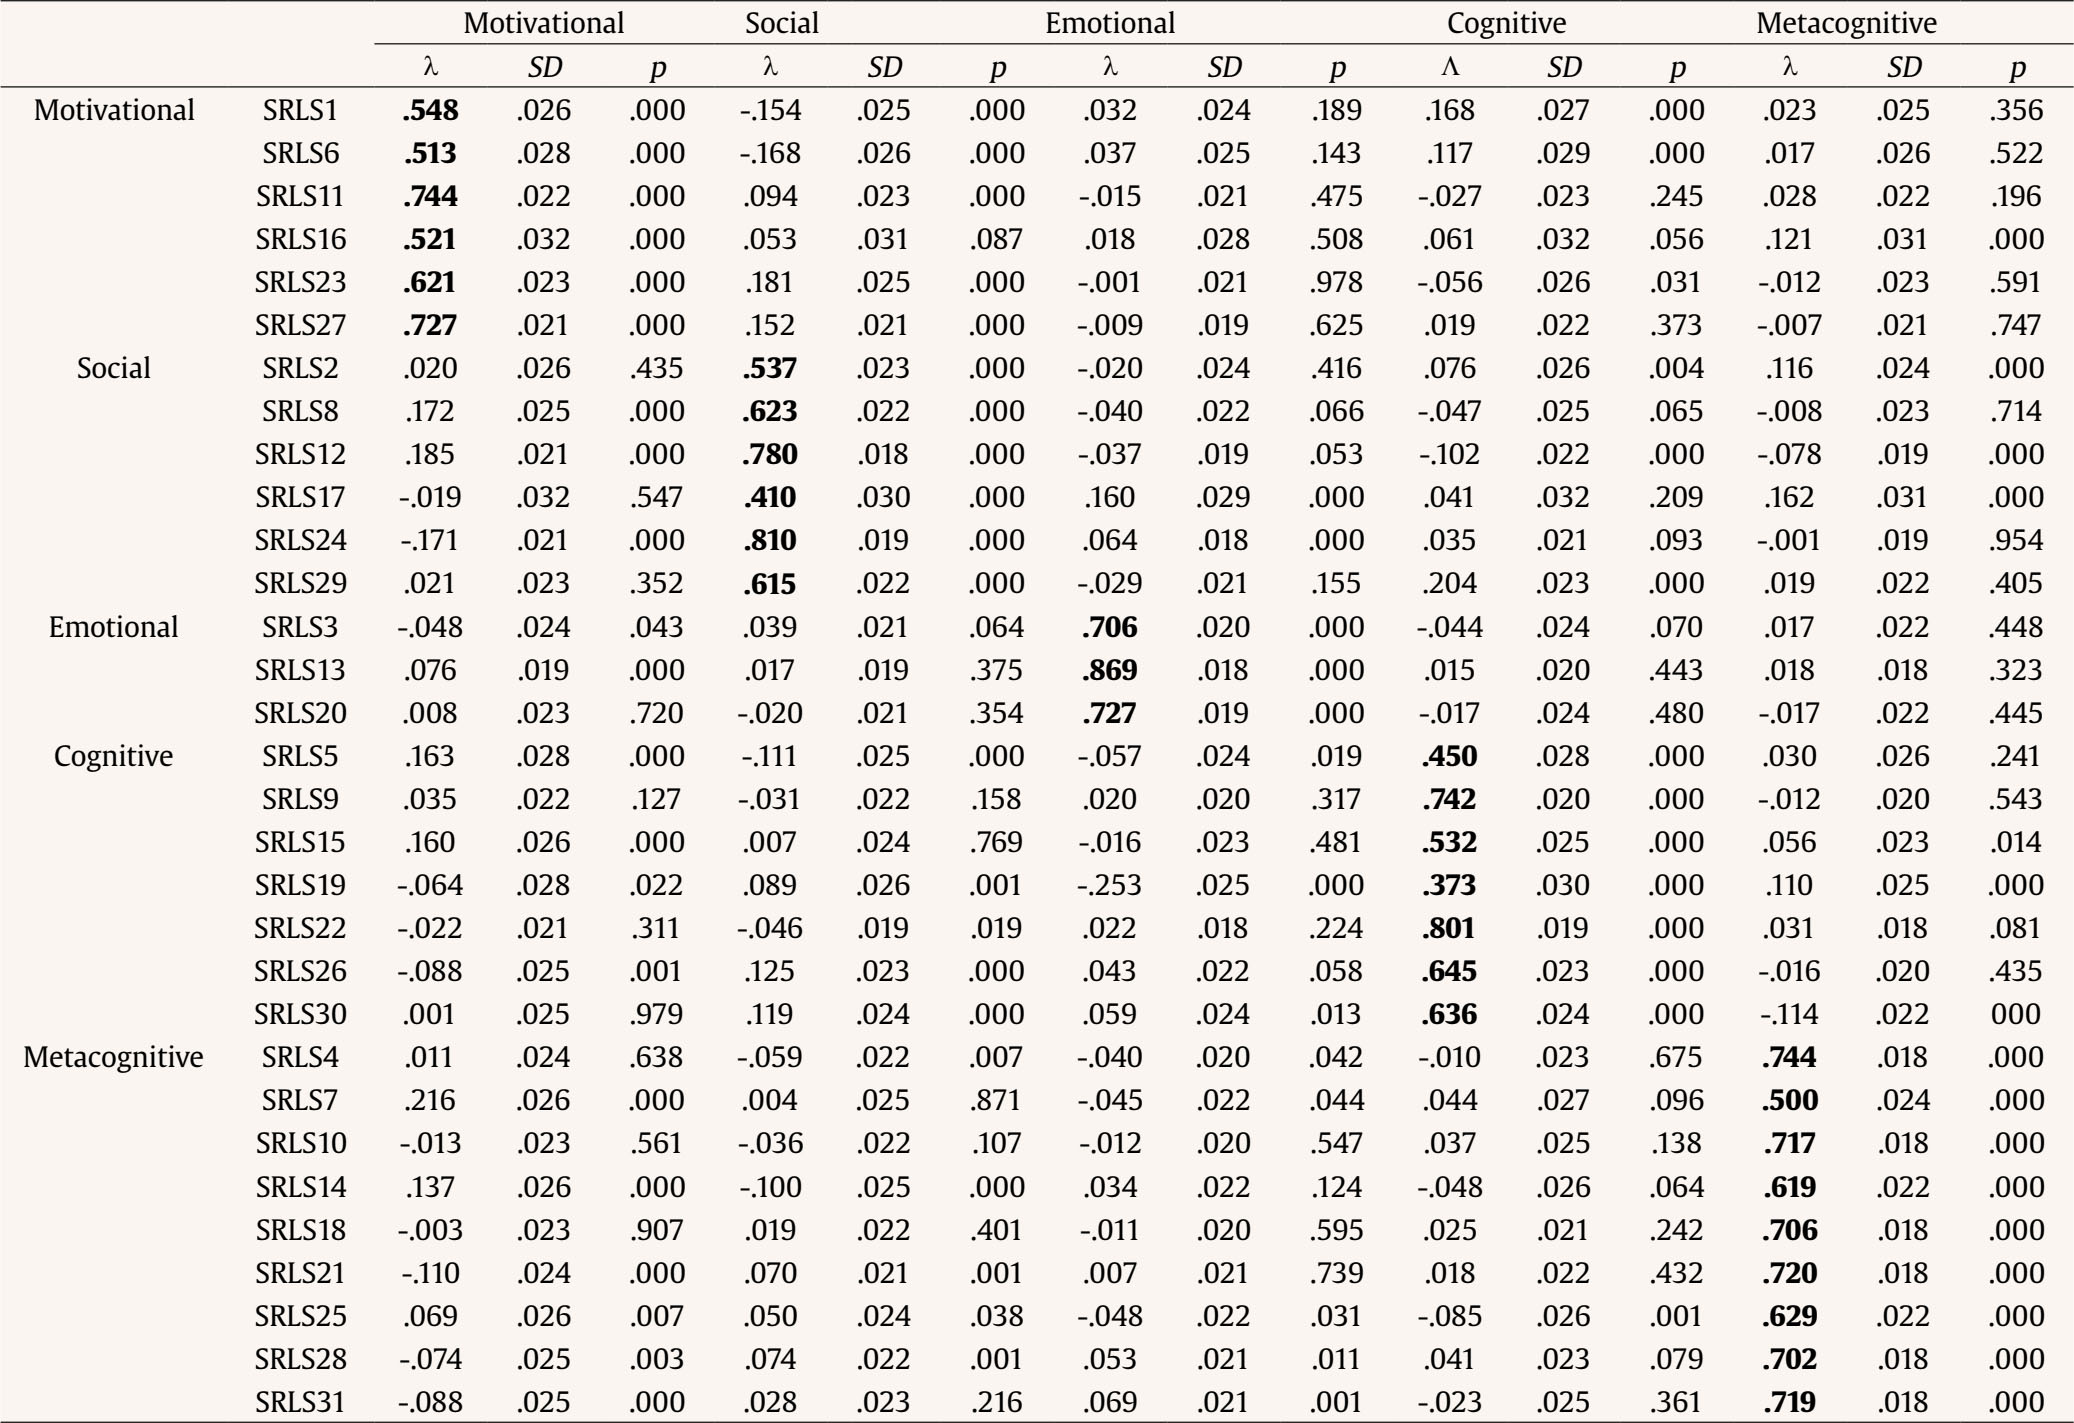 Factorial Invariance The model’s factorial invariance was analyzed splitting the sample by type of administration (paper-pencil/online), fields of study (Social Sciences, Applied Sciences, Health Sciences, Human Sciences, and Basic Sciences), and academic path (beginners, intermediate, and advanced). Different nested models were tested, gradually imposing different levels of constraint. The metric equivalence was verified in every case (Table 3). Table 3 Factorial Invariance 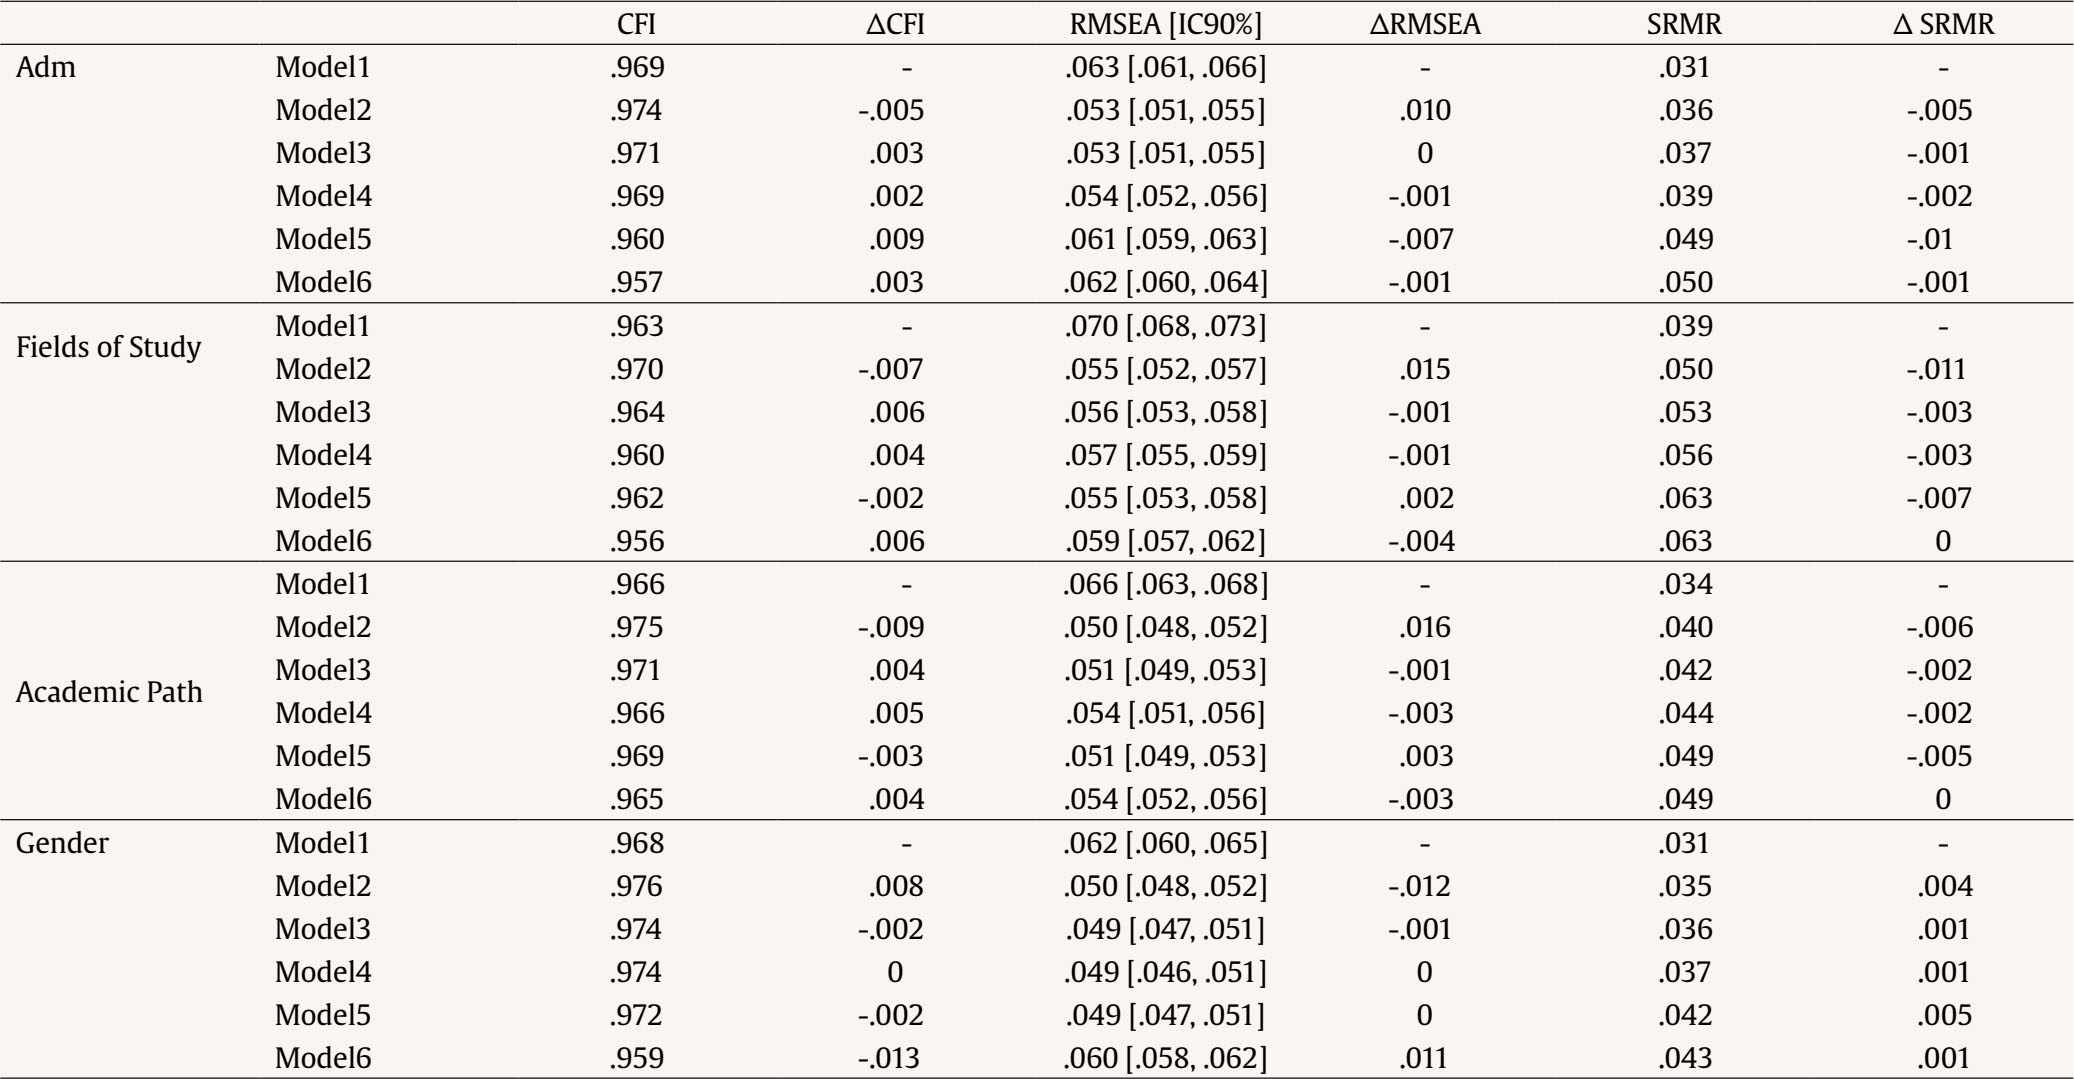 Note. Adm = administration format; Model1 = configural; Model2 = weak invariance; Model3 = strong invariance; Model4 = strict invariance; Model5 = latent variancecovariance; Model6 =lLatent means. Stability Reliability Analysis The stability reliability of the dimensions’ scores was analyzed via a test-retest procedure. The intraclass correlation coefficient (ICC) and paired sample t tests were calculated. No statistically significant differences between scores were verified (p > .01). The association between scores was statistically significant with a moderate-high magnitude (Table 4). Table 4 Stability Reliability Analysis 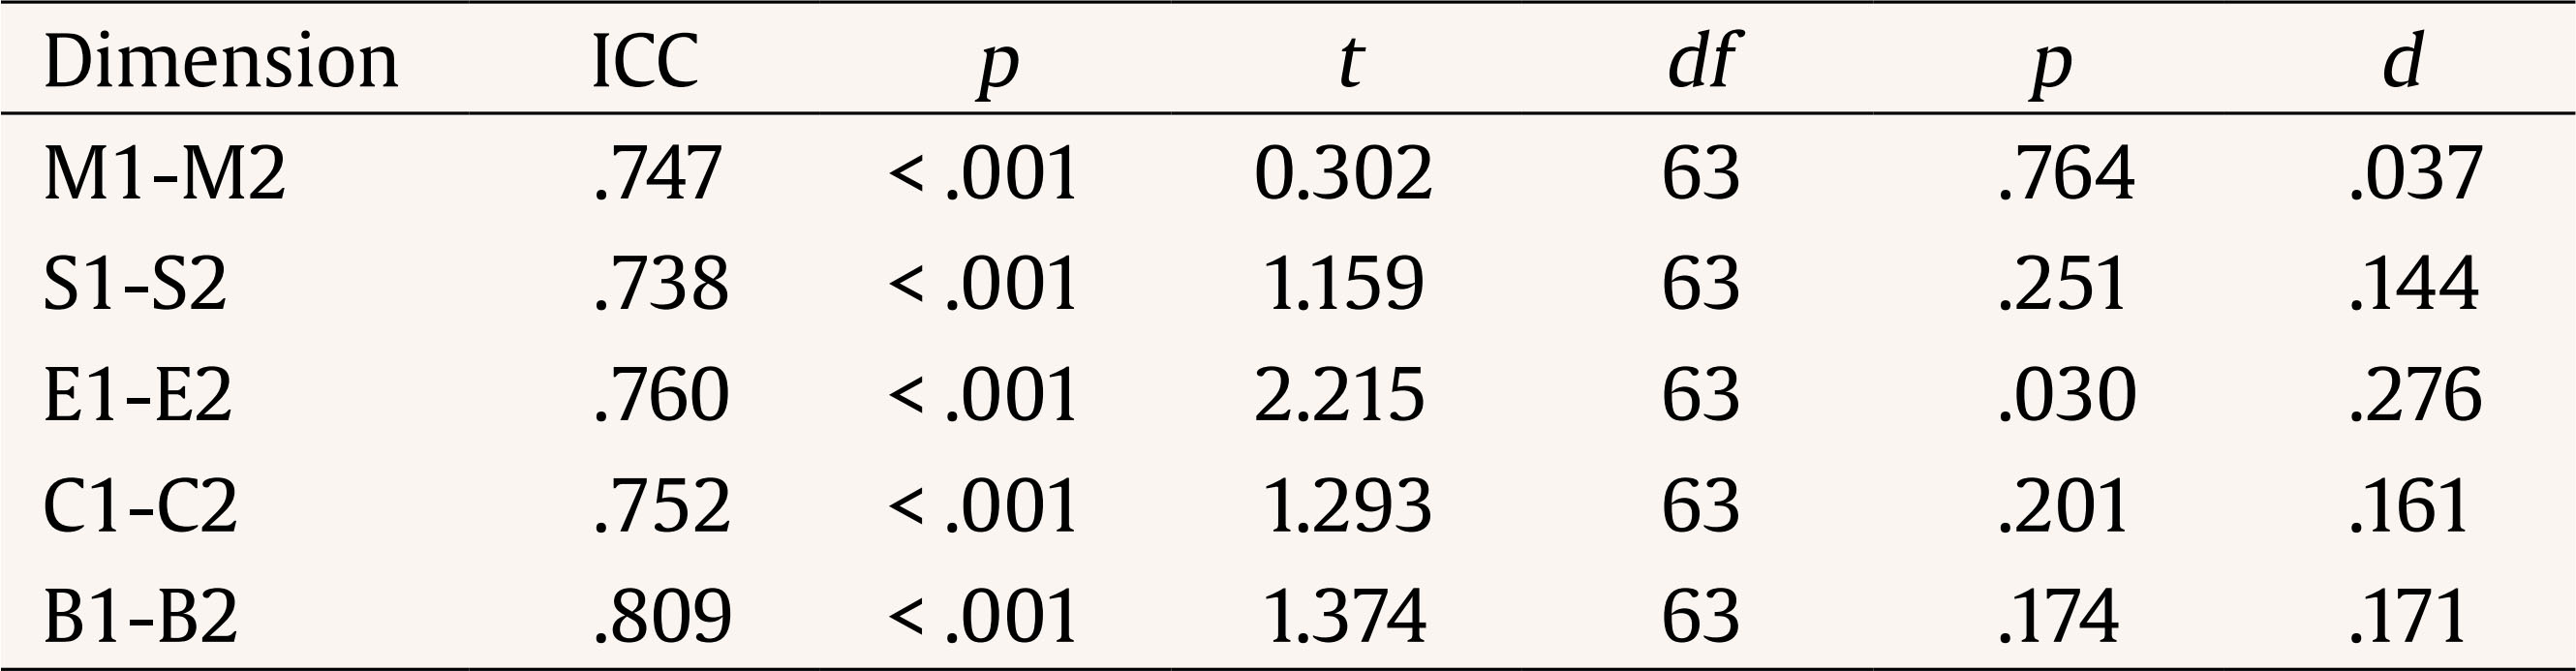 Note. M = motivation; S = social; E = emotional; C = cognitive; B = behavior; 1 = first administration; 2 = second administration. Criterion Validity Evidence Criterion validity analyses were conducted comparing the dimensions’ scores of SRLS with the ones from the scales used as criteria −Academic Engagement, Academic Procrastination, and Learning Strategies− as well as Academic Achievement. All the SRLS dimensions, except for the Emotional one correlated positively and significantly with the Academic Engagement dimensions. Academic Procrastination correlated significantly and negativelly with Motivational-, Cognitive-, and Behavioral dimensions and positively with the Emotional one. The Social dimension did not correlate significantly with Procrastination. The Learning Strategies dimensions correlated significantly and positively with all the SRLS dimensions, except for the Emotional one, which only correlated with Abilities to Rank Information (negatively) and Resources for Learning (positively). Academic Achievement correlated significantly and positively with Motivational-, Cognitive- and Behavioral-, and, negatively with Emotional dimension. The Social dimension did not obtain a significant correlation with Academic Achievement (Table 5). Table 5 Concurrent Validity Evidence 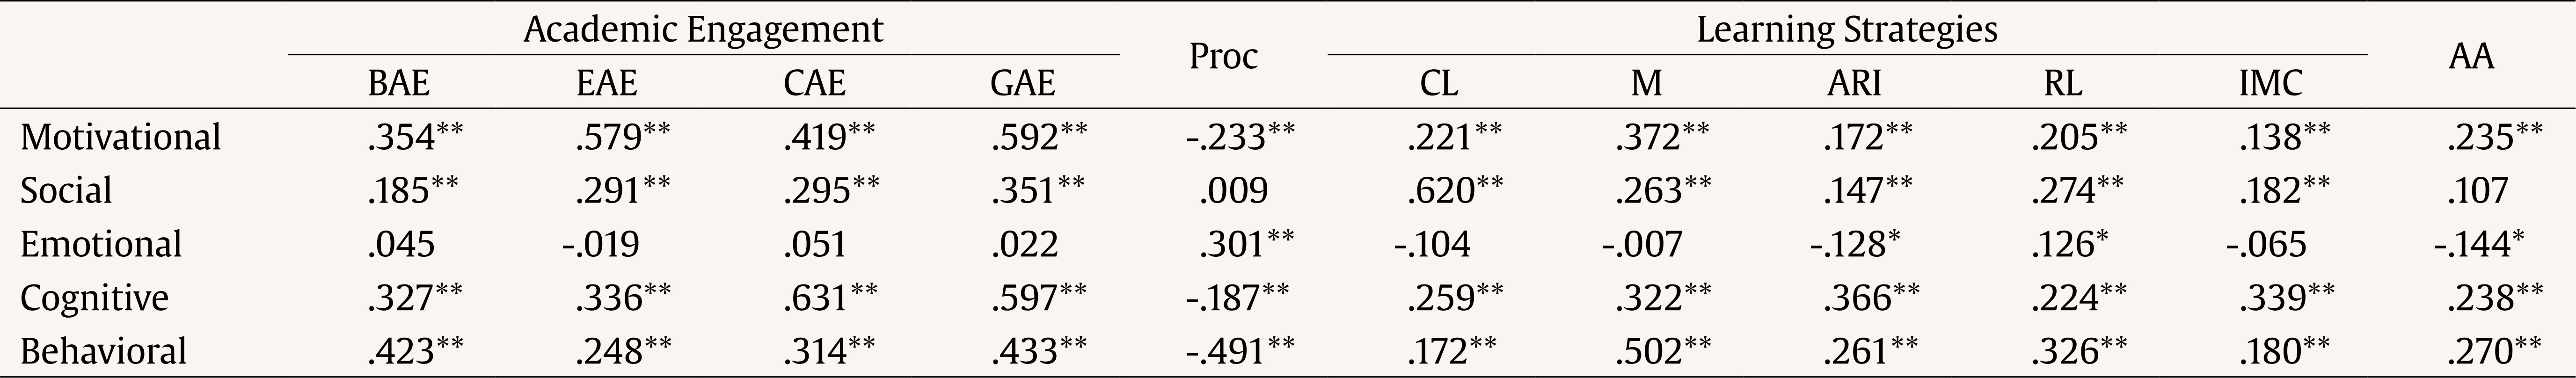 Note. BAE = behavior academic engagement; EAE = emotional academic engagement; CAE = cognitive academic engagement; GAE = general academic engagement; Proc = academic procrastination; CL = collaborative learning; M = motivation; ARI = abilities to rank information; RL = resources for learning; IMC = information 2.0 management; AA = academic achievement. Promoting self-regulated learning in higher education students is paramount when diminishing academic delay, failure, and dropout is the goal, given the positive association of the former with academic achievement. This is the reason for developing a system for students to self-assess and train their self-regulated learning strategies in a customized way via a smartphone app. Framed on that project, this study was aimed at developing a scale to assess such strategies generating valid and reliable results. To do so, theoretical and empirical criteria were used to develop 244 items grouped into six dimensions of self-regulated learning: Cognitive-, Metacognitive-, Motivational-, Emotional-, Behavioral-, and Social dimension. Even when different models were considered, special attention was drawn to the information provided by Argentinean and Spanish students attending different majors as well as by teachers, and deans. As a result, a unique version contemplating cultural and linguistic specificities, able to be used in both countries and eventually feasible to be adapted to other populations was obtained. Following this idea, experts from Spain, Argentina, and Uruguay participated in the content validity study. Students from different majors from Argentina participated in the face validity study since retaining items useful for different fields was the goal at such stage: special emphasis was placed on reducing the error introduced by differences among majors, such as learning materials, practical assignments, or exams (Irwing & Hughes, 2018). To meet that requirement, a thorough item development and depuration process was conducted. As a result of the above, a second version of the scale retaining 68 items was examined in terms of its internal structure; therefore, 31 items grouped into five out of the six dimensions initially posed were retained via exploratory factor analysis: Cognitive, Metacognitive-, Emotional-, Motivational-, and Social dimension. The Behavioral dimension overlapped the Metacognitive one − 6 metacognitive and 3 behavioral items. After examining the items’ content, that dimension was labeled as Metacognitive since all the behavioral items alluded to the effort allocation, which is a major metacognitive feature among activities planning (A. Brown, 1987; Pintrich, 2004) (e.g., “Generally, I force myself to study instead of postponing it”, “I make an effort to stay up to date with the material and content of each course every week”, “I am determined when it comes to studying”). Regarding other features of the extracted dimensions, three items of the Emotional dimension are worth mentioning because of their contents related to test anxiety (e.g., “I am afraid to fail exams”, “I feel very anxious in the previous days of an exam”, and “According to the assessment method (for example, oral or written), anxiety can sometimes get the better of me.”). The items corresponding to this dimension are related only to test anxiety and its negative impact on students. These items do not describe possible strategies to cope with that specific type of anxiety, like meditation techniques, positive self-affirmations/positive self-talk, and strategies to boost self-efficacy feelings/beliefs (Jia et al., 2023; Yılmazer et al., 2024). The lack of this type of content in the items corresponding to the Emotional dimension might explain the low interfactor correlations obtained in the factorial analysis. In fact, research has shown a low association between test anxiety and learning self-regulation (Ispinar-Akcayoglu & Ozer, 2024; Wu et al., 2022). Although it is desirable to find low associations to ensure independence among factors, correlations below .30 may represent an issue when a theoretical relation among factors to represent the construct appropriately is expected (Lloret-Segura et al., 2014). Therefore, efforts will be targeted towards adding new items that improve the Emotional dimension, so adequate correlations with the rest of the dimensions can be obtained, without compromising the factors’ independence. Undoubtedly, new items will enhance the dimension’s psychometric quality since unbalanced dimensions may affect both the explained variance percentage and internal consistency (Ferrando et al., 2022; López-Pina, 2008). The solution obtained via the exploratory factorization reached an FDI value of over .90, marginal reliability over .80, SR over 2, and EPTD over 90%. Such values indicate the adequacy of the scale to be used in higher education when personalized assessment is required (Ferrando & Lorenzo-Seva, 2018). Moreover, H indices over .80 indicate, on the one hand, that the retained items represent the construct properly and, on the other, that the model is adequate and can be replicated in other samples (Hammer, 2016). Internal consistency reached optimal values for all dimensions (ω > .80). After the above, the solution achieved in the exploratory stage was tested via an exploratory structural equation modeling analysis (ESEM), obtaining optimal fit and parsimony indices, with CFI and TLI over .95, as well as RMSEA and SRMR equal or under .06 (Swami et al., 2023). Not only the estimated parameters were significant, but also the items loadings were the highest for the factors they were originally developed for. Later, the ESEM model’s factorial invariance was tested by splitting the sample by administration format, fields of study, academic path, and gender; the metric equivalence of the scale’s internal structure was verified among subsamples. That indicates a low magnitude of sample bias (Davidov et al., 2018). In the professional field, such a result guarantees the correct functioning of the scale in different students attending different majors, and different stages of the academic path. Moreover, the additional validation of the online administration format could not be overlooked when considering that the scale will be included in a smartphone app. As per gender, the latent means invariance was not verified; that suggests that male and female students would obtain significantly different scores in the instrument’s dimensions. Therefore, it is advisable to calculate statistical norms per gender. Regarding the scores’ stability reliability, no significant differences were found after a 30-day interval. That would allow a second application of the scale to evaluate the effect of any possible intervention. Therefore, students could use the app and perform the activities proposed as a result of the assessment as a continuous follow-up of their self-regulated learning strategies. As for the criterion validity study, statistically significant correlations between the Motivational-, Social-, Cognitive- and Behavioral dimensions of the Self-Regulated Learning Scale and the dimensions of Academic Engagement were verified. This result aligns with both theoretical and empirical evidence stating that motivation, cognition and adaptive behavior precede the students’ engagement (Singh et al., 2022). It is also important to note that the Emotional dimension of self-regulated learning did not show a significant correlation with the Academic Engagement dimension. This may be because the instrument’s Emotional dimension specifically assesses test anxiety, which occurs in a rather different moment than the actual process of Emotional engagement, which is enabled in classes that are appealing in the students’ eyes (Tejedor, 2024). Regarding the Procrastination dimension that was used as an external criterion, its low values were associated with a higher regulation of the Motivation-, Cognition-, and Behavior dimensions and with a lower emotional regulation in terms of a low anxiety management related to test anxiety. These results are in line with the ones obtained in another research, which shows that students with self-regulated profiles procrastinate less (Manchado-Porras & Hervías-Ortega, 2021; Rebetez et al., 2015). Concerning the Social dimension of self-regulation, it did not significantly correlate with Procrastination, which, among social factors in general terms, is more related to the use of social networks, media, internet misuse, or even unexpected events, among others; these are not considered in the developed self-regulation dimension (Redondo-Mendoza, 2022). As per Learning Strategies, positive and significant correlations with almost all the self-regulated learning dimensions were observed (Duarte-Duarte et al., 2024); the exception was the Emotional dimension, which obtained a negative association with Abilities to Rank Information and a positive one with Resources for Learning. These results seem reasonable since, on the one hand, a low ability to identify main ideas represents a waste of time and a rise in students’ anxiety; on the other hand, higher anxiety may cause students to employ more resources, resulting in an extra-energy drain (Gutiérrez & Avero, 1995; Weinstein et al., 1987). Academic Achievement showed positive and significant correlations with Motivation-, Cognition-, and Behavior dimensions and negative correlations with the Emotional dimension, as expected. Lastly, the Social dimension did not significantly correlate with academic performance. Although this result was not expected, it does not affect the dimension’s importance since it may act as a mediator in the learning process; such an explanation should be examined in further research. Mainly, it was observed that the criterion validity study showed values moving from low to moderate, in the theoretically expected direction. They were acceptable assuming that, even when the constructs are theoretically related to self-regulated learning, they are not identical. It is worth mentioning that no association coefficient was over .70, concluding the lack of collinearity between variables (Yoo et al., 2014). This study entails some limitations that will be addressed shortly in order to improve the scale’s quality: 1) the impossibility of including a Behavioral dimension due to its inclusion into the Metacognitive factor − a proper Behavioral dimension will be developed further; 2) the Emotional dimension is represented by items exclusively referred to test anxiety − items with a more heterogeneous content should be developed; 3) the test-retest study was conducted in a 30-day interval − different intervals between measures will be soon analyzed; 4) the scale’s longitudinal invariance could not be examined due to the sample size; 5) other types of criterion validity were not analyzed, such as predictive or retrospective; 6) the instrument’s incremental validity evidence was not examined to learn about the influence of each dimension in academic performance; and 7) the gender invariance study only included male and female since a large-enough sample of other genders was not available. All the latter will be promptly addressed as well. To sum up, the study introduces a new scale to assess self-regulated learning dimensions, hosted in a smartphone’s app. It can be downloaded following a link (https://play.google.com/store/apps/details?id=com.learnapp.learnapp&pli=1). For now, the app only allows a self-assessment of a student’s self-regulated learning strategies, with the corresponding feedback and written recommendations; they are targeted to improve those strategies useful to succeed in learning activities that remain underdeveloped. The next endeavor consists of the development of customized interactive activities for the users to train habits and learning strategies. It is expected that this tool set will be useful for students not only to improve their learning quality and therefore academic achievement, but also to diminish academic delay and dropout, especially in freshmen. This research is the starting point of a tech tool development that, along with the broad use of smartphones, offers an app for students to enable self-training of different learning strategies and self-regulation (Faza & Lestari, 2025). To achieve this goal, different theoretical approaches and information from diverse sources collected in the field led to the development of an instrument that provides an integrated assessment of self-regulatory skills in college students (e.g. Boekaerts, 2011; Pintrich, 2000; Winne & Hadwin, 1998; Zimmerman, 1989). As it was mentioned, there are different aspects to be improved as the research moves forward. However, it is worth mentioning that the most important step has already been taken with the development of the instrument introduced in this research. Conflict of Interest The authors of this article declare no conflict of interest. Acknowledgments The authors are grateful to the students who participated in this research. Cite this article as: Freiberg-Hoffmann, A., Romero-Medina, A., Vigh, C., Uriel, F., & Fernández-Liporace, M. (2026). Self-assessment and customized learning strategies training via a smartphone app in higher education: The self-regulation learning scale’s development and psychometric analysis. Psicología Educativa, 32, Article e260457. https://doi.org/10.5093/psed2026a14 Funding This study was supported by the Agencia Nacional de Promoción de la Investigación, el Desarrollo Tecnológico y la Innovación (PICT-2020-SERIEA-00087) as well as another funding grant (PIP xxx11220200100352CO) and an external postdoctoral fellowship from the Consejo Nacional de Investigaciones Científicas y Técnicas (CONICET). The dataset is available by emailing the corresponding author. References |
Cite this article as: Freiberg-Hoffmann, A., Romero-Medina, A., Vigh, C., Uriel, F., & Fernández-Liporace, M. (2026). Self-assessment and Customized Learning Strategies Training Via a Smartphone App in Higher Education: The Self-Regulation Learning Scale’s Development and Psychometric Analysis. PsicologĂa Educativa, 32, Article e260457. https://doi.org/10.5093/psed2026a14
Correspondence: agustinfreiberg@gmail.com (A. Freiberg-Hoffmann).Copyright © 2026. Colegio Oficial de la Psicología de Madrid


 PDF
PDF e-PUB
e-PUB CrossRef
 JATS
JATS Imprimir
 Enviar
ALERTA POR E-MAIL
La Revista de Psicología Educativa está distribuida bajo una licencia de Creative Commons Reconocimiento-NoComercial-SinObra Derivada 4.0 Internacional.com