


Subjective Well-being and Job Performance: Testing of a Suppressor Effect
Special Issue: New Insights on Technology and Assessment
[El bienestar subjetivo y el desempeño en el trabajo: análisis de un efecto supresor]
JesĂşs F. Salgado1, Santiago Blanco2, and Silvia Moscoso1
1University of Santiago de Compostela, Spain; 2Instituto TecnolĂłgico de Monterrey, Mexico
https://doi.org/10.5093/jwop2019a9
Received 24 January 2019, Accepted 28 March 2019
Abstract
This is a four-year follow-up study on the relationship between the cognitive and emotional components of subjective well-being (SWB) and job performance. We hypothesized a positive relationship between these variables and job performance. The sample consisted of 170 managers of a Spanish company in the Information Technology and Communication (ITC) industry. The cognitive component of SWB was assessed with the Satisfaction with Life (SWL) scale and the emotional component with the SPANE scale. Two independent ratings, one from the direct supervisor and another from the HR manager, served as evaluations of job performance during four years in a row. Results showed that the two components of SWB predicted job performance over the four years. Additionally, when the two components are entered in a regression equation the validity increases over time as a consequence of a suppressor effect on the cognitive component of SWB. Finally, we discuss the implications for the theory and the practice of SWB at work.
Resumen
Este es un estudio de seguimiento a cuatro años sobre la relación entre los componentes cognitivos y emocionales del bienestar subjetivo (SWB) y el desempeño laboral. Nuestra hipótesis se refiere a la relación positiva entre estas variables y el desempeño laboral. La muestra estuvo formada por 170 managers de una empresa española de tecnologías de la información y la comunicación (TIC). El componente cognitivo de SWB se evaluó con la Escala de Satisfacción con la Vida (SWL) y el componente emocional con la escala SPANE. Dos calificaciones independientes, una del supervisor directo y otra del manager de recursos humanos, sirvieron para evaluar el desempeño laboral durante cuatro años consecutivos. Los resultados mostraron que los dos componentes de SWB predijeron el desempeño laboral durante los cuatro años. Además, cuando los dos componentes se incluyen en una ecuación de regresión, la validez aumenta con el tiempo como consecuencia de un efecto supresor sobre el componente cognitivo del SWB. Finalmente, se discuten las implicaciones para la teoría y la práctica de SWB en el trabajo.
Palabras clave
Satisfacción con la vida, Emociones positivas, Bienestar subjetivo, Desempeño laboral, Efecto supresor.Keywords
Life satisfaction, Positive emotions, Subjective well-being, Job performance, Suppressor effect.Cite this article as: Salgado, J. F. , Blanco, S. , & Moscoso, S. (2019). Subjective Well-being and Job Performance: Testing of a Suppressor Effect. Journal of Work and Organizational Psychology, 35, 93 - 102. https://doi.org/10.5093/jwop2019a9
Correspondence: silvia.moscoso@usc.es (S. Moscoso).The Human Relations Movement of the 1930s popularized the belief that happy workers were on average more productive than less happy or unhappy workers (Cropanzano & Wright, 2001; Wright, Cropanzano, & Bonnett, 2007). This view is usually known as the happy-productive worker hypothesis (HPWH), and both researchers and practitioners have become persuaded that it is essentially correct. Happy workers have been frequently conceptualized as the individuals scoring higher in job satisfaction scales and several meta-analytic studies examined the prediction that there was a positive correlation between job satisfaction and job performance. The first meta-analysis, by Iaffaldano and Muchinsky (1985), found an average observed correlation of .17 between job satisfaction and individual performance. A second meta-analysis, by Judge, Thorensen, Bono, and Patton (2001), found an average observed correlation of .18 (ρ = .30 when corrected for measurement error in both variables), although the magnitude of the relationship between job satisfaction and job performance was moderated by the study design (cross-sectional vs. longitudinal). In the case of longitudinal designs, the observed correlation was .14 (ρ = .23), and it was .18 (ρ = .31) for the cross-sectional designs. Other studies have used measures of job burnout, job involvement, engagement, positive affect, neuroticism, and climate to characterize happy workers (Chernyak-Hai & Tziner, 2016; Fisher, 2010; Haider, Jabeen, & Ahmad, 2018; Johnson, Machowski, Holdsworth, Kern, & Zapf, 2017; Mañas, Alcaraz, Pecino, & Limbert, 2016; Maslach, Schaufeli, & Leiter, 2001; Medrano & Trógolo, 2018; CattinMehmet, Orhan, Rijsman, van Dijk, 2016; CattinOlaniyan, & Hystad, 2016; Perilla-Toro & Gómez-Ortiz, 2017; Raman, Sambasivan, & Kumar, 2016). With regard to the burnout components, the meta-analysis of Taris (2006) found a negative correlation of -.22 between emotional exhaustion (a component of burnout syndrome) and performance. As a whole, the meta-analytic evidence mentioned above provides some support for the HPWH. An alternative approach to examining the predictions of the HPWH has been typically associated with the study of subjective well-being (SWB), defined as the cognitive and affective evaluations that the individuals make of their lives, i.e., how individuals think and feel about their own lives and work (Diener, 2000; CattinDiener, Oishi, & Lucas, 2003; CattinElfering, Odoni, & Meier, 2016; Veenhoven, 1997). This second line of research has been focused on broad, global measures of satisfaction (e.g., life satisfaction) rather than on specific-job related measures of satisfaction (e.g., job satisfaction). SWB has been conceptualized as a construct consisting of two main components: a cognitive component (CSWB) referring to the judgments of the satisfaction with life, and an emotional component (ESWB) referring to the balance between the levels of positive and negative feelings and affects experienced by an individual (Diener & Biswas-Diener, 2008; Diener et al., 2009; Veenhoven, 1997; Warr, 2013; Wright & Bonnett, 2007). The two components are highly correlated but they can be distinguished both conceptually and theoretically. For this reason, Diener et al. (2003) suggested that they should be measured and studied independently. Both components of SWB fluctuate over time, but the ESWB fluctuates more than the CSWB (Cropanzano & Wright, 1999; Diener et al., 2003). The CSWB is a judgment or evaluation about different aspects of an individual’s life as a whole, including work, family, health, and leisure domains, among others (Diener, 2000; Diener & Biswas-Diener, 2008; Diener, Emmons, Larsen, & Griffin, 1985; Diener et al., 2003; Fisher, 2010; Larsen, 2009). The CSWB has received, for instance, labels such as life satisfaction (Diener, 2006; Diener et al., 1985) and happiness (Lyubomirsky & Lepper, 1999). In the SWB research tradition, happiness refers to the judgments made about satisfaction with life as a whole and, therefore, happiness and life satisfaction have been considered as equivalent constructs (Wright & Bonnett, 2007). The CSWB is typically assessed with scales which include items like “In most ways, my life is close to my ideal” and “I am satisfied with my life”, “In general, I consider myself a very happy person”. Examples of these scales are the 5-item Satisfaction with Life Scale (SWLS; Diener et al., 1985), the 1-item Global Happiness scale (GHS; Fordyce, 1988), the 4-item Subjective Happiness Scale (SHS; Lyubomirsky & Lepper, 1999); the 18-item Well-Being Scale (WBS; Tellegen, 1982), and the Oxford Happiness Questionnaire (OHQ; Hills & Argyle, 2002). On the other hand, the ESWB has been conceived as the frequency and intensity of positive affective states and the absence of negative feelings the individuals experience as a reaction to situational conditions (Diener & Biswas-Diener, 2008). The ESWB is frequently assessed with items reflecting mood and feelings. For instance, “Report how much you have felt of the following feelings during the past four weeks: positive, negative, good, bad, stressed....” Typically, the ESWB is measured as a single dimension, with the positive pole anchored with items like “happy” and “positive” and the negative pole anchored with items like “unhappy” and “negative”. Therefore, as Wright and Bonnet (2007, p. 144) pointed out, to be high in the ESWB means “to be simultaneously low on negative emotion and high on positive emotion.” Examples of the scales used to assess ESWB are the 12-item Positive and Negative Experience scale (SPANE; Diener & Biswas-Diener, 2008; Diener, et al., 2009), the Index of Psychological Wellbeing (IPWB; Berkman, 1971), and the Profile of Mood States (POMS; Heuchert & McNair, 2012; CattinMcNair, Lorr, & Dopleman, 1971; Shacham, 1983). A relevant characteristic of the studies included in the meta-analyses cited above (e.g., Iaffaldano & Muchinsky, 1985; Judge et al., 2001; Taris, 2006) is that the happy worker was mainly identified as a job-satisfied, job-involved, engaged, and burnout-free worker. All these constructs correlated moderately with SWB, but they did not capture the whole variance of the two components of SWB. For example, the meta-analysis of Tait, Padgett, and Baldwin (1989) found an average observed correlation of .35 (ρ = .44 when corrected for measurement error in both variables) between job satisfaction and life satisfaction. Moreover, Judge and Watanabe (1993) found that the correlation between job satisfaction and life satisfaction was smaller for the longitudinal correlations in comparison with the cross-sectional correlations (.30 vs. .42, respectively). Additional evidence of the moderate correlation between job satisfaction and life satisfaction was provided by Bowling and Burns (2010). They found that job satisfaction correlated .50 with the SWLS (Diener et al., 1985), showing that the two constructs are related but independent. Three additional findings on the relationship between job satisfaction and life satisfaction are relevant for the present study. First, in a longitudinal study Judge and Watanabe (1993) found that the relationship between life satisfaction and job satisfaction was stronger over time than the relationship between job satisfaction and life satisfaction (betas .26 and .07, respectively). This result suggests that life satisfaction is a more powerful antecedent of job satisfaction than the other way round. The second finding was that the relationship between life satisfaction and job satisfaction was partially explained by personality factors, suggesting that, when controlled for personality, the relationship between life satisfaction and job satisfaction can be smaller. In fact, the correlation between these two variables dropped by 50% in longitudinal studies and 40% in cross-sectional studies (Heller, Judge, & Watson, 2002). A third important finding was that what distinguishes life satisfaction from job satisfaction is that the former seems to be more stable over time than the latter. Heller et al. (2002) found that the correlation between the same measures of life satisfaction taken six-months apart was .82, while the correlation for two measures of job satisfaction was .66. From a theoretical point of view, there are at least four good reasons to expect a positive relationship between SWB and job performance. First, SWB measures, such as life satisfaction scales, can capture variance of the job performance domain which is not captured by job satisfaction because there are behaviors at work which are not related to job satisfaction but to the satisfaction with other important aspects of life, such as health and family relations. Second, as SWB is a broader construct than job satisfaction (Wright & Bonnett, 2007), SWB may be more related to broad measures of job performance (e.g., overall job performance) than to specific-contextualized performance facets (e.g., citizenship behaviors, contextual performance), which might be more related to specific-contextualized measures of satisfaction (e.g., job satisfaction). Two lines of evidence give some support to this rationale. The meta-analysis by Griffeth, Hom, and Gaertner (2000) showed that the broader factor of job satisfaction explained more variance of job turnover than the narrower job satisfaction subdimensions (e.g., satisfaction with task, salary, coworkers, surpervisor, etc). Likewise, research on the personality at work has found that global factors of personality (e.g., the Big Five and integrity compounds) showed larger validity than the facets of personality when these last variables are residualized (Salgado, Moscoso, & Berges, 2013; Salgado et al., 2015). Due to the connections between life satisfaction and personality (Heller et al., 2002), the same can be expected to apply to the relationship between life satisfaction and job performance. Third, due to the fact that life satisfaction is more stable than job satisfaction (Heller et al., 2002), the relationship of life satisfaction with job performance may be more stable over time. Fourth, as some studies have suggested that the effect of life satisfaction on job satisfaction is stronger than the effects of job satisfaction on life satisfaction, the relationship between job satisfaction and job performance can be partially due to the effects of life satisfaction. In summary, there are theoretical reasons for expecting a positive relationship between job performance and SWB and its components. Table 1 Studies Examining the Relationship between the SWB Components and Job Performance 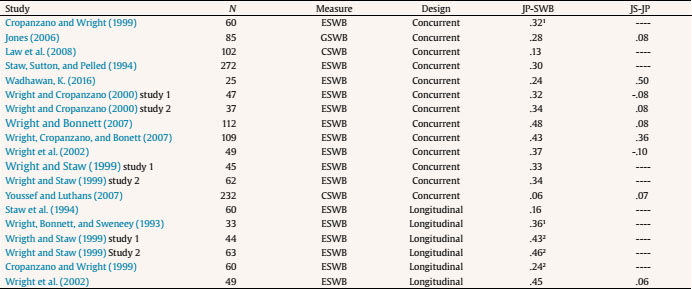 Note. 1Average of two correlations; 2average of five correlations; JP-SWB = correlations between job performance and subjective well-being; JS-JP = correlation between jobsatisfaction and job performance. Compared with other SWB research areas (e.g., the SWB-health relationship), the relationships between the SWB and its components with job performance have received less attention from researchers. Nevertheless, there are several cross-sectional and longitudinal studies (see Table 1). With regard to the cross-sectional research, Wright and Cropanzano (2000) conducted two independent studies (n = 47 and n = 37) in which they found that ESWB and job performance correlated (r = .32 and r = .34). In the same study, job satisfaction correlated -.08 and .08 with job performance. In a second study, Wright and Bonnett (2007) found that ESWB was positively correlated with job performance (r = .48, p < .01) but that job satisfaction was not related (r = .08, p > .05) in a sample of 112 management personnel. In another study, Wright et al. (2007) found that ESWB and job satisfaction correlated with job performance (r = .43 and r =.36, respectively) in a sample of 109 managers .They also found that ESWB moderated the relationship between job performance and job satisfaction. With regard to the relationship between CSWB and job performance, it has scarcely been researched. Law, Chin-Sum, Guohua, and Xiaoxuan (2008) found that the CSWB component did not correlate significantly with job performance in a sample of R&D scientists (r = .13, n = 102). Finally, Jones (2006) found that a generalized SWB compound (GSWB), which included both the cognitive and emotional components, showed significant correlations of .27, .24, and .28 with task, contextual, and overall job performance, respectively. Jones also found that job satisfaction did not significantly correlate with any of the three measures of job performance. Unfortunately, Jones did not report separately the correlation of job performance with the cognitive and the emotional components of SWB. There is also a small number of longitudinal studies. For example, Wright, Bonnett, & Sweeney (1993) found that ESWB predicted job performance significantly for a 1-year interval, but it was a nonsignificant predictor for a 2-year interval (r = .48 and r =.23, respectively) in a small sample of supervisors (n = 33). In another study, Wright and Staw (1999) reported two independent small-sample studies in which they found that the ESWB correlated significantly with job performance. In the first study, they found that the ESWB correlated significantly with job performance rated one, two, and three years after the assessment of affect (n = 44). In the second study, Wright and Staw (1999) found that the ESWB correlated with performance rated one year later (n = 63). In another 5-year longitudinal study, Cropanzano and Wright (1999) found that the correlation between the ESWB component and job performance diminished when the ESWB had been assessed 4.5 or 5 years before job performance, but that the correlation was significant when the interval was two or three years. In a 2-year predictive study, Wright, Cropanzano, Denney, and Moline (2002) found that ESWB predicted job performance at time 1 and time 2 (r = .37 and r = .45, respectively) in a small sample of public sector management employees (n = 49). In the same study, job satisfaction did not correlate with job performance (r = -.10 and r = .06, respectively). Table 1 summarizes the extant empirical evidence on the relationships between SWB and its two components with job performance. This evidence shows that: (1) the number of studies is small and they generally include small sample sizes; (2) the ESWB was a significant predictor of job performance in the majority of studies; (3) the relationship between GSWB and job performance was examined in only one cross-sectional (concurrent) study; (4) the relationship between the CSWB and job performance was examined in two cross-sectional (concurrent) studies only; (5) in all cases, the SWB measures showed a larger correlation with job performance than job satisfaction when the two variables were assessed in the study; (6) the design type (predictive vs. cross-sectional) moderated correlations between SWB and job performance, the correlation size for the predictive designs being smaller; (6) no predictive studies have examined the relationship between CSWB and job performance; and (7) the correlation between ESWB and job performance seems to decay over time (after 4.5-5 years). For this last reason, some researchers have suggested that more longitudinal and predictive research about the association between individual SWB and job performance was needed (e.g., Cropanzano & Wright, 1999; CattinSpector, Chen, & O’Connell, 2000; CattinTaris & Scheurs, 2009; Warr, 2013). Based on this research review, it becomes apparent that most of the studies on the SWB-job performance relationship evaluated ESWB and no study has examined the relationship of ESWB and CSWB with job performance separately (the study of Jones, 2006 measured ESWB and CSWB but the measures were combined in a compound and the correlations were not reported separately).Therefore it remains unexplored whether or not one of the two SWB components shows incremental validity over the other component for predicting job performance. In other words, previous research has not tested the joint relationship of the two elements of SWB to job performance and whether this joint relationship is maintained or decreases over the years. In summary, the purpose of this study is to shed further light on the relationship between SWB and job performance over time by including measures of the two components of SWB and independent measures of job performance. More specifically, the objective of this research is to examine the correlation between CSWB and ESWB and job performance using a predictive design in which job performance was appraised in four-time points over four consecutive years. Additionally, we aim to establish whether the two components of SWB contribute independently to the prediction of job performance, and whether the effect remains relatively stable over the four years. With these goals in mind, we posit the following two hypotheses: Hypothesis 1: The two components of SWB (i.e., CSWB and ESWB) predict job performance concurrently and over time. Hypothesis 2: The joint effect of ESWB plus CSWB is larger than the effect of either of them considered separately. In the present study, we are interested in the relationship between SWB and job performance from both operational (e.g., personnel selection) and theoretical (e.g., modelling the SWB-performance relations) point of views. Therefore, we will report the corrected correlations among the study variables as well as the observed correlations. Participants The sample consisted of 170 managers working for a Spanish information technology and communication (ITC) company. There were 119 men and 51 women. The participants had been working at the company for an average of 8.6 years. All of them held a high school diploma or a university degree. Measures Subjective well-being measures Cognitive component of SWB. This component was assessed with the Satisfaction with Life Scale (SWLS; Diener et al., 1985). It consists of 5 items that evaluate the perception of one’s life satisfaction. Examples of items are “In most ways, my life is close to my ideal” and “The conditions of my life are excellent”. The SWLS uses a seven-point Likert format. The SWLS is probably one of the most-used scales for measuring happiness, and a large number of studies have examined its psychometric properties. Pavot and Diener (1993) revised the evidence on its internal consistency and temporal stability and reported alpha coefficients ranging from .79 to .89, and test-retest coefficients ranging from .84 to .54 for intervals from 1 month to 4 years. This scale has been validated with Spanish samples and normative data are available (Vazquez, Duque, & Hervás, 2013). The mean and the SD of the normative Spanish sample of currently employed adults (n = 1,807) were 24.33 and 5.63, respectively. The reliability (Cronbach’s alpha) of the SWLS in the current sample was .89. The comparison between the SD of the current sample and the SD of the Spanish normative of the SWLS showed some degree of range restriction (u). It is well known that range restriction produces an underestimation of the correlation size, and can be corrected using statistical formulas (Hunter, Schmidt, & Le, 2006; Schmidt & Hunter, 2015). In the present sample, we found a u value of .78 and used this estimate for correcting the observed correlations for range restriction. Emotional component of SWB. To measure this component we used three positive descriptors and three negative descriptors of the Scale of Positive and Negative Experience (SPANE; Diener & Biswas-Diener, 2008; Diener et al., 2009; Li, Bai, & Wang, 2013; Silva & Caetano, 2013). The positive descriptors were contented, happy, and joyful. The negative descriptors were afraid, angry, and sad. We reversed the score of the negative descriptors to obtain a global measure of positive emotions. This decision was based on previous research findings which show that the correlation between positive and negative emotions approaches -1 when the observed correlations are corrected for measurement error. For example Diener et al. (2009) reported a correlation of -.62 between the two scales, and test-retest reliabilities of .62 and .63 for positive and negative emotions, respectively. The corrected correlation is .62/(.62 + .63)1/2 = .97. Similar correlations between positive and negative emotions were reported in literature (e.g., Li et al., 2013; Rahm, Heise, & Schuldt, 2017; Silva & Caetano, 2013; Telef, 2015) and identical or larger test-retest reliabilities (Rahm et al., 2017; Telef, 2015) depending on the interval width. Additionally, large correlations between SWLS and SPANE have been found (e.g., Li et al., 2013; Silva & Caetano, 2013; Rahm et al., 2017; Telef, 2015). The respondents indicated how much they had experienced these feelings during the four weeks previous to the testing session. In the SPANE the items are responded by using a five-point Likert scale (1 = very rarely or never, 5 = very often or always). The alpha coefficient was .82 in this sample. Job performance. In organizations, individual job performance is typically assessed using ratings (Viswesvaran, Ones, & Schmidt, 1996) and this is the case in the current company. The measurement instrument of job performance was a one-item overall performance rating scale. The question rated was “Overall, the performance of this employee over the past year was…” Employees were rated using a 5-point scale, ranging from 1 (poor performance) to 5 (excellent performance). Two independent supervisors rated each employee, and the two scores were added to create an overall performance composite. We collected the performance ratings for four years (2009, 2010, 2011, and 2012). The organization uses the performance ratings for administrative purposes, and they serve as a basis for additional compensation. The organization conducts a performance appraisal once a year during the spring following the end of the previous year. Therefore, the performance appraisals were done in the springs of 2010, 2011, 2012, and 2013. According to Schmidt and Hunter (1996), the reliability estimate of interest in the present case is the inter-rater coefficient. The inter-rater reliabilities of the four composite measures were .77, .76, .73, and .71 for 2010, 2011, 2012, and 2013, respectively. These coefficients are larger than the typically observed interrater reliability coefficients of job performance (e.g., Salgado & Moscoso, 1996; Salgado, Moscoso, & Anderson, 2016; Viswesvaran et al., 1996). We will use these coefficients to correct the observed correlations for measurement error in the criterion (Schmidt & Hunter, 1996). Procedure We collected the performance data used in this study at four time periods: T1 (performance from January 1, 2009 to December, 31, 2009; the first year of the survey), T2 (performance from January 1, 2010 to December, 31, 2010, second year), T3 (performance from January 1, 2011 to December, 31, 2011, third year), and T4 (performance from January 1, 2012 to December, 31, 2012, fourth year). Therefore, the interval between two consecutive performance appraisals was a year. We assessed SWB components in May 2010 concurrently with the first performance appraisal. Job performance ratings were available for all time points and the SWB measures at T1 only. The correlations between the SWB measures and job performance at T1 are concurrent and the correlations at T2, T3, and T4 are predictive ones. Table 2 Descriptive Statistics and Correlations among Subjective Well-Being and its Components with Job Performance 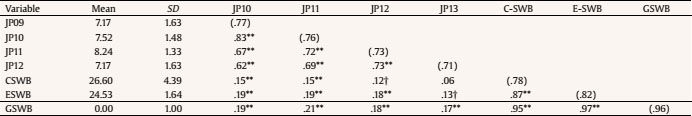 Note. JP10 = job performance assessed in 2010; JP11 = job performance assessed in 2011; JP12 = job performance assessed in 2012; JP13 = job performance assessed in 2013; CSWB= cognitive component of subjective well-being; ESWB = emotional component of subjective well-being; GSWB = general well-being (composite score of CSWB plus ESWB, based on a principal component analysis). Coefficients on the main diagonal are reliability coefficients (internal consistency coefficients for CSWB, ESWB, and GSWB and interrater reliabilities for job performance). †p < .10, *p < .05, **p < .01. In Table 2, we report the descriptive statistics (mean and standard deviation) and observed correlations (Pearson’s r), among all the study variables. As can be seen, the cognitive and emotional components of SWB correlated highly (r = .87). These results agree with previous findings, which showed that the cognitive and emotional components of SWB are highly correlated. Based on this correlation and for theoretical reasons, a GSWB compound was created on the basis of a principal component analysis. ESWB correlated significantly with job performance across the four years, giving full support to Hypothesis 1 and agreeing with the finding by Cropanzano and Wright (1999) that the emotional component predicted job performance over a period of four years. With regard to the relationship between CSWB and job performance, the measure taken in 2010 predicted job performance significantly in 2010, 2011, and 2012, but the correlation was not significant in 2013. This result partially supports Hypothesis 1. Finally, the GSWB correlated significantly with job performance during the first three years but not in the fourth year. As a whole, these findings indicate that GSWB, CSWB, and ESWB maintained their predictive capacity for at least the first three years. As is well-known, the observed correlations underestimate the true correlation between the variables. Particularly, two artifacts influence the real size of the correlations. The first one is that the predictors and job performance were not perfectly reliable measures (Hoyle & Kenny, 1999; MacKinnon, 2008; Schmidt & Hunter, 2015). The second artifact is the effect of range restriction (RR) on the predictors. As the coefficients reported in Table 2 are uncorrected estimates of the true correlation between each pair of variables, all these coefficients underestimate the “true” relationships among CSWB, ESWB, GSWB, and job performance. To correct for measurement error in X and Y, we used the formula to correct observed correlation for attenuation (e.g., Guilford & Fruchter, 1978; Kline, 2011; MacKinnon, 2008; Schmidt & Hunter, 2015). This formula requires knowing the reliability coefficient of ESWB and CSWB and the reliability coefficient of job performance. We calculated the internal consistency of the ESWB and CWSB scales for the current sample, that are reported in Table 2. With regard to job performance, the relevant coefficient is the interrater one (Schmidt & Hunter, 1996). Several meta-analyses (e.g., Salgado & Moscoso, 1996; Salgado et al., 2016; Viswesvaran et al., 1996) have shown that the observed inter-rater reliability of job performance ratings was .52 on average. The inter-rater reliability coefficients found in this study are remarkably larger (from .71 to .77), but show that the performance ratings contained a measurement error. With regard to RR, we used the method to correct for indirect RR developed by Schmidt and his colleagues (Hunter et al., 2006; Schmidt & Hunter, 2015; Schmidt, Shaffer, & Oh, 2007). The formulas of RR correction required knowing the degree of homogeneity presented in the sample, indicated by the u value. As was mentioned previously, u was .78 for CSWB in this study, and we assume the same value for ESWB (as we do not have normative data for calculating its specific u value). In summary, the artifacts considered here were criterion reliability, predictor reliability, and RR in the predictors. The three artifacts reduce the real size of the correlations and their effects are cumulative (Schmidt & Hunter, 2015). In this study, we corrected the observed correlations for criterion reliability and RR in the SWB measures in order to obtain their operational validity, and also we corrected the operational validity for predictor reliability to obtain the true correlation. The operational validity is the coefficient to be used for predicting the various criteria in applied settings (e.g., for hiring employees or recruiting students). True validity represents the theoretical correlation between predictor and criterion in the absence of artifactual errors. Consequently, true validity is used for modeling the theoretical relationships between predictors and criteria (Salgado et al., 2003). Although both estimates of validity are of interest, we will concentrate on the true validity in the following comments. In Table 3, we report the corrected correlations between the two components of SWB and the four measures of job performance. Table 3 Corrected Correlations between Job Performance and the Two Components of SWB 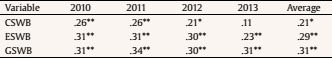 *p < .05, **p < .01. As can be seen in Table 3, true correlations of ESWB are about 70% larger on average than observed correlations (.28 vs. .17 on average) and the correlations of CSWB are 75% larger on average (.18 vs. .12 on average). In other words, observed correlations underestimate true correlations of ESWB and CSWB with job performance by 70% and 75%, respectively. These results show the importance of taking into account the effects of these three statistical artifacts when the SWB-job performance relationships are to be modelled. The true correlation between ESWB and job performance was statistically significant in the four years, ranging from .31 to .23. As found by Cropanzano and Wright (1999), the size of the correlations decline from T1 to T4. In the case of CSWB, the correlations were significant for three years (T1-T3) and nonsignificant for the last year, ranging from .26 to .11. As in the case of ESWB, there was also a decline in the size of the correlations from T1 to T4. Interestingly, the correlations of ESWB and CSWB with job performance remained totally stable for the first two years, which suggests that the prediction of job performance by SWB is stable at least for two years. GSWB correlated significantly in the four years and no decline in the correlation size was observed (it was .31 for T1 and T4). In order to test the second hypothesis, we carried out a series of multiple regression analyses. More and more methodologists advise researchers that measurement error and range restriction (when appropriate) should be controlled (corrected) when multiple regression, structural equation modelling, and other multivariate techniques are used to analyze the relationships among dependent (criterion) and independent (predictors) variables (e.g., Fritz, Kenny, & MacKinnon, 2016; Hoyle & Kenny, 1999; MacKinnon, 2008; Schmidt & Hunter, 2015). The basis for the recommendation is that the imperfect measurement of X and Y, and range restriction produce a violation of some fundamental assumptions of multiple regressions and, consequently, the parameters estimated are biased, for instance, reducing the squared multiple correlation and the size of the standardized regression weights (betas). In other words, the researcher must be sure that the variables are perfectly reliably, and, therefore, the observed correlations must be corrected for measurement error in both variables, X and Y (Fritz et al., 2016; Hoyle & Kenny, 1999; Schmidt & Hunter, 2015). Tabla 4 Multiple Regression Analysis of the Joint Relationship of the two SWB Components with Job Performance 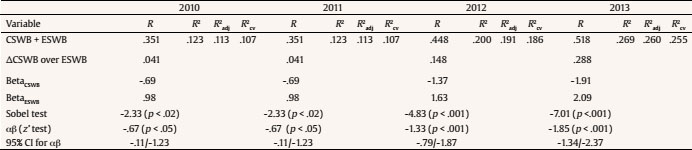 Note. R2cv = statistical estimated of the population squared cross-validated multiple correlation; R2 adj = adjusted square multiple correlation. Together with the measurement error and range restriction, another important issue in multiple regression analysis is that R, R2, and adjusted R2 are biased due to the fact that the multiple regression analysis capitalizes on chance. A consequence of this capitalization on change is that if the regression coefficients obtained in a sample are applied to another sample, the R2 size in the second sample will be typically lower than that estimated in the first sample. A more efficient estimate of the effect size is the squared population cross-validity coefficient (R2cv), which can be obtained by empirical methods (e.g., cross-validation, bootstrapping) and by formulae, although there is agreement that formulae provide the best estimates of R2cv (e.g., Kromrey & Hines, 1996). Monte Carlo examinations of the effectiveness of various R2cv formulas agreed that the one proposed by Browne (1975) outperformed other formulae (Cattin, 1980a, Cattin1980b; Cotter & Raju, 1982; Kromrey & Hines, 1996; Lautenschlager, 1990; Yin & Fan, 2001). Therefore, we used Browne’s formula for estimating the squared population cross-validity in this study. Table 4 presents the multiple regression analyses conducted to examine the joint effect of the two components of SWB, and the incremental validity of CSWB over ESWB for predicting job performance across the four years. The table presents the multiple correlation (R), the explained variance (R2), the adjusted R2, the statistical estimate of the cross-validated square multiple correlation (R2cv), the betas for ESWB and CSWB, and the incremental variance of CSWB. As can be seen, in all cases, the multiple correlation is larger than the bivariate correlation of the two SWB components considered separately. A second relevant finding is that the size of the multiple correlation increases as the interval between the measure of SWB and job performance increase, so that the larger the interval, the higher the multiple correlation. In other words, in the present case, the joint predictive capacity of the two SWB components increases over time. This is an important finding if we take into account that the zero-order correlation of the two SWB components declines with time. In fact, the multiple correlation for T4 is noticeably large. A relevant result is that the statistical estimate of the cross-validated square multiple correlation (the square root of R2cv) is larger than the correlation of GSWB with job performance and it is especially larger at T3 and T4. This finding suggests that the prediction based on the regression equation is more valid than the prediction based on a single measure of GSWB. Examining beta weights, it can be seen that the beta weights for ESWB are positive as are their correlation signs in all cases. However, the betas for CSWB showed a negative value when its zero-order correlation with job performance is positive. In addition, it can be seen that the sizes of CSWB and ESWB betas increase as the interval between the measure of CSWB and ESWB and job performance appraisal increase. These facts indicate that CSWB is acting as a suppressor variable for the prediction of job performance in the presence of ESWB. As described initially by Horst (1941), a predictor was considered a suppressor variable if it has zero or very small correlation with the dependent variable, but simultaneously shows a large correlation with another predictor variable included in a regression equation (Collins & Schmidt, 1997; Guilford & Fruchter, 1978; MacKinnon, Lockwood, Hoffman, West, & Sheets, 2002; McNemar, 1962; Paulhus, Robins, Trzesmewski, & Tracy, 2004; Watson, Clark, Cmielewski, & Kotov, 2013). Now, this situation is termed classical suppression (Cohen & Cohen, 1975; Conger, 1974; Paulhus et al., 2004; Watson et al., 2013). However, the concept of suppressor variables has been extended to include other two configuration patterns (Cohen & Cohen, 1975; Conger, 1974). The second pattern is reciprocal or cooperative suppression, which involves cases in which two predictors either (a) correlate oppositely with the criterion, but are positively related to one another or (b) both are correlated positively with the criterion but negatively with one another; in these cases, including both predictors in the regression equation increases both of their beta weights. The third pattern is the net or cross-over suppression which refers to situations where three variables (i.e., X, S, and Y) are correlated positively with one another. In this last situation, the inclusion of both predictors (i.e., X and S) in the regression equation increases the weight for the stronger predictor and changes the sign of the weaker predictor (i.e., a positive zero-order correlation becomes a negative beta weight). MacKinnon, Lockwood, and Williams (2007) pointed out that a suppressor effect is a kind of indirect effect and as such often indicates an implicit, and sometimes an explicit, causal hypothesis. The suppressor effect suggests that the presence of this variable in a regression equation increases the predictive power of an independent variable over the dependent variable. Consequently, the statistical tests for suppressor effects are part of a family of tests for intervening variables (MacKinnon et al., 2002; Paulhus et al., 2004). Specifically, the test for a significant suppressor effect (i.e., a significant increase in a regression weight) is equivalent to tests for a number of other statistical hypotheses, including confounds, spuriousness, and mediating variables (Baron & Kenny, 1986; MacKinnon, 2008; MacKinnon et al., 2002; Sobel, 1982; Watson et al., 2013). Mackinnon et al. (2002) carried out an empirical comparison of a comprehensive set of statistical tests based on normality assumptions. Overall, they recommended: (a) testing significance by evaluating the product of the two indirect path weights (e.g., the Sobel test and the z’ test). More recently, the estimation of confidence intervals has been recommended for a number of reasons, for instance, that it obliges researchers to consider the effect size together with making a binary decision on the statistical significance of the relationship between X and Y, and because the amplitude of the interval provides valuable information about the variability of the effect size (Harlow, Mulaik, & Steiger, 1997; MacKinnon, Lockwood et al., 2007; Schmidt & Hunter, 2015). Moreover, MacKinnon and his colleagues (MacKinnon et al., 2002; MacKinnon, Lockwood et al., 2007) have shown that the most frequently used methods for testing the statistical significance of indirect effects (e.g., the Sobel test and its relatives), based on the z distribution have low statistical power, low Type I error rates, and imbalanced confidence limits. We computed the Sobel test and the z’ test in order to test the statistical significance of the suppression effects. For the Sobel test, we used a calculator developed by Preacher and Leonardelli which is available online at http://www.quantpsy.org/sobel/sobel.htm. We also computed the 95% confidence interval for the suppressor effect using the distribution of the product of two regression coefficients (z’ test). In this case, we used the program PRODCLIN developed by MacKinnon, Fritz, Williams, and Lockwood (2007). In Table 4 it can be seen that the Sobel test and the z’ test are statistically significant for the four years and also the 95% confidence intervals did not include a zero value. In other words, in the four cases the positive effect of ESWB on job performance was significantly stronger when CSWB was included in the regression equation. Simultaneously, the negative effect of CSWB was significantly stronger when ESWB was in the equation. The finding that CSWB suppresses some ESWB variance has been an unexpected result that has both relevant theoretical and applied consequences. For instance, these results support Diener’s suggestion that both components of SWB should be assessed and measured independently. Later we discuss some potential explanations for this suppressing effect. The basis of the present research was the theoretical distinction suggested by Veenhoven (1997), Diener (2000), and Warr (2013), among others, who defined SWB as an individual’s affective and cognitive evaluation of their life. From their point of view, SWB consists of the combination of positive affective states (ESWB) and global life satisfaction or happiness (CSWB). A large number of empirical studies supported this theoretical framework (see Diener & Biswas-Diener, 2008; Fisher, 2010, for reviews). This line of thought on SWB is related to a popular hypothesis in the domain of work psychology and labor relations known as the Happy-Productive Worker Hypothesis, which was introduced to psychology by the Human Relations Movement of the 1930s (Wright & Bonnett, 2007). At least ten studies have examined the relationship between the ESWB and job performance and two studies have examined the relationship between CSWB and job performance. Unfortunately, no research has examined the relationships of ESWB and CSWB with job performance separately and jointly over time in the same study. Furthermore, the majority of the recent research has primarily been cross-sectional in nature, although a small number of longitudinal studies have been carried out (e.g., Cropanzano & Wrigh, 1999; Wright et al., 2007; Wright & Staw, 1999). The present study, guided by hypotheses, contributes to the literature on the relationship between SWB and job performance in four ways. Firstly, our study contributes by using measures which are well-validated and specifically developed for assessing the two components of SWB, and were used simultaneously. Secondly, our study uses a predictive design with four-time points over four years, which allows us to estimate the capacity of the two SWB components for predicting overall job performance over time. To the best of our knowledge, no other study has examined the relationship between job performance and the two SWB components simultaneously over time. Third, our study contributes by examining the joint predictive validity of CSWB and ESWB. Fourth, using the performance appraisal for four consecutive years we also have been able to partially examine the stability of the overall job performance. The results fully supported our hypotheses regarding the capacity of the two SWB components for predicting job performance independently, although their effect sizes are relatively modest. ESWB predicted job performance during the four years of our study and CSWB predicted job performance significantly for the first three years. Consequently, we can conclude that the effects of the SWB components taken individually are relatively stable over time. This result partially agrees with the findings of Cropanzano and Wright (1999), who found that ESWB predicted job performance for four years, although it was not a significant predictor in the fifth year. We have not been able to collect job performance ratings for the fifth year, which impedes the comparison with Cropanzano and Wright’s findings. Another relevant finding was that a factorial compound of SWB showed larger and more stable validity than ESWB and CSWB over the years. Our results also confirm that the two components of SWB added specific variance for predicting job performance, as stated in Hypothesis 2. In all cases, the multiple Rs are larger than the zero-order correlations of ESWB, CSWB, and GSWB. The joint effect of ESWB and CSWB showed a larger predictive capacity than the single components of SWB and a compound of the two. This last finding is related to an important but unpredicted finding. The joint effect of EWSB and CWSB shows the pattern of a suppression situation (Paulhus et al., 2004; Watson et al., 2013). More specifically, the suppression situation found here is of the type called cross-over suppression by Paulhus et al. (2004), negative suppression by Conger (1974), and net suppression by Cohen and Cohen (1975). In the cross-over suppression situation, the independent, suppressor, and dependent variables are positively correlated, which suggests a redundant situation. However, as Paulhus et al. (2004, p. 307) pointed out, in this case, “a suppression situation is not apparent until the regression weights are calculated and the smaller beta shows an opposite sign to its validity.” The suppressor analysis has uncovered relevant variance in the cognitive and emotional SWB scales that is hidden at the bivariate level. Our findings show that the cross-over suppression situation was maintained for the four years in which job performance was measured and that the size of R2 increased over time, which is the opposite trend to the zero-order correlations between job performance and the two components of SWB. In other words, according to our results, the predictive power of the joint effects of ESWB and CSWB increases over time, while the predictive power of ESWB and CSWB decreases over time when they are individually considered. Figure 1 shows these results graphically. Figure 1 Correlations of the Four SWB Measures with Job Performance Over Time.  A tentative theoretical explanation for this finding could be as follows. As components of SWB, both CSWB (i.e., satisfaction with life, happiness) and ESWB (i.e., the balance between positive and negative feelings and emotions) correlate largely and positively. On the other hand, ESWB consists of positive and negative feelings and emotions, so two groups of highly and negatively correlated feelings are included in ESWB. Simultaneously, CSWB correlates positively with positive emotions and negatively with negative emotions. Furthermore, the positive emotions included in ESWB correlate positively with job performance and the negative emotions correlated negatively with job performance. On the other hand, because ESWB is a balance of positive and negative emotions, the presence of positive emotions inhibits (impedes) the presence of negative emotions (Wright & Bonnett, 2007). Consequently, CSWB (e.g., satisfaction with life) would act “suppressing” (avoiding) negative emotions, which, subsequently, would produce greater frequency and intensity of positive emotions and, subsequently, ESWB would have a greater effect on job performance. Moreover, as CSWB is more stable over time than ESWB, the former would have a second effect on ESWB, which would be to reinforce or improve its stability, which would make the effect of ESWB on job performance more robust (as a consequence of smaller variability) over time. In other words, increasing the stability of ESWB, CSWB also increases the relationship between ESWB and job performance because of disattenuation of the correlation for measurement error. This means that CSWB would function as an emotion regulation mechanism. The importance of suppressor situations for personality and well-being research has been noted in the last few years. For example, Collins and Schmidt (1997) found several suppressor personality variables in a validity-construct study conducted to discriminate white collar criminals from other white collar employees. Similarly, Paulhus et al. (2004) demonstrated that guilt and shame maintain a suppressing relationship for predicting depression. More recently, Watson et al. (2013) illustrated several cases of highly robust suppression effects, in which suppressor variables explain the construct validity of symptoms measures. For example, they found that, despite the fact that euphoria and well-being were substantially positively correlated, they showed opposite correlation with depression, generalized anxiety disorder, posttraumatic stress disorder, and panic. The β values for euphoria ranged from .13 to .22 and the β values for well-being ranged from -.15 to -.36. When the two predictors were used in the regression equation, the new β values for euphoria ranged from .42 to .45, whereas the new β values for well-being ranged from -.38 to -.60. In addition, the joint regression R2 increased to twice the value of the sum of individual R2s for the four dependent variables. The comparison of GSWB validity with the validity of CSWB plus ESWB illustrates the importance of taking into account the suppressor effects when the construct validity of personality measures are examined (Watson et al., 2013). Finally, examining the correlations among the overall job performance measures, we can affirm individual job performance is relatively stable over four years. This finding is especially interesting in light of the fact that the measures of job performance were done during the most dramatic period of the effects of the world economic crisis in Spain and while changes in the ownership of the company were occurring. Even in these critical conditions, the observed correlation between the measures of overall job performance for 2010 with the measures for 2013 was .62. If this estimate is corrected for the measurement error, the true correlation is .86, a remarkably large correlation that suggests high stability in performance. The findings have implications for the theory and practice of staffing and development in organizations. From the theoretical point of view, the results provide empirical support for the HPWP as well the conceptualization of SWB as composed of both emotional and cognitive components. Our results support the idea that happy workers are comparatively more productive (show better job performance) than less happy or unhappy workers. From a practical point of view, our findings suggest that organizations can improve their overall effectiveness (regarding individual job performance) by increasing worker well-being. Selecting employees on SWB can help to improve the organizational effectiveness because the joint effect of the two components of SWB over job performance remains for at least four years. Additionally, organizations can improve employee performance by creating conditions that allow them to activate positive emotions. There are two potential ways to increase the emotional component of SWB. The first one could be by increasing the frequency of positive feelings (e.g., giving positive feedback), while maintaining the frequency of negative emotions. The second way of increasing the emotional component of SWB could be by maintaining the frequency and intensity of positive emotions, while decreasing the frequency (and intensity) of the negative feelings (e.g., stress-reducing programs). For example, Rahm and Heise (2015, cited in Rahm et al., 2017) presented a four-week training program of SWB for future teachers with positive results. As all studies, the present one has some limitations which should be noted. A first limitation is that we carried out the study in a Spanish company with specific values and cultural characteristics, and we did not examine the effects of these variables. Therefore, the present findings should not be generalized to other organizations and countries without taking into account potential cross-cultural differences. A second limitation is that, although as a whole the sample size was large enough (Salgado, 1998), we were not able to examine the potential effects of gender differences, as the number of women in the sample was small. Future studies should consider this issue. A third limitation is that our design does not permit the examination of whether the relationship between SWB and job performance is mutual, whether SWB causes job performance, or whether job performance causes SWB. Although we have measured job performance in four consecutive years, SWB was assessed only in the first year, so the study cannot shed light on the direction of causality. Finally, the unexpected suppressor effect suggests another potential limitation. With some frequency, the suppressor effects vanish in a different sample. Although, the R2cv estimates suggest evidence for cross-validity, the effect should be tested in new samples. In summary, this research showed that SWB and its components jointly and individually are relevant predictors of job performance and that their effects remained for at least four years. Thus, these findings provided some support for the popular HPWH. This study also showed that individual job performance was largely stable over the period examined. Cite this article as: Salgado, J. F., Blanco, S., & Moscoso, S. (2019). Subjective well-being and job performance: Testing of a suppressor effect. Journal of Work and Organizational Psychology, 35, 93-102. https://doi.org/10.5093/jwop2019a9 [Antonio García-Izquierdo and David Aguado were the guest editors for this article]. Funding: The research reported in this manuscript was partially supported by Grant PSI2017-87603-P from the Spanish Ministry of Economics and Competitiveness. References |
Cite this article as: Salgado, J. F. , Blanco, S. , & Moscoso, S. (2019). Subjective Well-being and Job Performance: Testing of a Suppressor Effect. Journal of Work and Organizational Psychology, 35, 93 - 102. https://doi.org/10.5093/jwop2019a9
Correspondence: silvia.moscoso@usc.es (S. Moscoso).Copyright © 2026. Colegio Oficial de la Psicología de Madrid


 PDF
PDF e-PUB
e-PUB CrossRef
 JATS
JATS Print
Print SEND
SEND


