


Cross-cultural Evidence of the Relationship between Subjective Well-being and Job Performance: A Meta-analysis
[Evidencia transcultural de la relación entre el bienestar subjetivo y el desempeño en el trabajo: un metaanálisis]
Jesús F. Salgado and Silvia Moscoso
University of Santiago de Compostela, Spain
https://doi.org/10.5093/jwop2022a3
Received 8 November 2021, Accepted 12 January 2022
Abstract
This meta-analysis examined the differences across countries/regions, and the moderator effects of the study type (cross-sectional vs. longitudinal) on the SWB-job performance relationship. The database consists of 78 independent samples (N = 18,853), located through electronic and manual searches. The results showed that overall SWB (ρ = .37), cognitive SWB (ρ = .27), and affective SWB (ρ = .37) are predictors of job performance. Evidence of cross-cultural effects showed that the magnitude of the SWB-job performance relationship was larger in the Asia-Pacific region than in Europe and the US-Canada region (Asia-Pacific ρ = .41, Europe ρ = .33, USA ρ = .23). Moderator analyses indicated that, on average, cross-sectional (concurrent) and longitudinal (predictive) studies showed similar validity (ρ = .33 vs. ρ = .32). Lastly, we discuss the main contributions, and some practical implications and some limitations of the study are mentioned.
Resumen
Este metaanálisis examinó las diferencias entre países/regiones y los efectos moderadores del tipo de estudio (transversal vs. longitudinal) en la relación entre bienestar subjetivo (SWB) y desempeño en el trabajo. La base de datos consta de 78 muestras independientes (N = 18,853), localizadas mediante búsquedas electrónicas y manuales. Los resultados mostraron que el SWB global (ρ = .37), el SWB cognitivo (ρ = .27) y el SWB afectivo (ρ = .37) son predictores del desempeño laboral. La evidencia de los efectos transculturales mostró que la magnitud de la relación entre el BS y el desempeño laboral era mayor en la región de Asia-Pacífico que en Europa y en la región de Estados Unidos-Canadá (Asia-Pacífico ρ = .41, Europa ρ = .33, Estados Unidos ρ = .23). Los análisis de moderadores indicaron que, en promedio, los estudios transversales (concurrentes) y los longitudinales (predictivos) mostraron una validez semejante (ρ = .33 frente a ρ = .32). Por último, se discuten las principales contribuciones y se indican algunas implicaciones prácticas y las limitaciones del estudio.
Palabras clave
Bienestar subjetivo, Desempeño en el puesto, Diferencias transculturales, Satisfacción con la vida, Bienestar afectivo, Bienestar cognitivoKeywords
Subjective well-being, Job performance, Cross-cultural differences, Satisfaction with life, Affective well-being, Cognitive well-beinCite this article as: Salgado, J. F. and Moscoso, S. (2022). Cross-cultural Evidence of the Relationship between Subjective Well-being and Job Performance: A Meta-analysis. Journal of Work and Organizational Psychology, 38(1), 27 - 42. https://doi.org/10.5093/jwop2022a3
silvia.moscoso@usc.es Correspondence: silvia.moscoso@usc.es (S. Moscoso).Subjective well-being (SWB) has been the focus of a scientific research corpus comprising thousands of studies all across the world, and which has been – and continues to be – of interest to psychologists, economists, political scientists, neuroscientists, and philosophers. The relationships between SWB and significant life events are currently well established. For example, SWB has correlated with better health and longevity, lower alcohol consumption, higher levels of exercise and not smoking, as well as a lower probability of getting divorced and high-quality relationships with family, friends, and romantic partners (see Adler & Seligman, 2016; Boehm & Kubzanky, 2012; Diener et al., 2018; Diener & Seligman, 2002, 2004; Guven, 2012; Moore & Diener, 2019, for instance). From demographic and societal points of view, SWB has correlated with gender (men scoring higher in SWB than women), age (older people being shown to be happier than young people), gross domestic product (GDP), income, and political freedom (Diener et al., 2018). In the organizational domain, which is a focus of this article, SWB has been related to a series of critical organizational outcomes. For example, it has been found that happy workers are more likely to be more productive, to display less absenteeism, more creativity, less turnover in employment, to have better relationships with co-workers, users, and supervisors, a higher salary, lower rates of unemployment, higher job satisfaction, higher employee engagement, less sick time, higher firm earnings, financial performance, and successful relocation (see, Boehm & Lyubomirsky, 2008; Bowling et al., 2010; Diener et al., 2020; Erdogan et al., 2012; Ford et al., 2011; Harter et al., 2020; Harter et al., 2010; Harter et al., 2002; Judge et al., 2005; Lyubomirsky et al., 2005; Pujol-Cols & Lazzaro-Salazar, 2021; Sagi et al., 2021; Shockley et al., 2012; Tait et al., 1989; Taris & Schreurs, 2009; Tenney et al., 2016; Thoresen et al., 2003; Walsh et al., 2018). Recently, Moscoso and Salgado (2021) carried out the largest meta-analysis on the relationship between SWB and job performance ratings conducted until now. They examined the relationship of job performance with overall SWB, cognitive SWB, and affective SWB. They examined the moderator effects of the source of job performance (supervisor ratings vs. self-report) and, based on an explanatory model proposed by Salgado et al. (2019), they also tested a model of a suppressor relationship between cognitive and affective SWB to predict job performance. The main findings of Moscoso and Salgado (2021) were that overall SWB correlated similarly with supervisory ratings and self-reported performance (ρ = -35 and ρ = .33, respectively), although the affective component of SWB correlated higher with supervisory ratings than with self-reported performance (ρ = .49 and ρ = .30, respectively). Finally, they found support for the suppressor effect of cognitive SWB for predicting supervisory ratings. Moscoso and Salgado’s (2021) meta-analysis did not examine the potential moderator effects of cross-cultural differences. However, international research has also shown that there are differences in the level of SWB across countries, in the way in which individuals frame their well-being experiences, and in how life circumstances affect SWB (see, Diener et al., 2010; Veenhoven, 2018, 2019; Walsh et al., 2018). Therefore, national and cross-cultural differences may affect the SWB-job performance relationship. Walsh et al. (2018) pointed out that the SWB literature oversampled western, predominantly English-speaking populations, with few reviewed studies conducted in Asian samples and none in African and Central and South American samples. According to Walsh et al. (2018), it is very likely that culture moderates the relationship between SWB and organizational success in a variety of still unknown ways. They pointed out that research still needs to focus on a wider range of cultures so that the findings can be generalizable across the world. However, there is not currently a meta-analysis that clarifies if the relationship between SWB and job performance is similar across countries/cultures and if the variability of the effect sizes found in the primary studies mentioned above can be attributed to national and cultural characteristics. This last issue is the main focus of this research: to examine the cross-cultural (international) relationship between SWB and job performance. At present, it is not conclusively known if the SWB-job performance relationships found in Western societies are replicated in other societies/cultures (Boehm & Lyubomirsky, 2008; Walsh et al., 2018). Subjective Well-being In this study, we adopt Diener’s (Diener, 1984, 2000; Diener et al., 2003) conceptualization of SWB, according to which SWB refers to the cognitive evaluation and emotional balance that people make of their lives. In Diener’s approach, SWB is conceptualized as a construct consisting of two major components: a cognitive component referring to the judgments of life satisfaction and an emotional component referring to the balance between levels of positive and negative feelings experienced by the individual (Diener & Biswas-Diener, 2008; Diener et al., 2009). Diener’s conception of SWB consists, therefore, of three elements: life satisfaction, positive affect (PA), and negative affect (NA). For this reason, it is sometimes known as the tripartite model of SWB (Busseri, 2018; Tov, 2018). Overall, high SWB is, therefore, a combination of two specific factors: (1) the presence of positive affective states and the absence of negative affective states, and (2) global life satisfaction. In Diener’s research tradition, satisfaction with life is usually conceptualized as the judgmental component of SWB (Busseri, 2015, 2018; Busseri & Sadava, 2011; Diener, 2000; Diener & Biswas-Diener, 2008; Diener et al. 1985; Fisher, 2010). Typically, cognitive SWB has been assessed using different scales such as Cantril’s (1965) Self-Anchoring Striving, Diener et al.’s (1985) Satisfaction with Life scale (SWLS), Lyubomirsky and Lepper’s (1999) Happiness scale, Fordyce’s (1988) Global Happiness scale, Tellegen’s (1982) Well-being scale, and Hills and Argyle’s (2002) Oxford Happiness Questionnaire. Probably the most popular of these scales are Cantril’s Ladder and the Satisfaction with Life scale, and for this reason, cognitive SWB has also been referred to many times as satisfaction with life. This component is a judgment on or perception of different aspects of an individual’s life as a whole (Larsen, 2009). Affective SWB is conceived as the balance between the experience of positive and negative feelings as a reaction to situational conditions. Typically, affective SWB has been evaluated, for instance, with the SPANE scale (Diener & Biswas-Diener, 2008; Diener et al., 2009), the PANAS state scale (Watson et al., 1988), the Profile of Mood States (Heuchert & McNair, 2012), and the Index of Psychological Well-being scale (Berkman, 1971). Cross-cultural Evidence of Differences in SWB and Job Performance Evaluations Empirical evidence collected over the years has demonstrated that societies and cultures vary in their mean level of SWB (Diener et al., 2018; Veenhoven, 2018). For instance, research findings gathered in the World Database of Happiness (Veenhoven 2019) on SWB across nations show that, in general, European countries and Canada show higher SWB level than do the USA and East Asian countries, and that these countries, in turn, show higher SWB than African countries. Veenhoven (1989), Diener et al. (1995), and Stevenson and Wolfers (2008) found correlations of .65, .58, and .82, respectively, between cognitive SWB and gross domestic product. Diener et al. (2010) found that the happiest societies are wealthy and economically developed, and this finding was replicated across nations and within nations (Lawless & Lucas, 2011; Veenhoven, 2018). So, in general, people from the most affluent societies tend to show a higher level of life satisfaction (cognitive SWB). However, the correlation of affective SWB with GDP is smaller (r = .35) (Diener et al., 2018). Empirical research also found that SWB was related to strong support for the rule of law and human rights, less corruption, efficient and effective governments, more progressive taxation systems, more political freedoms, less unemployment, better healthcare systems, and healthier natural environments (see Diener et al., , 2015; Oishi et al., 2018; Veenhoven, 2018, for reviews). Cross-cultural research also found that the relationship between SWB and relevant work-related variables, such as gender equality, income equality, intrinsic motivation, trust in organizations, and trust in people vary across nations (Veenhoven, 2019). For instance, although SWB and job satisfaction correlated in most of the countries, there are also variations in the degree of the association between these two variables, and the differences can be partially attributed to cultural norms and values (Diener et al., 2018). In summary, research conducted over decades and in more than a hundred countries shows that they vary in their levels of overall SWB, cognitive SWB, and affective SWB (Diener et al., 2020; Veenhoven, 2018, 2019). Besides the differences in the level of SWB across countries, there are also cross-cultural differences that may influence job performance evaluations (Festing & Barzantny, 2008; Festing & Knappert, 2014; Fletcher & Perry, 2001). For example, task performance has been the core of performance assessments over the years in Western countries (Aguinis, 2019; Borman et al., 2017), but this appears not to be true in Japan, according to Nimura et al. (2000), where organizational citizenship behaviors are more explicitly expected and assessed. Related to this, Redding (1990) pointed out that the primary objective in many overseas Chinese companies is to maintain family control of the business and, consequently, performance evaluations tend to favor employees that support the family over employees that challenge the family’s authority. The organizational objectives can also differ substantially in Western and Chinese organizations, depending mainly on whether the ownership is public or private (Festing, & Knappert, 2014). Hempel (2001) mentions that Chinese state companies often had to fulfill political objectives, such as maximizing employment, and that human resources practices tend to serve these objectives. Some studies have shown that managers might use the same rating instrument similarly across cultures, but they interpret performance differently. In a study conducted in Canada, Spain, and South Korea, Ployhart et al. (2003) found that although supervisors used the performance rating scales similarly across the three countries, they also showed cultural differences in how they perceived performance. In other words, performance may be rated equivalently, but there are significant cultural differences in how performance is perceived. Bacouel-Jentjens and Brandl (2015) conducted a study comparing the responses of subsidiaries in France and Germany to the performance appraisal system from their U.S. parent company. They found that French employees focused firmly on the performance criteria and the evaluation process, while the German employees were more focused on the appraisal outcome. As well as this, in both countries, employees showed concerns about the meaning and usefulness of the American job performance evaluation system in their countries. Bacouel-Jentjens and Brandl (2015) concluded that, in Germany, the judgments in the performance appraisal were clear and explicit, while they were covert and implicit in France, leaving room for interpretation In a study carried out in Hong Kong, Hempel (2001) compared the performance views of Chinese and British supervisors working in the same organization. Hempel (2001) found that Chinese and U.K. performance views focused on noteworthily different aspects. For instance, Chinese supervisors used more personal attributions, notably obedience, while U.K. supervisors used significantly more behavioral or skill-based attributions. Chinese and U.K. supervisors also differed significantly in the requirements of minimum supervision and communication skills. While the Chinese supervisors did not see these factors as relevant, they are critical for the U.K. supervisors. Freedle and Kostin (1997) found that cultural differences in the use and interpretation of common words (e.g., gullible, credulous) can lead to differential item functioning. This feature can critically affect both SWB measures (particularly, PA and NA adjective-based scales) and performance assessments. For example, Chinese managers tend to define performance in terms of personal traits such as loyalty, obedience, and morality, which contrast with the Western view more focused on outcomes (Aguinis, 2019; Hempel, 2001). There are not only differences in how performance is defined, but also in how it is evaluated. For example, Hempel (2001) found that job performance is evaluated through essays in Hong Kong, but this method is rarely used in Western companies, where rating scales are mainly used (Aguinis, 2019; Borman et al., 2017; Viswesvaran et al., 2001). Besides, the interrater reliability of the essays is very low, mainly due to their unstructured format (Aguinis, 2019). The method of performance measurement is relevant, as it was found that the interrater reliability of supervisory ratings varies according to their purpose (e.g., research vs. administrative purposes) and the nature (e.g., mono-item scales, multi-item scales) (Salgado & Moscoso, 1996, 2019a; Salgado et al., 2016). Finally, there are also critical differences across countries in employment policies, regulations, and the legal environments that affect what, when, how, and by whom job performance is evaluated (see Shen et al., 2017, for a review of such practices in 22 African, American, European, Asian, and Pacific-region countries). Based on the above considerations of the cross-cultural and national differences that might affect SWB and performance definitions, evaluations, and measures, it would not be a surprise if there were cross-cultural differences in the relationship between SWB and job performance. However, this issue has not been systematically examined until now. Thus, research is required to shed some light on this issue. Therefore, we posit the following research question: Research Question 1: Is the magnitude of the relationship between SWB and job performance the same across nations and cultures? Moderator Effect of the Cross-sectional vs. Longitudinal Design Type on the SWB-Job Performance Relationship Research on the SWB-job performance relationship used two types of design. Some studies were cross-sectional, providing concurrent validity evidence, while others were longitudinal, providing predictive validity evidence (Boehm & Lyubomirsky, 2008; Moscoso & Salgado, 2021; Walsh et al., 2018). In the first case, SWB and job performance were evaluated at the same time or with a minimal lag (e.g., with an interval of a couple of weeks). In the second case, job performance was evaluated some months later, and in some cases, three, four, or five years later than the evaluation of SWB. For example, Cropanzano and Wright (1999), Salgado et al. (2019), and Wright and Staw (1999) used a longitudinal design, while Shaw and Gupta (2001), Wright et al. (2007), and Haider et al. (2018) used a cross-sectional design. In our database, the majority of the studies used a cross-sectional design (81.8% for cognitive SWB, 73.8% for affective SWB, and 78.6% for overall SWB). It is well-known that cross-sectional designs are weaker when it comes to establishing causal links (Boehm & Lyubomirski, 2008; Walsh et al., 2018). On the other hand, longitudinal designs cannot control for the effects of transient error and, sometimes, produce smaller effect sizes. Also, they cannot exclude the possibility that the relationship between SWB and job performance could be due to a third variable, correlated with SWB (Walsh et al., 2018). In other research areas, there is some evidence that the type of design is a powerful moderator of the correlation. For example, in the personality domain, Ones et al. (2012) found that the validity of integrity tests was 19% larger for concurrent designs. In the area of personnel interviews, Salgado and Moscoso (1995) found that the validity was 33% larger for the concurrent designs. Pearlman et al. (1980), in their meta-analysis of clerical ability tests, mentioned that the mean validity in predictive designs was slightly larger than the average validity of concurrent designs for five test types; they found the reverse for four test types, and the means were mostly the same in the two designs for one test type. In the case of job satisfaction, Judge et al. (2001) found that the relationship between job satisfaction and job performance was moderated by the study design (cross-sectional vs. longitudinal), being 35% larger for the concurrent designs. In the SWB domain, Cropanzano and Wright (1999) and Salgado et al. (2019) found that the correlation between SWB and job performance was larger for the concurrent designs. However, this moderating effect has not been systematically examined in the SWB-job performance relationship. Beyond the fact that the correlation size between SWB and job performance may be different depending on the nature of the design (i.e., cross-sectional vs. longitudinal), the examination of this potential difference is important to provide further clarification about two rival hypotheses on the causal direction between SWB and job performance (Boehm & Lyubomirsky, 2008; Walsh et al., 2018). The first hypothesis is that hard work and higher performance determine SWB, i.e., they are antecedents of SWB. Boehm and Lyubomirsky (2008) proposed the alternative hypothesis that SWB affects career success (including job performance).The longitudinal and experimental literature reviewed by Boehm and Lyubomirsky (2008), and Walsh et al. (2018) suggested that the alternative hypothesis might be as plausible as the one that suggests that performance precedes SWB. None of the previous meta-analyses (i.e., Erdogan, et al., 2012; Ford et al., 2011; Moscoso & Salgado, 2021; Shockley et al., 2012) examined the potential moderating effects of the nature of the design, or the potential causal precedence of SWB over job performance, as suggested by Lyubomirsky and colleagues (Boehm & Lyubomirsky, 2008; Walsh et al., 2018). Based on the mentioned findings, we state our second research question: Research Question 2: Does the study type (cross-sectional vs. longitudinal) moderate the validity of SWB and its components as predictors of job performance? Main Objectives This study has three main goals: (1) to estimate the relationship between global SWB and its components with job performance; (2) to estimate the validity of SWB across countries/regions as a predictor of job performance; and (3) to examine the moderator effect of the study type (cross-sectional vs. longitudinal). In order to achieve these goals, we conducted a series of psychometric meta-analyses. Literature Search Electronic searches, examination of the references of previous meta-analyses, and contact with international researchers were used to locate the studies included in this meta-analysis. The electronic searches in the main databases (e.g., Psyclit, Google Scholar, ERIC) provided 1387 references. We examined the full content of each document and we excluded the majority of them because (a) they did not provide a correlation coefficient between SWB and job performance, (b) they provided a multiple correlation but not bivariate correlations, (c) they provided only the significant correlations, (d) the measure of job performance was obtained from subordinates, and (e) some valid documents were excluded because they were duplicated. This strategy provided 50 usable documents (58 independent samples). The examination of the references of previous meta-analyses and the references of the collected documents to identify potential papers were not included in the previous set. This strategy provided seven documents (eight independent samples). Finally, we contacted 15 international researchers from the USA, the United Kingdom, Germany, Italy, The Netherlands, Belgium, Spain, and France to obtain previously unidentified papers. We obtained six documents (six independent samples) with this strategy. Therefore, the final database consisted of 69 documents (articles, unpublished papers, and unpublished doctoral dissertations) with 78 independent samples. For the Meta-Analysis Reporting Standards (MARS) specified in the Publication Manual of the American Psychological Association (2020; available at https://apastyle.apa.org/manual/related/JARS-MARS.pdf) and the Preferred Reporting Items for Systematic Reviews and Meta-analysis (PRISMA), Table 1 contains the following information from each study for each job performance category: (1) study source, (2) SWB component, (3) country, and (4) design study (concurrent vs. longitudinal). Table 1 List of Studies for the SWB-Job Performance Meta-analysis 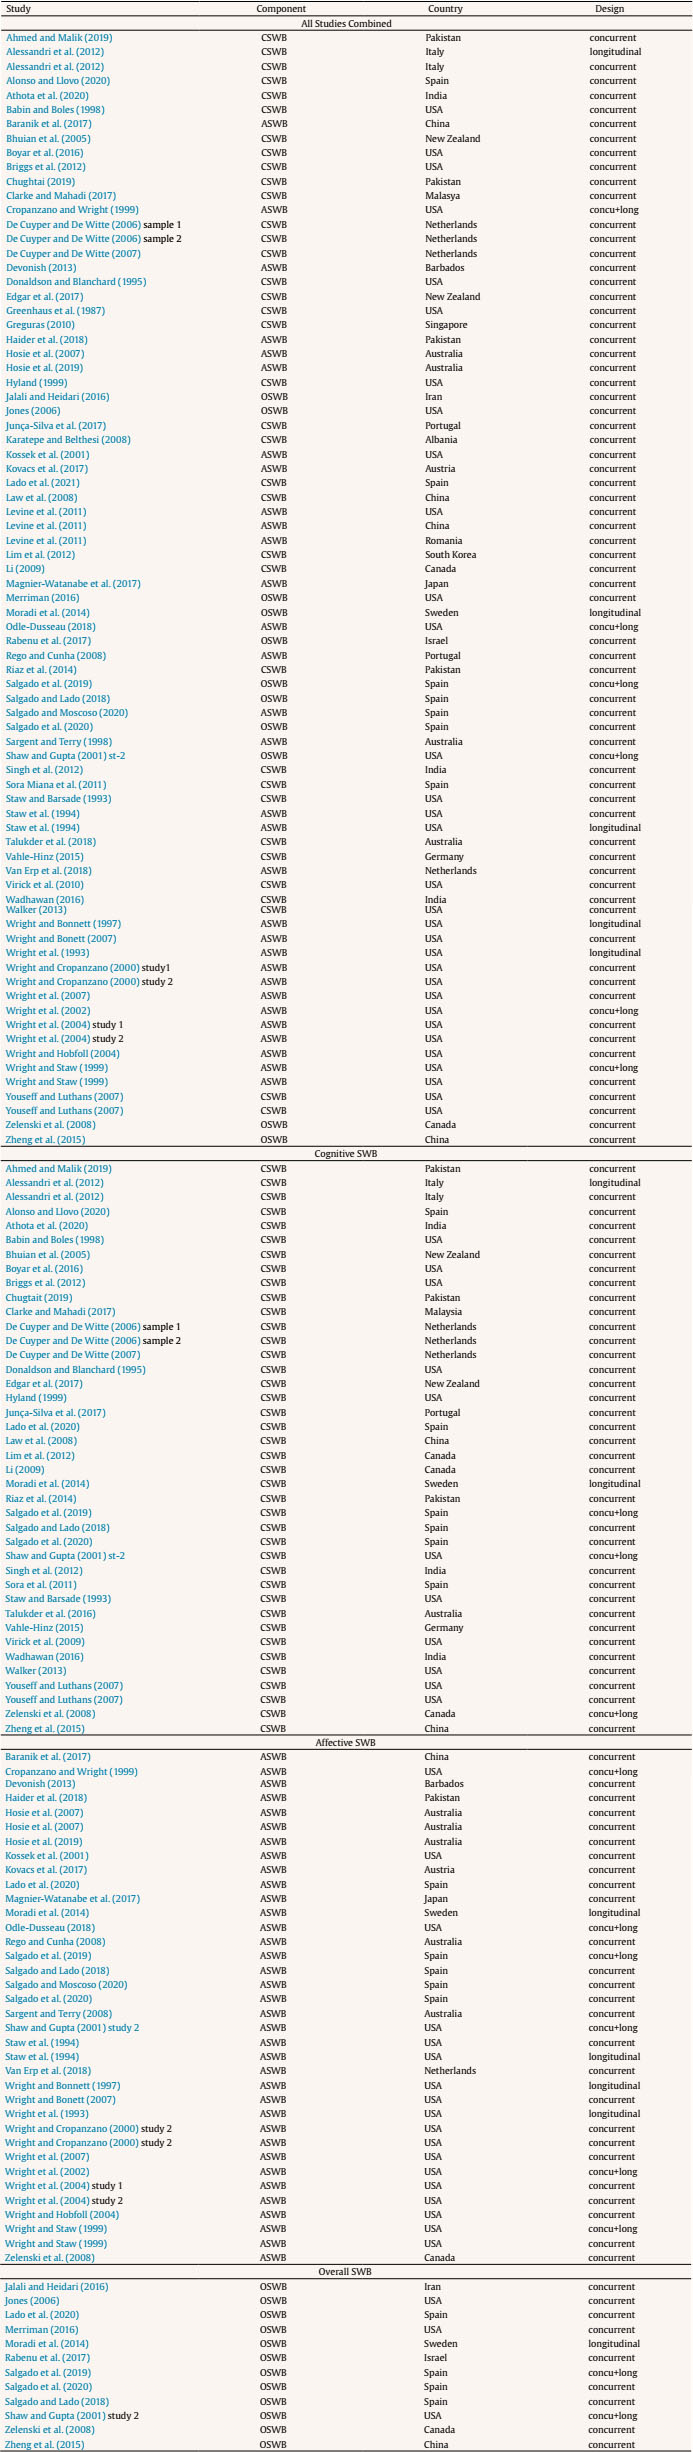 Note. CSWB = cognitive subjective well-being; ASWB = affective subjective well-being; OSWB = overall subjective well-being. The period covered by this meta-analysis was 27 years (1993-2020). The list of the documents appears in the section of references. Table 1 contains the list of studies and the dataset. The Bioethics Committee of our university has declared the meta-analyses carried out with published and unpublished studies exempt from approval if they do not include personal identification data. Inter-Coder Agreement The two authors of this study, both with experience conducting and publishing meta-analyses, coded all correlation coefficients independently. For each study, we compared eleven categories of data points: (a) sample size, (b) correlation coefficient, (c) SWB measure, (i.e., cognitive SWB, affective SWB, and overall SWB), (d) design type (longitudinal vs. cross-sectional), (e) predictor reliability, (f) job performance reliability, (g) published vs. unpublished study, (h) study year, and (i) country. To establish the level of inter-coder agreement, we identified the number of data points and the number of disagreements. There were 870 data points in this meta-analysis, with 838 agreements and 32 disagreements, yielding a 96.4% level of agreement. Disagreements were resolved by referring back to the studies and discussion between the two authors until consensus was reached. Identification of Outliers It is widely accepted among meta-analysts that meta-analytic estimates (i.e., average correlation and variance) can be biased by extreme or erroneous data points (Huffcutt & Arthur, 1995; Schmidt & Hunter, 2015; Webster, 2019). An outlier is a data point that seems to be well separated from the remaining data points of the distribution, that is, a data point that yields an atypical result (Viechtbauer & Cheung, 2010; Webster, 2019; Whetzel et al., 2014). Outliers have two main effects in meta-analysis. First, they slightly change the average effect size estimate, and second, they increase the observed variability (i.e., observed variance and SD) substantially. In this meta-analysis, we used two outlier criteria. The first outlier criterion considered the distribution of the results reported in the individual studies, that is, a random arrangement of the values around the mean effect size. Then, we calculated the units of standard deviation that each effect size deviated from the average effect size found in each meta-analysis (Wilcox, 2014). We treated a study as an outlier when three or more units of standard deviation separated each result from the mean. Therefore, based on the first criterion, we considered that a validity estimate was a potential outlier if the probability of being a member of the distribution was p < .001. Our second criterion was the sample adjusted meta-analytic deviance statistic (SAMD) by Huffcutt and Arthur (1995; see also Beal et al., 2002). To the best of our knowledge, SAMD is the only outlier detection statistic developed to be used explicitly in the meta-analysis of correlations. This technique is based on the same logic as other well-known influence statistics, such as Cook’s distance and the DFFITS (Huffcutt & Arthur, 1995; Viechtbauer & Cheung, 2010). However, the SAMD considers the sample size (i.e., sampling error), which is not considered in typical bivariate influence statistics as they assume that all data points have equal status. Moreover, Beal et al. (2002) showed that the SAMD statistic presents a normal distribution when the average sample size per study is greater than 30 individuals, the average r is less than .50, and the number of studies is greater than 5, with a bias of less than .02. As SAMD distributes normally, Beal et al. (2002) suggested that a cutoff point of 1.96 can be used to decide what correlation constitutes an outlier. We have programmed the SAMD formula in Excel to carry out this analysis. To summarize, the two outlier criteria used in the current study are (1) (|routlier - r|) / SD ≥ 3 and (2) SAMD. The two outlier criteria agreed as they identified two studies, with four validity coefficients, as potential outliers. They were the study of Moradi et al. (2014), which reported three validity coefficients of -.17, -.14, and -.17, and the study of Singh et al., (2012), which reported a validity coefficient of -.32. The corresponding SAMD statistics were 4.07, 4.65, 4.87, and 11.16, all considerably larger than 1.96. The SD units below the mean were 3.17, 3.41, 5.75, and 4.42, respectively, all of them larger than 3 SD units. Therefore, the studies of Moradi et al. (2014) and Sing et al. (2012) were considered outliers in this study, and meta-analyses were done with and without these two studies. The effects of these two outliers were substantial on the observed variance adding artifactual variance, as can be seen in Table 2. Publication Bias Rothstein et al. (2005) defined publication bias as “the term for what occurs whenever the research that appears in the published literature is systematically unrepresentative of the population of completed studies” (p. 1). Schmidt and Hunter (2015) posited that a critical issue of all meta-analyses is the potential bias due to the availability of one kind of study only (e.g., published studies, significant studies). Although we have made a significant effort to include as many published and unpublished studies as possible, the average estimates could be affected by some kind of publication bias. Following the recommendations of Borenstein (2005), Kepes et al. (2012), and Schmidt and Hunter (2015), this meta-analysis used three methods of detecting potential publication bias: (a) subgroup comparison of published and unpublished studies, (b) Pearson correlation between the sample size and the effect size, and (c) subgrouping a cumulative meta-analysis with a forest plot of the average estimates of the average validity. Table 2 Effects of the Outliers on the Observed Variance of the Meta-analysis 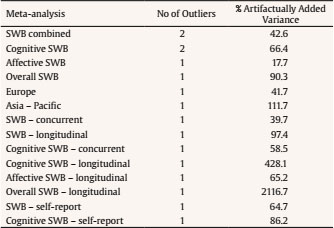 Artifact Distributions SWB reliability. The reliability of overall SWB, cognitive SWB, and affective SWB was estimated using the internal consistency reported in the primary studies. When a study did not report the reliability, we used the average value of the reliability distribution of all combined studies (rxx = .81) as the study reliability. Next, we developed an empirical distribution for overall SWB, Cognitive SWB, and affective SWB. Descriptive statistics of the specific distributions for each meta-analysis appear in Table 3. Table 3 Predictor Reliability Distributions 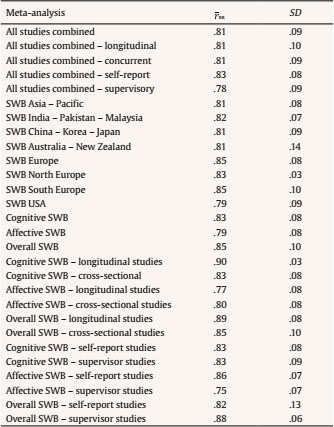 Note. SWB = subjective well-being. Job performance reliability. In the studies included in the dataset, job performance was assessed with self-reports and/or supervisor ratings. As some studies did not provide the reliability of job performance, we developed an empirical distribution of internal consistency coefficients for self-reports of job performance. In the case of the supervisor ratings, we developed an empirical distribution considering the nature of the supervisor ratings. Salgado and Moscoso (2019a) found that the purpose of the rating (research vs. administrative) is a powerful moderator of interrater reliability. We used the distributions developed by Salgado and Moscoso (2019a) according to the following rules: (1) if the supervisor rating were collected for research purposes, we used .61 as an estimate of the interrater reliability; (2) if the supervisor ratings were collected for administrative purposes, we used an estimate of .48 as interrater reliability. If the job performance measure was a self-report, and the study did not provide the coefficient, we used the mean value of the distribution as the reliability (.80). Table 4 shows the descriptive statistics of the reliability distributions for each meta-analysis conducted in this study. As can be seen, the average coefficients ranged from .61 to .81. Table 4 Reliability Distributions of Job Performance 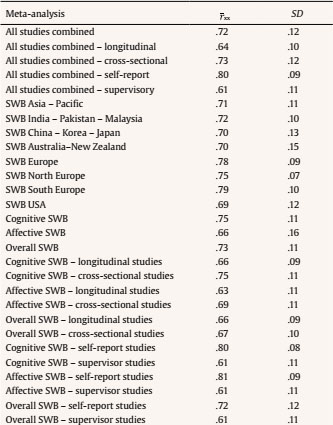 Note. SWB = subjective well-being. Publication Bias Analysis Table 5 reports the results of the publication bias analyses. As can be seen, the total of published and unpublished studies, on average, show the same effect size (.238 vs. 234). Therefore, we can reject the idea that the source of publication distorts the average validity. Table 5 Comparison of the Average Correlation for Published and Unpublished Studies 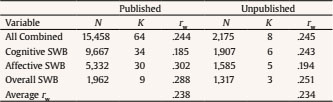 Note. rw = average weighted-sample correlation; N = sample size; K = no. of studies; SWB = subjective well-being. The second approach to detecting publication bias was to obtain the Pearson correlation between the sample size and the correlation size for SWB (all studies combined), cognitive SWB, affective SWB, and overall SWB. The correlations were -.12, -.03, -.11, and .03, respectively, and none of them was statistically significant. Therefore, the sample size does not affect the correlation size. Our third method of analyzing publication bias was cumulative meta-analysis (CMA). There is broad agreement that CMA is the most robust technique for detecting publication bias (Borenstein, 2005; Kepes et al., 2012; Schmidt & Hunter, 2015). CMA consists of a series of meta-analyses in which new correlations are added one-by-one and a new average correlation is obtained with the addition of each new validity. Borenstein (2005) and Schmidt and Hunter (2015) posited that the studies should be ranked from the study with the largest sample size to the study with the smallest sample size. In the present case, the average correlation and its standard error are calculated, and a moving forest plot is developed. The absence of publication bias is observed when a sustained line is described after studies are added. On the contrary, if the addition of small-sample studies changed the average correlation and its standard error, this would be evidence of publication bias. We developed cumulative forest plots for the meta-analyses of SWB. Figures 1 to 4 present the results of the CMAs for all studies combined and the three cross-cultural regions (i.e., USA, Europe, and Asia-Pacific region). As can be seen, they showed evidence against publication bias for SWB-job performance relationships. The point estimate established very rapidly in all the cases, and it did not shift with the inclusion of additional studies. Also, we carried out CMAs for all the combination SWB-job-performance-moderators, and the results were similar. Figure 1 Forest-Plot CMA for All Studies Combined. 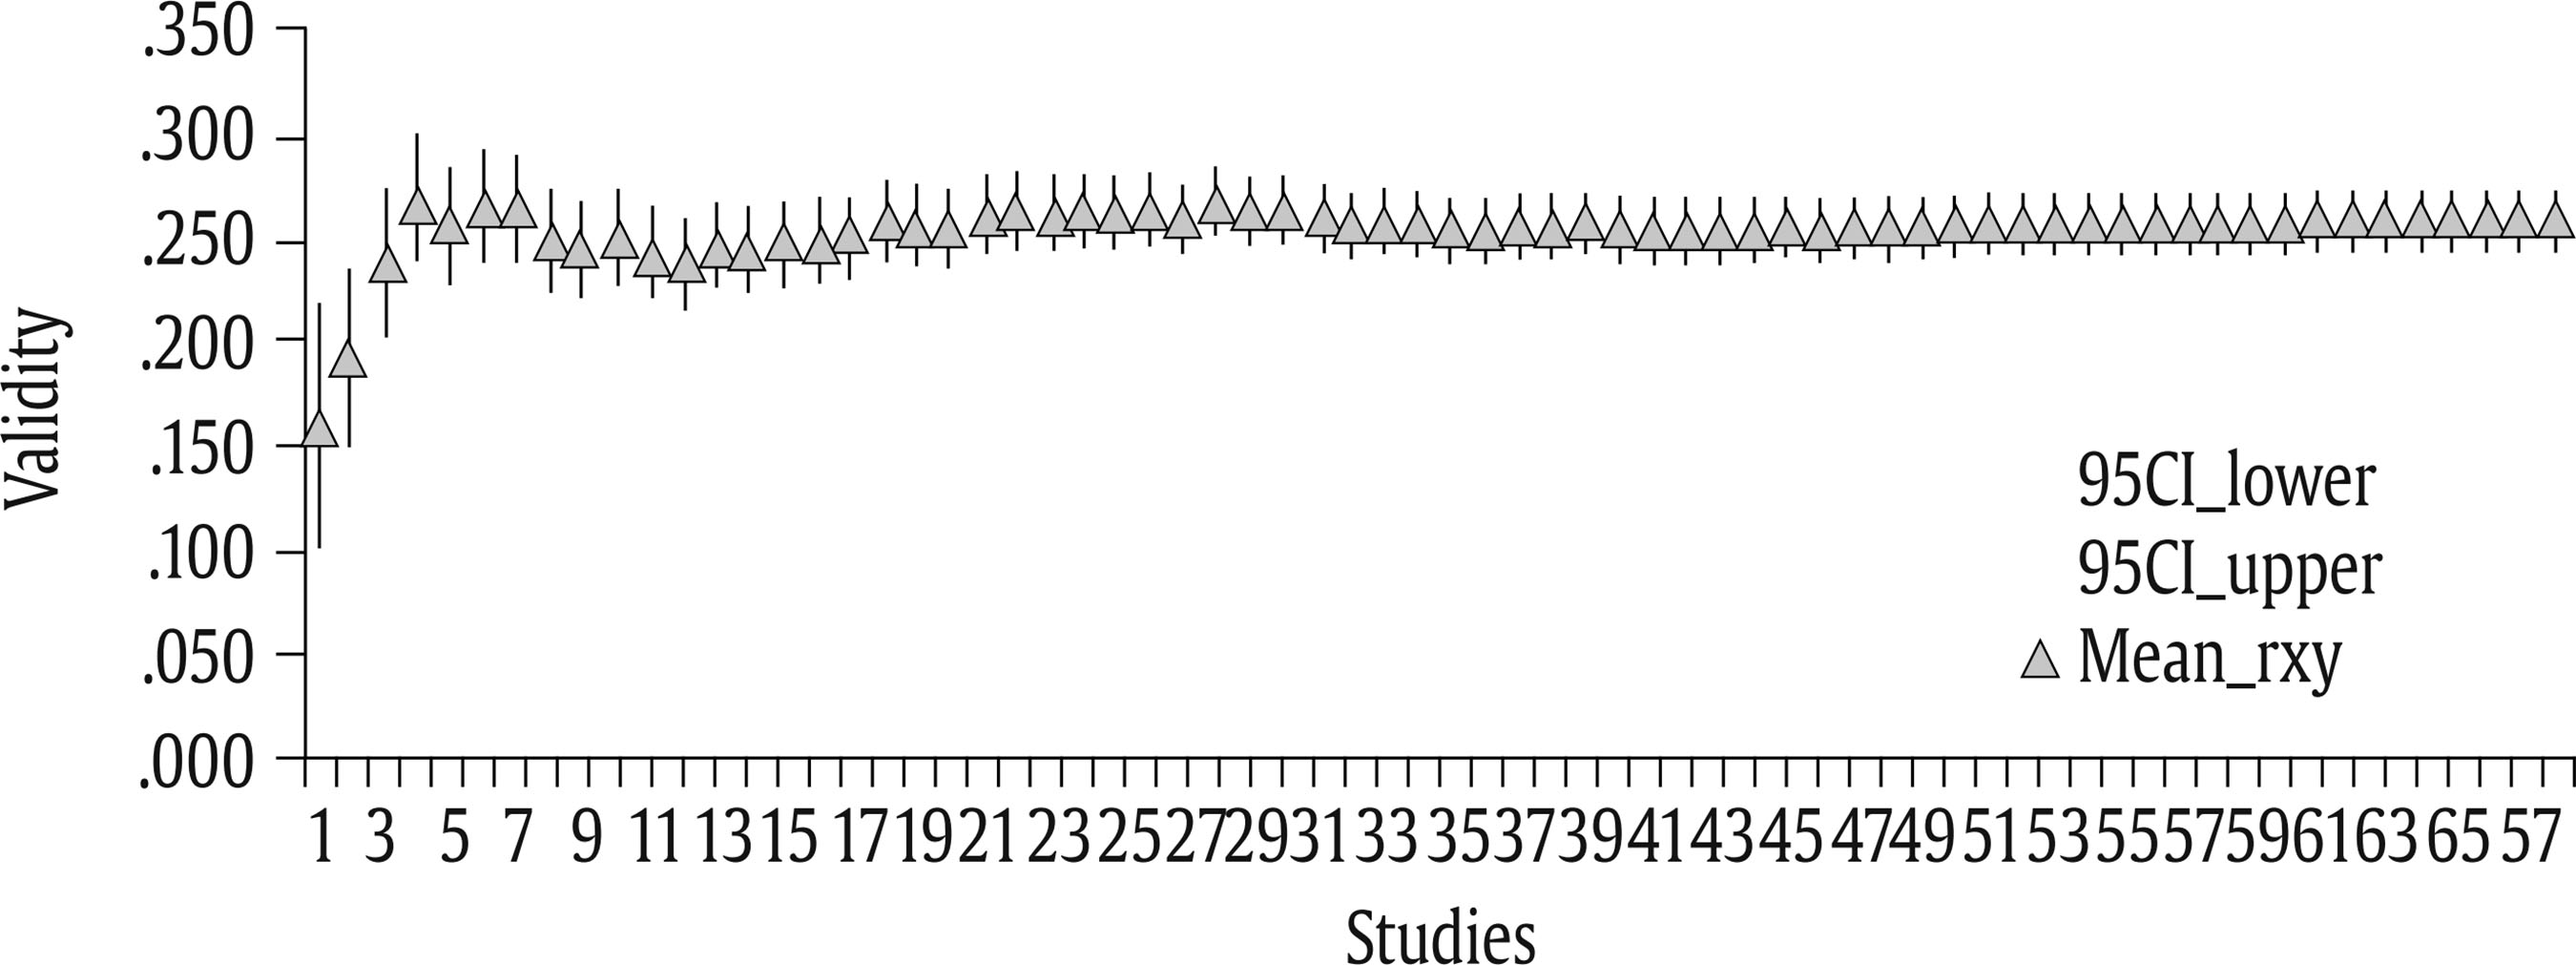 Figure 2 Forest-Plot CMA for Studies Carried Out in the USA. 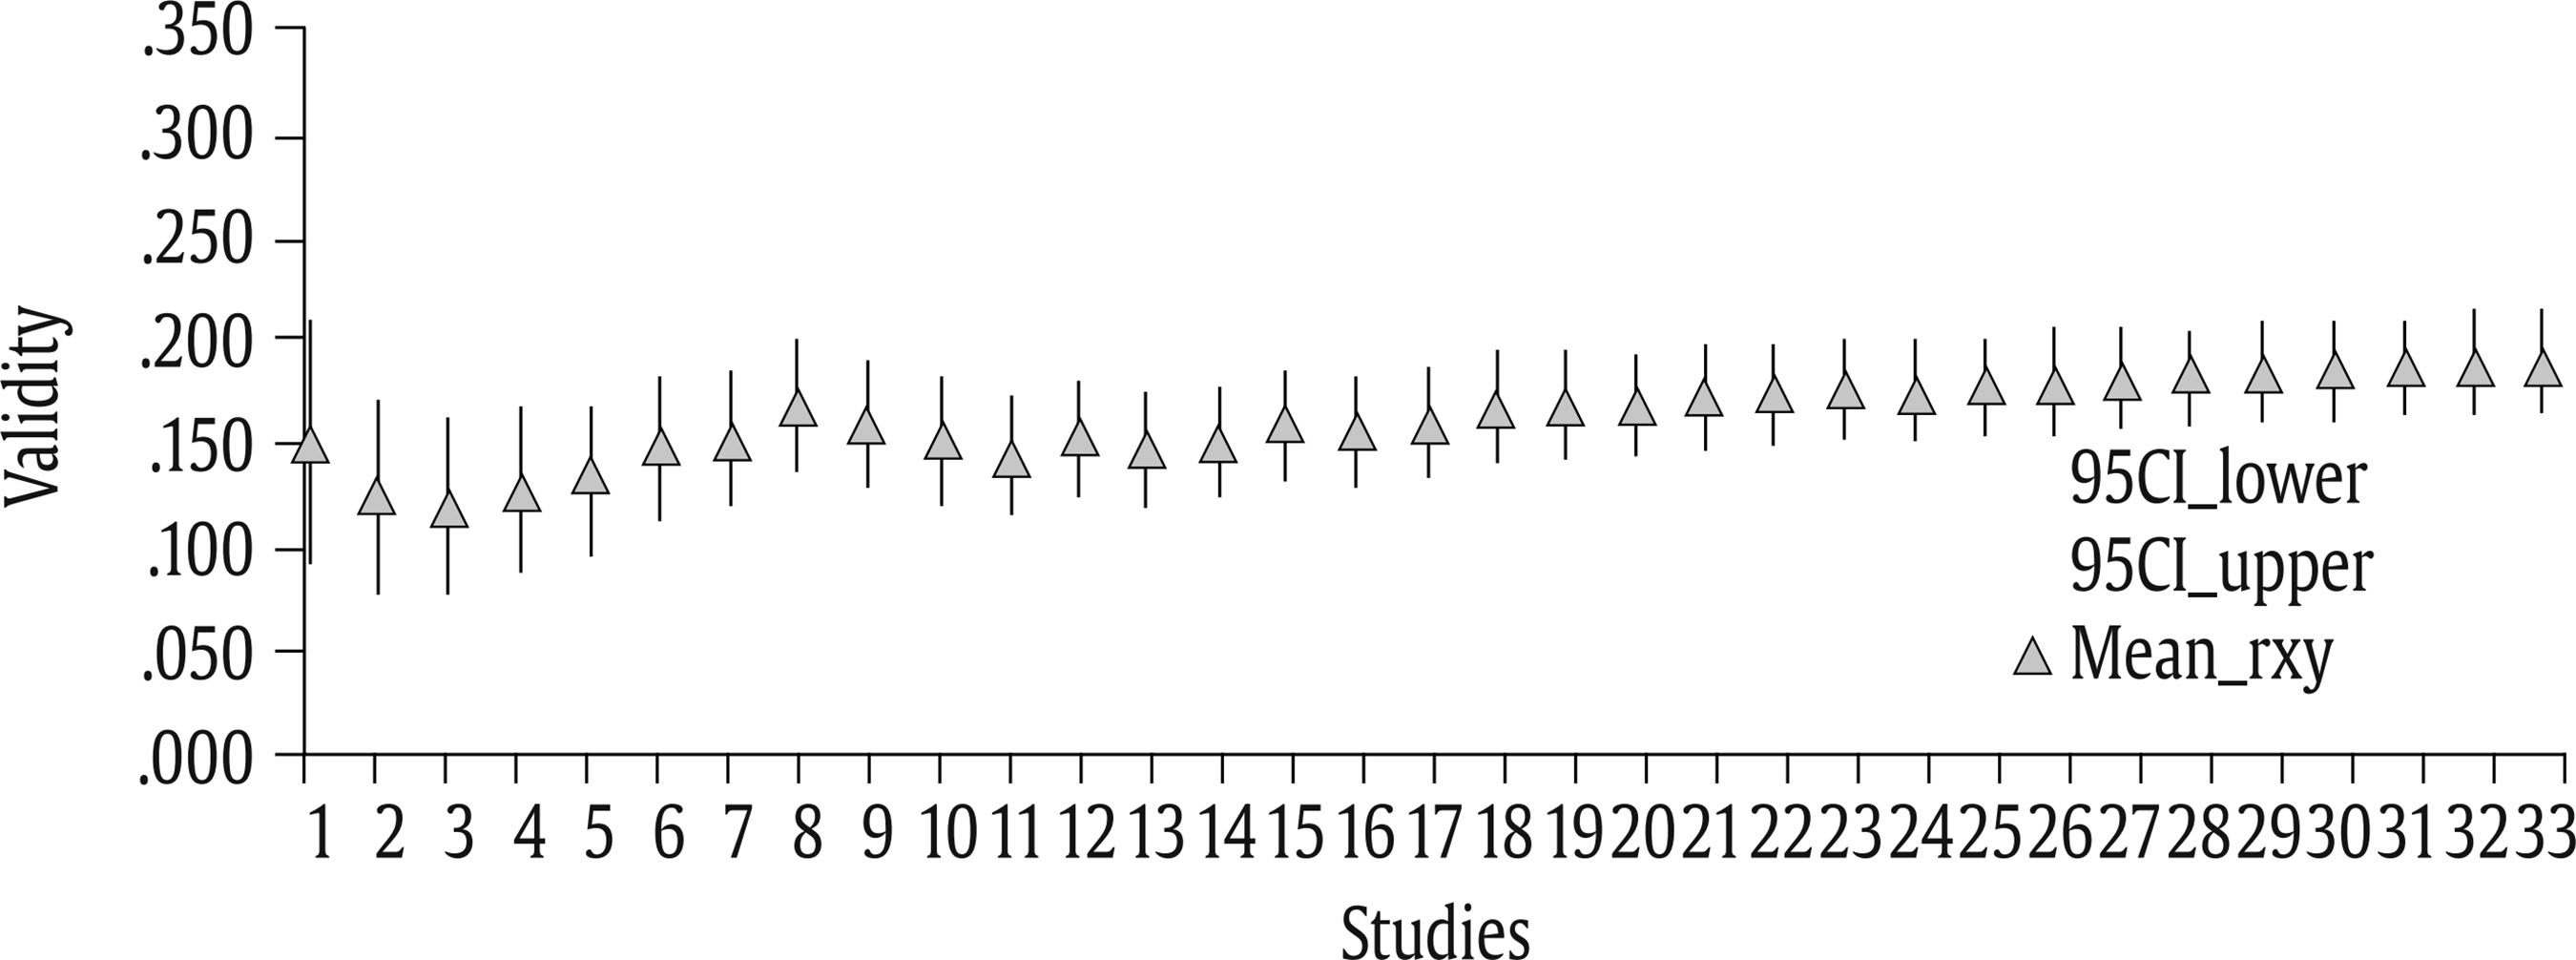 Figure 3 Forest-Plot CMA for the Studies of the Asia-Pacific Region.  Figure 4 Forest-Plot CMA for Studies Carried Out in Europe.  As a whole, the results of the approaches used concur in that publication bias is not a relevant issue in this meta-analysis. Meta-analysis of Cognitive SWB, Affective SWB, Overall SWB, and Job Performance Relationship The first goal of this meta-analysis was to estimate the relationship between overall SWB, cognitive SWB and affective SWB with job performance. Table 6 reports the main results for the SWB-job performance relationships when the specific SWB estimate is not considered (SWB all studies combined), and for cognitive SWB, affective SWB, and overall SWB. The first two columns show the number of studies (K) and the total sample size (N). The next three columns present the mean observed correlation (rw), the observed variance (S2r), and the observed SDr. The next three columns show the operational validity (ρop), i.e., the observed correlation corrected by measurement error in job performance, the true correlation (ρt), and the standard deviation of the true correlation. Finally, the last three columns show the percentage of variance accounted for by the artifactual errors, the 95% confidence interval, and the 90% credibility value. For each SWB estimate, the correlations between SWB and job performance were pooled across moderators and cross-cultural regions. Therefore, this is the most global level of analysis on the SWB-job performance relationship. In what follows, we will concentrate our comments on the true correlation estimates as, in general, those comments can be applied to the observed correlation and the operational validity. Table 6 Results of the Meta-analysis for the Relationships of SWB-Job Performance 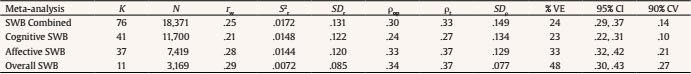 Note. SWB = subjective well-being; K = number of independent samples; N = total sample size; rw= mean observed validity; S2r = sample size weighted observed variance of the correlations; SDr = standard deviation of observed validity; ρop = operational validity; ρt = true correlation (validity corrected for criterion and predictor reliability); SDρ = standard deviation of ρ; % VE = percentage of variance accounted for by artifactual errors; 95% CI = 95% confidence interval of the true correlation; 90% CV = 90% credibility value based on the true correlation. As can be seen, the number of studies and the sample size vary considerably across the four categories. When all the studies were combined in a single category, the number of studies was practically twice the number of studies for cognitive SWB and affective SWB and five times the number of studies that used an overall measure of SWB. The true correlation estimates show that SWB and its components have a moderately large relationship with job performance, although the relationship is more robust for affective SWB (ρt = .37) than for cognitive SWB (ρt = .27). The relationship for overall SWB is ρt = .37, which is similar to the size for the affective SWB, and also more substantial than for cognitive SWB. When the type of SWB measures is ignored and all the studies are grouped in a single category, the results show that the correlation with job performance is .33. Table 7 Results of the Meta-analysis for the Relationships of SWB and Job Performance across Countries/Regions 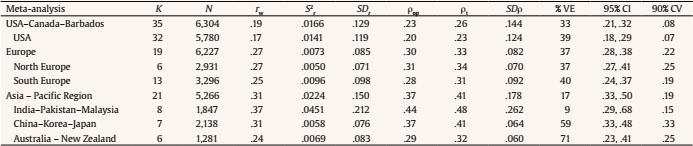 Note. SWB = subjective well-being; K = number of independent samples; N = total sample size; rw= mean observed validity; S2r = sample size weighted observed variance of the correlations; SDr = standard deviation of observed validity; ρop = operational validity; ρt = true correlation (validity corrected for criterion and predictor reliability); SDρ = standard deviation of ρ; % VE = percentage of variance accounted for by artifactual errors; 95% CI = 95% confidence interval of the true correlation; 90% CV = 90% credibility value based on the true correlation. As a whole , true correlations show that overall SWB, cognitive SWB and affective SWB are predictors of job performance. The 95% CI bounds are close to the true correlation in the four cases, which means that the relationship is strongly supported in the present sample of studies. The 90% credibility value (lowest bound of the 80% credibility interval) is positive in all the cases, and it indicates that the correlation generalized across studies and regions, with at least that value in 90% of the cases. Nevertheless, the width of the CrI is large enough to suggest that moderators can affect the estimated relationship between SWB and job performance. The percentage of explained variance and the width of the CrI suggest that a search for moderators is appropriate in the case of the SWB-job performance relationships. Meta-analysis by Cross-cultural Regions The first Research Question asked whether the SWB-job performance relationship varied across nations and cultures. To answer this question, we clustered the collected studies in three big groups of nations/cultures: USA-Canada, Europe, and the Asia-Pacific region. The first group included the studies conducted with samples from the USA and Canada plus a study conducted in Barbados. The European group included the studies conducted in the European countries (i.e., Albania, Austria, Germany, Italy, The Netherlands, Portugal, Romania, Spain, and Sweden). The third group is more heterogeneous than the two previous, as it included studies conducted in Asian countries, the Middle East, and Pacific regions (i.e., Australia, China, India, Iran, Japan, Malaysia, New Zealand, Pakistan, Singapore, and South Korea). As a whole, 23 countries were represented in this meta-analysis. Table 7 reports the results of the meta-analyses for the three big cross-cultural regions. The order of the columns in Table 7 is the same as in the previous Table. The group USA-Canada is the most represented in the database and contains 35 studies. Europe and the Asia-Pacific region are similarly represented with 19 and 21 studies, respectively. However, the total sample size is bigger in Europe than in the other two groups. The true correlation estimates show that the relationship between SWB and job performance is stronger for the Asia-Pacific region (ρt = .41) than for Europe (ρt = .33) and USA-Canada (ρt = .26). These three estimates indicate that the answer to Research Question 3 is that there are substantial cross-cultural differences in the SWB-job performance relationship. The bounds of the 95% CI indicate that the relationship is strongly supported in the present sample of studies. Therefore, cross-cultural differences are a relevant factor in a comprehensive explanatory model of the SWB-job performance relationship. In relation to the observed variability of the correlations, the Asia-Pacific region shows more observed variance (S2 = .0224) than Europe (S2 = .0073), and the USA-Canada region (S2 = .0166), which is not surprising if one considers that the Asia-Pacific region included the most heterogeneous group of countries, with more diversity in religions, political systems, and socio-economic variables. Consequently, the percentage of explained variance is relatively small for this group. Nevertheless, the 90% CV shows that the true correlation generalizes across these countries, with a value larger than .15 in 90% of cases. In addition to the previous meta-analyses, we divided the studies carried out in Europe into two subgroups, Northern Europe and Southern Europe, and the studies carried out in the Asia-Pacific into three subgroups, India-Pakistan-Malaysia, China-Korea-Japan, and Australia-New Zealand. The results for these five subgroups also appear in Table 7. As can be seen, the more substantial true correlations correspond to the India-Pakistan-Malaysia and China-Korea-Japan subgroups (.48 and .41, respectively). The two European subgroups showed true correlations .34 and .31 for North-European countries and South-European countries, respectively, and the true correlation for the Australia-New Zealand subgroup (ρ = .32) was similar to the one for the European subgroups. These three subgroups showed noticeably lower correlations than the India-Pakistan-Malaysia and China-Korea-Japan subgroups. The 90% CV indicated that the relationship between SWB and job performance generalizes within and across cross-cultural regions. In general, the variability was small, except for the India-Pakistan-Malaysia subgroup. Table 8 Results of the Meta-analysis for the Combinations of SWB-Job Performance-Design Type (Concurrent vs. Longitudinal) 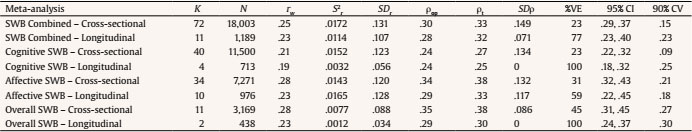 Note. SWB = subjective well-being; K = number of independent samples; N = total sample size; rw= mean observed validity; S2r = sample size weighted observed variance of the correlations; SDr = standard deviation of observed validity; ρop = operational validity; ρt = true correlation (validity corrected for criterion and predictor reliability); SDρ = standard deviation of ; % VE = percentage of variance accounted for by artifactual errors; 95% CI = 95% confidence interval of the true correlation; 90% CV = 90% credibility value based on the true correlation. Ideally, a more fine-grained meta-analysis would be desirable, for example, at the country level, or the main religion level (for several countries). However, the number of studies per country is too small to conduct this analysis, except in the case of the USA. In this case, when the studies from Canada and Barbados were excluded from the analysis, the true correlation for the USA was the smallest of the estimates reported in Table 7 (ρt = .23, K = 32, N = 5,708). Both the percentage of explained variance and the width of the 80% CrI suggest that an analysis of moderators would be of interest to the three cross-cultural regions, but the number of studies does not permit that analysis. Besides, the moderators might not be the same for the three regions. For example, the main religion of the country may be more relevant for the Asia-Pacific region than for Europe, as there is more variety of religions in the Asia-Pacific region than in Europe. Meta-analysis by SWB-Design Type Table 8 presents the results of the meta-analyses conducted to examine the potential moderator effects of the design type on the relationship between SWB and job performance. In this case, we conducted the eight meta-analyses that resulted from the combination of the four SWB estimates (i.e., all studies combined, cognitive SWB, affective SWB, and overall SWB) by the two types of designs (i.e., cross-situational and longitudinal). The true correlation was greater for the four meta-analyses of the studies which used a cross-situational design. The differences were very small for the meta-analyses of all studies combined and for cognitive SWB, but they were more substantial for the meta-analyses of affective SWB and overall SWB. On average, the cross-sectional designs show a 13% larger true correlation than the longitudinal designs (.34 vs. .30, respectively). On average, artifactual errors explain 84% of the observed variance of the correlations in the studies which used a longitudinal design. However, the artifactual errors accounted for 30% of the observed variance in studies that used a cross-sectional design. This result is mainly due to the fact that, on average, cross-sectional studies used samples almost twice times larger than the longitudinal studies did. The 90% CVs were positive and considerably different from zero in all the cases, which indicates that the relationship of SWB and its components generalizes across studies for both the cross-sectional and longitudinal designs. However, the size of the generalizability is larger for the longitudinal designs than for the cross-sectional designs. Therefore, the answer to research question two is that the study design matters as it moderates the correlation of SWB and its components with job performance, although the magnitude of the design influence suggests that the design is not a critical factor. Nevertheless, the results do not permit us to establish that there is a stronger relationship in one direction that in the other (i.e. job performance to SWB vs. SWB to job performance), as the majority of the studies contain a single measure of SWB and job performance. This limitation does not allow us to discard the possibility that the relationship between SWB could be due to a third variable correlated with SWB, or to the previous effects of SWB on job performance. A more appropriate design would require three or more SWB measures and three or more measures of job performance, appropriately separated in time. Unfortunately, our dataset does not contain these kinds of studies. Summary of the Findings The main finding is that SWB is moderately correlated with job performance, independently if it is measured as affective SWB, cognitive SWB, or as overall SWB. In the second place, all the meta-analytic estimates of validity showed that affective SWB was more highly correlated with job performance than cognitive SWB. In third place, the relationship between SWB and job performance varies depending on the cross-cultural regions, being higher for the Asia-Pacific region than for Europe and the USA. The findings also revealed that the type of design moderates the relationship between SWB and job performance. Previous meta-analyses by Erdogan et al. (2012), Ford et al. (2011), Moscoso and Salgado (2021), and Shockley et al. (2012) estimated, separately, the average correlation of the cognitive and affective components of SWB with job performance. However, they did not examine (a) the possibility that different nations and cultures might show a different degree of correlation between SWB and job performance, (b) if the two components of SWB showed similar correlation with job performance, (c) if despite the variability reported, there was evidence of generalizability in the relationships, (d) if the correlation had been influenced by potential moderators such as the design type (i.e., cross-sectional vs. longitudinal), and (e) if they were affected by publication bias. In examining these issues, this meta-analysis made several contributions. Firstly, the meta-analysis showed that overall SWB, cognitive SWB, and affective SWB moderately correlated with job performance. This finding means that overall SWB and its two components are valid predictors of performance at work. The correlation is similar or even higher than the one found for other well-known variables related to job performance, such as the Big Five personality dimensions, cognitive abilities, emotional intelligence, structured interviews, and in-basket tests (see, for instance, the meta-analyses of Connolly & Ones, 2010; Joseph & Newman, 2010; Judge et al., 2013; Ones et al., 2012; Otero et al., 2020; Salgado, 2017; Salgado et al., 2015; Salgado et al., 2007; Salgado & Moscoso, 2019b; Salgado & Tauriz, 2014; Van Rooy & Viswesvaran, 2004; Whetzel et al., 2014). Besides, the 90% credibility values for overall SWB, cognitive SWB, and affective SWB showed evidence of international validity generalization. Secondly, the meta-analysis contributed to clarify that there are some cross-cultural differences across countries/regions in the magnitude of the relationship between SWB and job performance. Our findings showed that the relationship was more robust in the Asia-Pacific region than in Europe and the USA-Canada region. More specifically, the findings showed that the relationship between SWB and job performance is more robust in India, Pakistan, China, Korea, and Japan than in the Northern and Southern European countries, Australia and New Zealand, the USA and Canada. In comparison with the rest of the countries/regions, the USA showed a smaller relationship. How can we account for the fact that the relationship between SWB and job performance is stronger for some countries than for others? This is a question that this meta-analysis does not permit us to answer. However, we can speculate, as Walsh et al. (2018) suggested, that the cultures that reinforce frequent low-arousal positive emotions (e.g., calm), not high-arousal ones (e.g., enthusiasm), and that simultaneously deemphasize low negative emotions (anger) can produce a stronger SWB-job performance relationship. On the other hand, we can also speculate that cultures that overemphasize hard working, reward those efforts, and emphasize long-term goals will also show a stronger SWB-job performance relationship. Another potential explanation is that the conceptions of what is high job performance vary across cultures. For instance, individualistic cultures can consider task performance more relevant, while collectivistic cultures may consider citizenship performance and commitment more relevant. The current database of studies does not permit us to go further in the required analysis, because the number of studies per cell is very small in some cases and because there are no studies in other cases. Future research should be conducted to identify the specific factors (e.g., cultural values) that determine those cross-cultural/national differences. Thirdly, the meta-analysis contributed to clarify the moderator role of the study design on the magnitude of the validity of SWB. On average, the validity was slightly higher in the cross-sectional studies than in the longitudinal ones (.34 vs. .30). As a percentage, the difference is 13%. This finding is also relevant to the debate on the advantages and limitations of the cross-sectional vs. longitudinal designs. At least, as far as SWB validity for predicting job performance is concerned, the design type does not seem to greatly affect the magnitude of the relationship critically. The current meta-analytic findings have implications for practice of work and organizational psychology. A potential practical implication is that SWB and its components are valid predictors of job performance across de world. This means that, despite potential cross-cultural differences, the SWB-job performance relationship is robust. Consequently, measures of SWB such as the SWLS and SPANE might be used for personnel purposes at least in the countries included in this meta-analysis. The meta-analytic results of the longitudinal studies could have practical implications. As the meta-analysis of those studies indicates that the level of SWB in a specific time correlates with the level of job performance in a subsequent time, with the two times typically separated by months (or even years), a practical implication is that overall job performance can be improved by enlarging employee SWB. One strategy could be to include measures of SWB together with the procedures typically used in hiring processes. Considering that the relationship between job performance and SWB tends to remain relatively stable over time, using SWB measures may help to increase organizational effectiveness. Alternatively, procedures that predict the level of employee SWB might be included in the selection processes. Research has found that personality factors are valid predictors of satisfaction with life and emotional balance (Lucas, 2018; Steel et al., 2008). Therefore, these procedures can also permit the forecasting of the level of SWB of future employees. This meta-analysis also has some limitations. A first limitation is that we were not able to find studies conducted in Central and South America and Africa. Walsh et al. (2018) also mentioned the absence of studies on SWB-job performance in those countries. Therefore, our findings cannot be generalized to those countries. Future studies should examine the research questions in African and Central and South American countries to develop a clear picture of the relationships between SWB, its components, and job performance in those countries. Based on the results of this study, we can speculate that the relationship would be similar to the ones found here, but this is just a conjecture that needs to be tested. A second limitation is that the number of studies did not permit to conduct meta-regression analysis using, for instance, Hofstede’s cross-cultural dimensions of values (i.e., power distance, individualism, uncertainty avoidance, masculinity, long-term orientation, and indulgence). Schmidt and Hunter (2015) mention that the number of studies required for a meta-regression should be as large as the number of cases required in an individual study. This fact means about 150-200 primary studies, but we were able to collect less than 80. In summary, this study contributes to the clarification of cross-cultural effects on the relationships between SWB and job performance across the world. It showed that the existence of a substantial relationship between SWB and job performance and that the validity generalizes across the countries. Also, the study clarifies that the design type moderates the relationship slightly. Conflict of Interest The authors of this article declare no conflict of interest. Acknowledgements We would like to express our profound gratitude to Ed Diener, Jim Harter, and Frank L. Schmidt for their insightful and helpful comments on previous versions of this paper. Cite this article as: Salgado, J. F. & Moscoso, S. (2022). Cross-cultural evidence of the relationship between subjective well-being and job performance: A meta-analysis. Journal of Work and Organizational Psychology, 38(1), 27-42. https://doi.org/10.5093/jwop2022a3 Funding: This research was partially supported by grant PSI2020-114984GB-100 from the Ministry of Education and Innovation to Silvia Moscoso and by grant PSI2017-87603-P from the Spanish Ministry of Education and Innovation to Jesús F. Salgado and Silvia Moscoso. References References marked with an asterisk indicate studies included in the metaanalysis. |
Cite this article as: Salgado, J. F. and Moscoso, S. (2022). Cross-cultural Evidence of the Relationship between Subjective Well-being and Job Performance: A Meta-analysis. Journal of Work and Organizational Psychology, 38(1), 27 - 42. https://doi.org/10.5093/jwop2022a3
silvia.moscoso@usc.es Correspondence: silvia.moscoso@usc.es (S. Moscoso).Copyright © 2026. Colegio Oficial de la Psicología de Madrid


 PDF
PDF e-PUB
e-PUB CrossRef
 JATS
JATS Print
Print SEND
SEND


